chrome-debugger-mcp 1.0.0 → 1.0.1
This diff represents the content of publicly available package versions that have been released to one of the supported registries. The information contained in this diff is provided for informational purposes only and reflects changes between package versions as they appear in their respective public registries.
- package/README.md +85 -125
- package/package.json +1 -1
package/README.md
CHANGED
|
@@ -8,61 +8,44 @@
|
|
|
8
8
|
|
|
9
9
|
An MCP server for breakpoint-driven Chrome debugging.
|
|
10
10
|
|
|
11
|
-
`chrome-debugger-mcp` exposes Chrome DevTools Protocol primitives as MCP tools so an AI agent can attach to a real Chrome tab, pause execution, inspect
|
|
12
|
-
|
|
13
|
-
This server is built for questions like:
|
|
14
|
-
|
|
15
|
-
- What is this variable at runtime?
|
|
16
|
-
- Why did this branch execute?
|
|
17
|
-
- What does the real API payload look like in the browser?
|
|
18
|
-
- Which function changed this state?
|
|
19
|
-
- Why does the UI fail only after a specific click or reload?
|
|
11
|
+
`chrome-debugger-mcp` exposes Chrome DevTools Protocol primitives as MCP tools so an AI agent can attach to a real Chrome tab, pause execution, inspect scope values, evaluate expressions inside the current call frame, and step through code with runtime facts instead of guessing from static source.
|
|
20
12
|
|
|
21
13
|
It is not a general browser automation server. The focus is runtime debugging.
|
|
22
14
|
|
|
23
|
-
###
|
|
15
|
+
### Core Capabilities
|
|
24
16
|
|
|
25
|
-
-
|
|
26
|
-
-
|
|
27
|
-
-
|
|
28
|
-
-
|
|
29
|
-
-
|
|
30
|
-
- Wait for the next pause, or wait for a specific file and line target
|
|
31
|
-
- Read scope variables from the paused frame
|
|
32
|
-
- Evaluate arbitrary JavaScript in the current call frame
|
|
33
|
-
- Step into, step over, step out, and resume execution
|
|
34
|
-
- Poll debugger state when the MCP client has short request timeouts
|
|
35
|
-
- Emit `_ui` payloads and logging messages that clients can surface to the user
|
|
17
|
+
- Attach to a real Chrome tab over CDP after explicit user confirmation
|
|
18
|
+
- Pause at breakpoints or `debugger;` statements and wait for the exact pause you expect
|
|
19
|
+
- Read local, closure, and module scope values from the paused frame
|
|
20
|
+
- Evaluate JavaScript in the current call frame and step execution forward
|
|
21
|
+
- Resume cleanly so the agent can continue with actual runtime values
|
|
36
22
|
|
|
37
|
-
###
|
|
23
|
+
### Demo
|
|
38
24
|
|
|
39
|
-
|
|
25
|
+
|
|
40
26
|
|
|
41
|
-
|
|
42
|
-
2. Pause execution at the right moment.
|
|
43
|
-
3. Read actual runtime values.
|
|
44
|
-
4. Step through code if needed.
|
|
45
|
-
5. Resume and clean up.
|
|
27
|
+
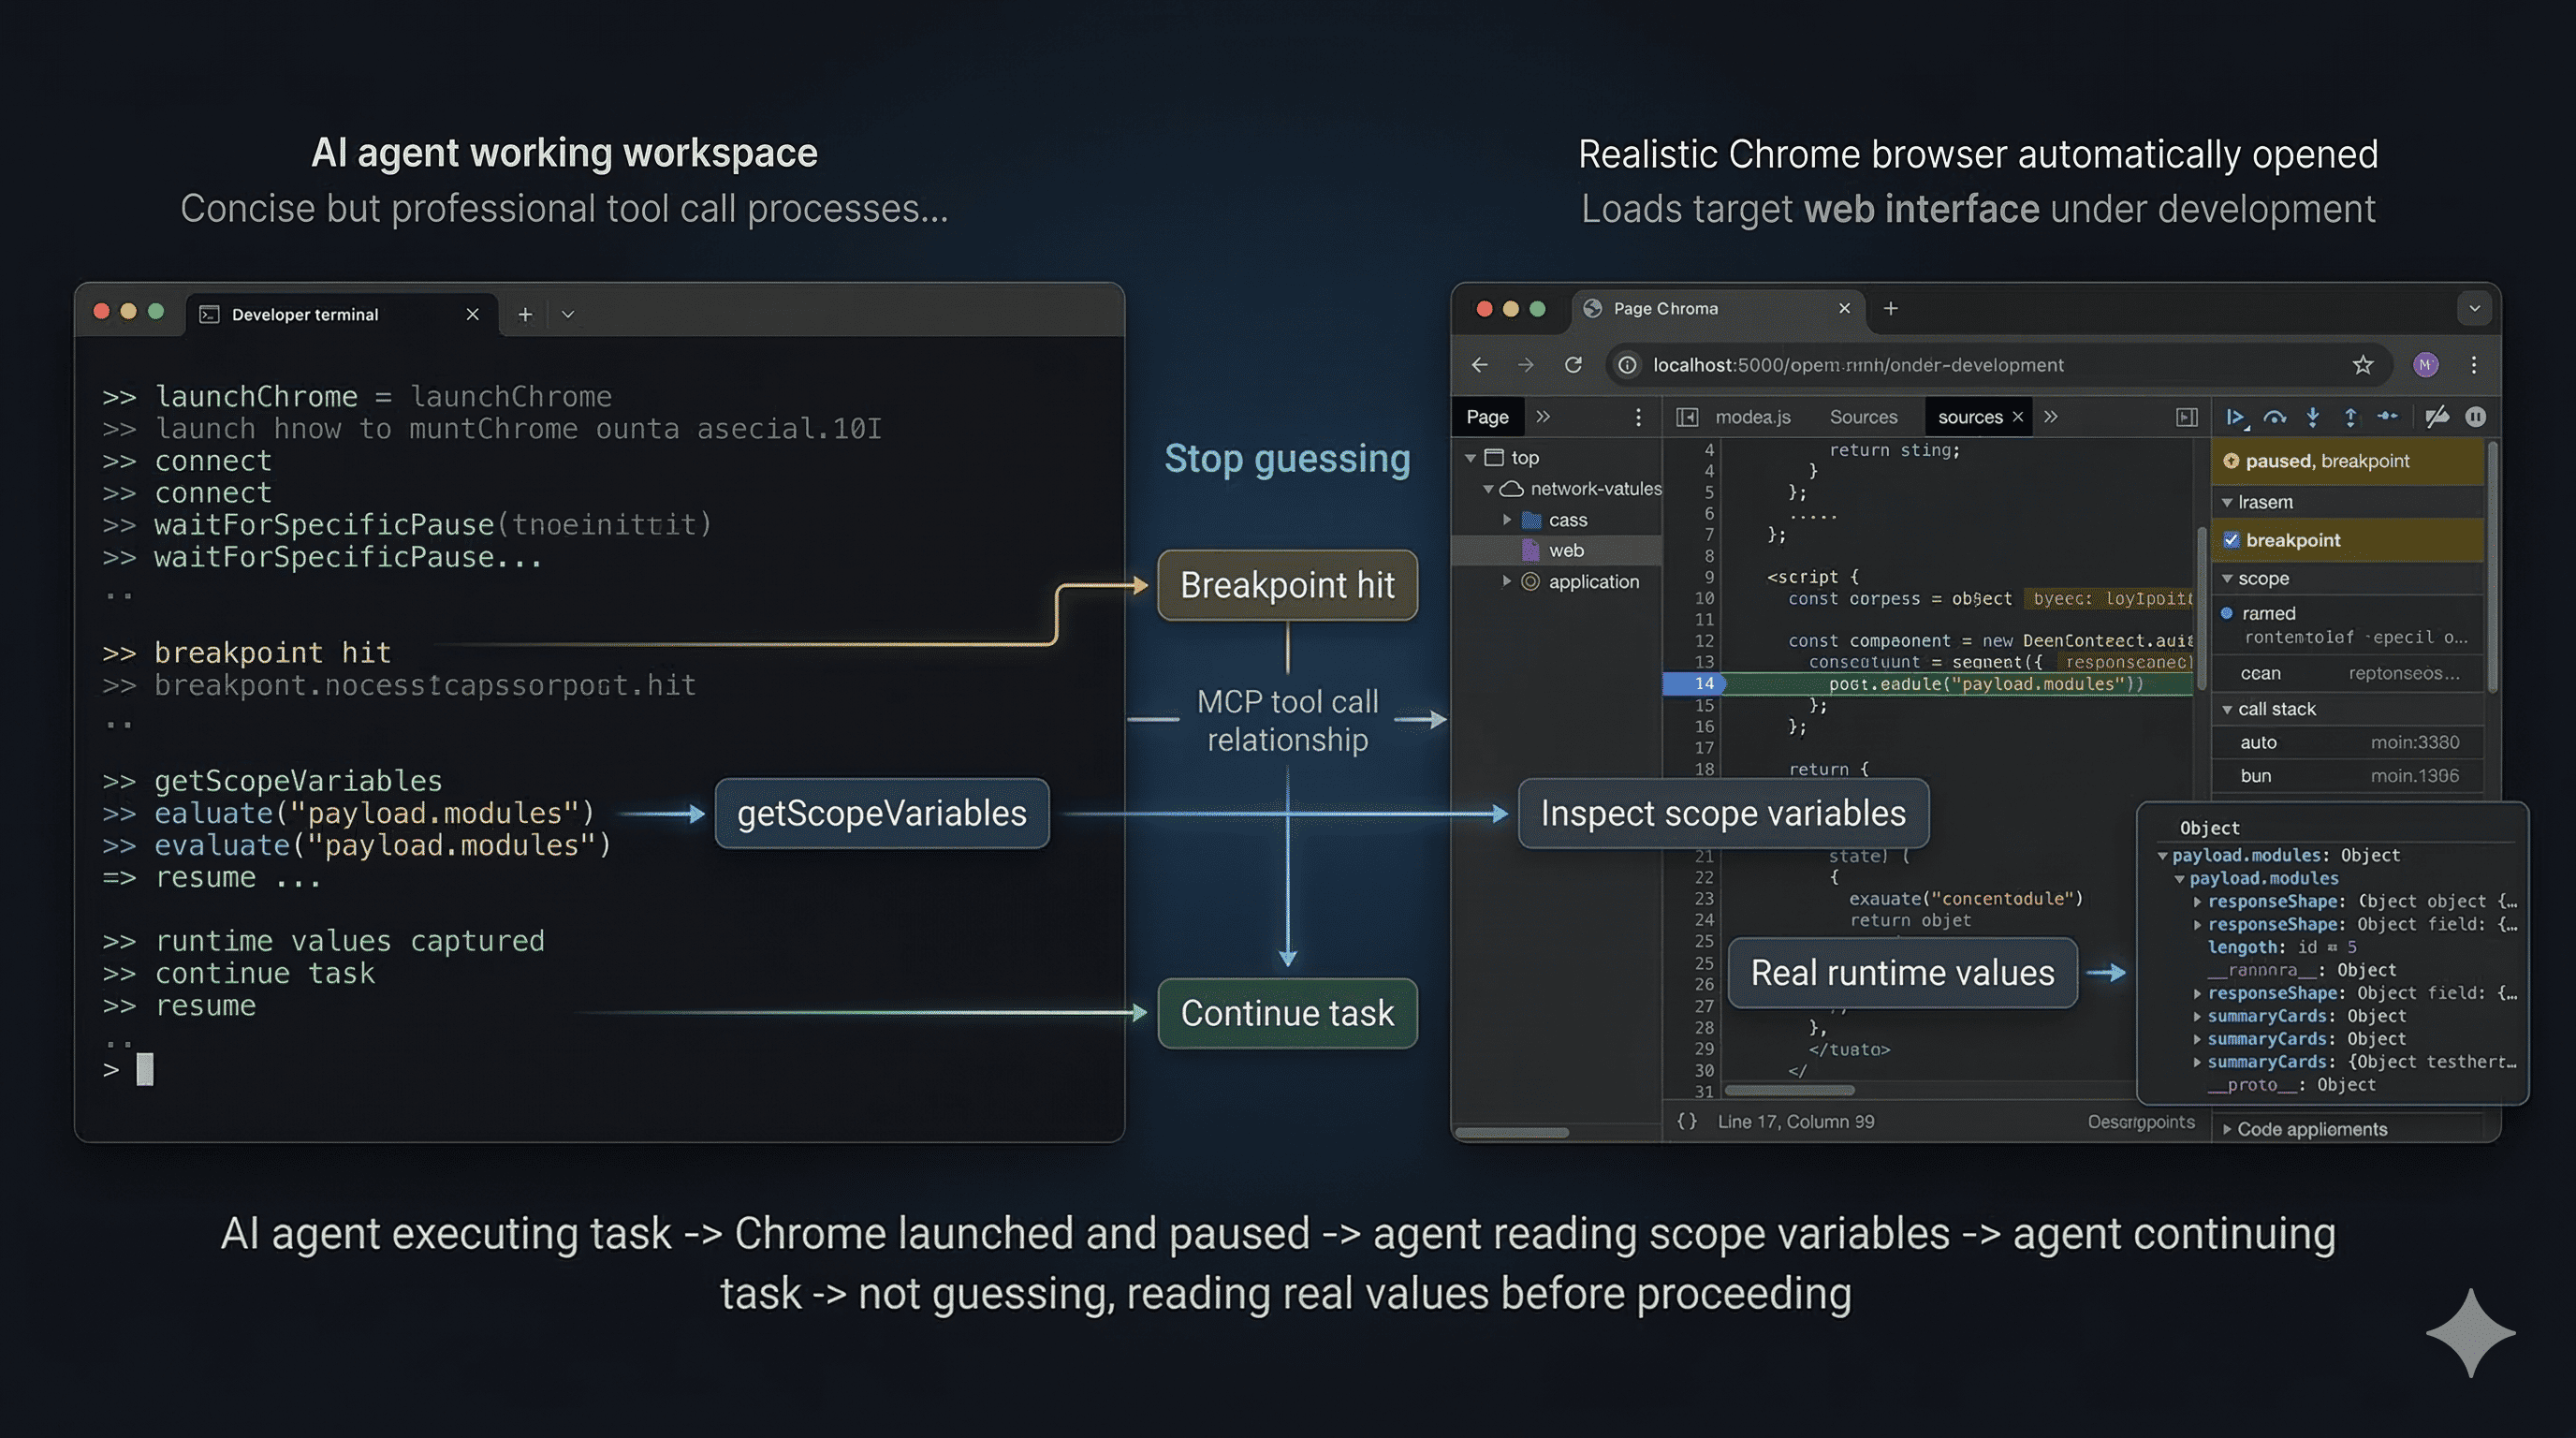
*Demo: the agent launches Chrome, waits for a breakpoint, inspects real scope variables, and resumes with runtime facts instead of guessing.*
|
|
46
28
|
|
|
47
|
-
|
|
29
|
+
### MCP Client Configuration
|
|
48
30
|
|
|
49
|
-
|
|
50
|
-
- concluding behavior without inspecting runtime values
|
|
51
|
-
- ending the turn between `reloadPage()` and `waitForSpecificPause()`
|
|
31
|
+
#### Use the published package
|
|
52
32
|
|
|
53
|
-
|
|
33
|
+
```json
|
|
34
|
+
{
|
|
35
|
+
"mcpServers": {
|
|
36
|
+
"chrome-debugger": {
|
|
37
|
+
"command": "npx",
|
|
38
|
+
"args": ["-y", "chrome-debugger-mcp"]
|
|
39
|
+
}
|
|
40
|
+
}
|
|
41
|
+
}
|
|
42
|
+
```
|
|
54
43
|
|
|
55
|
-
- Google Chrome installed locally
|
|
56
|
-
- An MCP client that supports stdio servers and tool calling
|
|
57
|
-
- Access to the application you want to debug
|
|
58
|
-
- Local source access if you plan to insert temporary `debugger;` statements
|
|
59
44
|
|
|
60
45
|
### Installation
|
|
61
46
|
|
|
62
47
|
#### From npm
|
|
63
48
|
|
|
64
|
-
After this package is published, users can run it directly with `npx`:
|
|
65
|
-
|
|
66
49
|
```bash
|
|
67
50
|
npx -y chrome-debugger-mcp
|
|
68
51
|
```
|
|
@@ -81,33 +64,30 @@ pnpm build
|
|
|
81
64
|
node dist/index.js
|
|
82
65
|
```
|
|
83
66
|
|
|
84
|
-
###
|
|
67
|
+
### Other Highlights
|
|
85
68
|
|
|
86
|
-
|
|
69
|
+
- Launch a dedicated Chrome instance with remote debugging enabled
|
|
70
|
+
- Set and remove DevTools breakpoints without editing source code
|
|
71
|
+
- Reload the page through CDP so breakpoints reliably bind after navigation
|
|
72
|
+
- Poll debugger state when the MCP client has short request timeouts
|
|
73
|
+
- Emit `_ui` payloads and logging messages that clients can surface to the user
|
|
87
74
|
|
|
88
|
-
|
|
89
|
-
{
|
|
90
|
-
"mcpServers": {
|
|
91
|
-
"chrome-debugger": {
|
|
92
|
-
"command": "npx",
|
|
93
|
-
"args": ["-y", "chrome-debugger-mcp"]
|
|
94
|
-
}
|
|
95
|
-
}
|
|
96
|
-
}
|
|
97
|
-
```
|
|
75
|
+
### Why It Helps
|
|
98
76
|
|
|
99
|
-
|
|
77
|
+
Many browser-focused MCP tools are strong at DOM interaction and network inspection, but weak at runtime debugging. This server gives an MCP client the missing loop you would normally use in Chrome DevTools: attach to the right tab, pause at the right time, inspect real values, step if needed, and resume cleanly.
|
|
100
78
|
|
|
101
|
-
|
|
102
|
-
|
|
103
|
-
|
|
104
|
-
|
|
105
|
-
|
|
106
|
-
|
|
107
|
-
|
|
108
|
-
|
|
109
|
-
|
|
110
|
-
|
|
79
|
+
It also adds guardrails that prevent common agent mistakes:
|
|
80
|
+
|
|
81
|
+
- guessing which tab to attach to
|
|
82
|
+
- concluding behavior without inspecting runtime values
|
|
83
|
+
- ending the turn between `reloadPage()` and `waitForSpecificPause()`
|
|
84
|
+
|
|
85
|
+
### Requirements
|
|
86
|
+
|
|
87
|
+
- Google Chrome installed locally
|
|
88
|
+
- An MCP client that supports stdio servers and tool calling
|
|
89
|
+
- Access to the application you want to debug
|
|
90
|
+
- Local source access if you plan to insert temporary `debugger;` statements
|
|
111
91
|
|
|
112
92
|
### Tooling Model
|
|
113
93
|
|
|
@@ -290,61 +270,44 @@ MIT
|
|
|
290
270
|
|
|
291
271
|
一个面向 Chrome 断点调试的 MCP Server。
|
|
292
272
|
|
|
293
|
-
`chrome-debugger-mcp` 把 Chrome DevTools Protocol 的核心调试能力暴露为 MCP 工具,让 AI agent 可以连接真实的 Chrome
|
|
294
|
-
|
|
295
|
-
这个服务适合处理这类问题:
|
|
296
|
-
|
|
297
|
-
- 这个变量在运行时到底是什么值?
|
|
298
|
-
- 为什么会走到这个分支?
|
|
299
|
-
- 浏览器里真实拿到的 API 返回结构是什么?
|
|
300
|
-
- 是哪一个函数改掉了这个状态?
|
|
301
|
-
- 为什么这个 UI 只有在某次点击或刷新后才出错?
|
|
273
|
+
`chrome-debugger-mcp` 把 Chrome DevTools Protocol 的核心调试能力暴露为 MCP 工具,让 AI agent 可以连接真实的 Chrome 标签页,在运行时暂停执行、读取作用域变量、在当前调用帧中执行表达式、单步跟踪代码,并基于真实值继续任务,而不是只靠静态源码猜测行为。
|
|
302
274
|
|
|
303
275
|
它不是通用浏览器自动化工具。它的重点是运行时调试。
|
|
304
276
|
|
|
305
|
-
###
|
|
277
|
+
### 核心能力
|
|
306
278
|
|
|
307
|
-
-
|
|
308
|
-
-
|
|
309
|
-
-
|
|
310
|
-
-
|
|
311
|
-
-
|
|
312
|
-
- 支持等待任意 pause,也支持等待指定文件和行附近的 pause
|
|
313
|
-
- 读取当前暂停帧里的作用域变量
|
|
314
|
-
- 在当前调用帧里执行任意 JavaScript 表达式
|
|
315
|
-
- 支持 `stepInto`、`stepOver`、`stepOut` 和 `resume`
|
|
316
|
-
- 当 MCP 客户端请求超时较短时,可轮询调试器状态
|
|
317
|
-
- 输出 `_ui` 结果和 logging 消息,方便客户端展示给用户
|
|
279
|
+
- 在用户明确确认后,通过 CDP 连接真实的 Chrome 标签页
|
|
280
|
+
- 在断点或 `debugger;` 命中时暂停,并等待指定文件和行附近的 pause
|
|
281
|
+
- 读取当前暂停帧中的 local、closure、module 作用域变量
|
|
282
|
+
- 在当前调用帧里执行 JavaScript,并继续单步跟踪
|
|
283
|
+
- 检查完成后恢复执行,让 agent 基于真实运行时值继续工作
|
|
318
284
|
|
|
319
|
-
###
|
|
285
|
+
### 功能演示
|
|
320
286
|
|
|
321
|
-
|
|
287
|
+

|
|
322
288
|
|
|
323
|
-
|
|
324
|
-
2. 在正确的时机暂停执行。
|
|
325
|
-
3. 读取真实运行时值。
|
|
326
|
-
4. 必要时单步跟踪。
|
|
327
|
-
5. 恢复执行并清理现场。
|
|
289
|
+
*演示流程:agent 拉起 Chrome,等待断点命中,读取真实作用域变量,再基于运行时事实继续执行,而不是靠猜测推进。*
|
|
328
290
|
|
|
329
|
-
|
|
291
|
+
### MCP 客户端配置
|
|
330
292
|
|
|
331
|
-
|
|
332
|
-
- 没看运行时值就直接下结论
|
|
333
|
-
- 在 `reloadPage()` 和 `waitForSpecificPause()` 之间错误地结束当前轮次
|
|
293
|
+
#### 使用已发布包
|
|
334
294
|
|
|
335
|
-
|
|
295
|
+
```json
|
|
296
|
+
{
|
|
297
|
+
"mcpServers": {
|
|
298
|
+
"chrome-debugger": {
|
|
299
|
+
"command": "npx",
|
|
300
|
+
"args": ["-y", "chrome-debugger-mcp"]
|
|
301
|
+
}
|
|
302
|
+
}
|
|
303
|
+
}
|
|
304
|
+
```
|
|
336
305
|
|
|
337
|
-
- 本机安装了 Google Chrome
|
|
338
|
-
- 使用支持 stdio MCP server 和工具调用的 MCP 客户端
|
|
339
|
-
- 可以访问你要调试的应用
|
|
340
|
-
- 如果要插入临时 `debugger;`,需要能访问本地源码
|
|
341
306
|
|
|
342
307
|
### 安装方式
|
|
343
308
|
|
|
344
309
|
#### 从 npm 使用
|
|
345
310
|
|
|
346
|
-
这个包发布后,用户可以直接用 `npx` 运行:
|
|
347
|
-
|
|
348
311
|
```bash
|
|
349
312
|
npx -y chrome-debugger-mcp
|
|
350
313
|
```
|
|
@@ -363,33 +326,30 @@ pnpm build
|
|
|
363
326
|
node dist/index.js
|
|
364
327
|
```
|
|
365
328
|
|
|
366
|
-
###
|
|
329
|
+
### 其他特点
|
|
367
330
|
|
|
368
|
-
|
|
331
|
+
- 启动带远程调试端口的独立 Chrome 实例
|
|
332
|
+
- 无需修改源码即可设置和移除断点
|
|
333
|
+
- 通过 CDP 重载页面,确保跳转后断点可靠绑定
|
|
334
|
+
- 当 MCP 客户端请求超时较短时,可轮询调试器状态
|
|
335
|
+
- 输出 `_ui` 结果和 logging 消息,方便客户端展示给用户
|
|
369
336
|
|
|
370
|
-
|
|
371
|
-
{
|
|
372
|
-
"mcpServers": {
|
|
373
|
-
"chrome-debugger": {
|
|
374
|
-
"command": "npx",
|
|
375
|
-
"args": ["-y", "chrome-debugger-mcp"]
|
|
376
|
-
}
|
|
377
|
-
}
|
|
378
|
-
}
|
|
379
|
-
```
|
|
337
|
+
### 为什么适合这个场景
|
|
380
338
|
|
|
381
|
-
|
|
339
|
+
很多浏览器方向的 MCP 工具更擅长 DOM 操作和网络请求观察,但不擅长回答运行时调试问题。这个服务补上的是 Chrome DevTools 里最关键的那条链路:连接正确标签页、在正确时机暂停、读取真实值、必要时单步跟踪、最后恢复执行。
|
|
382
340
|
|
|
383
|
-
|
|
384
|
-
|
|
385
|
-
|
|
386
|
-
|
|
387
|
-
|
|
388
|
-
|
|
389
|
-
|
|
390
|
-
|
|
391
|
-
|
|
392
|
-
|
|
341
|
+
它也内置了几条 guardrails,避免 agent 出现这些常见错误:
|
|
342
|
+
|
|
343
|
+
- 猜测应该连接哪个标签页
|
|
344
|
+
- 没看运行时值就直接下结论
|
|
345
|
+
- 在 `reloadPage()` 和 `waitForSpecificPause()` 之间错误地结束当前轮次
|
|
346
|
+
|
|
347
|
+
### 运行要求
|
|
348
|
+
|
|
349
|
+
- 本机安装了 Google Chrome
|
|
350
|
+
- 使用支持 stdio MCP server 和工具调用的 MCP 客户端
|
|
351
|
+
- 可以访问你要调试的应用
|
|
352
|
+
- 如果要插入临时 `debugger;`,需要能访问本地源码
|
|
393
353
|
|
|
394
354
|
### 工具模型
|
|
395
355
|
|
|
@@ -564,4 +524,4 @@ node dist/index.js
|
|
|
564
524
|
|
|
565
525
|
### 许可证
|
|
566
526
|
|
|
567
|
-
MIT
|
|
527
|
+
MIT
|
package/package.json
CHANGED