boardplot 0.53.0 → 0.55.0
This diff represents the content of publicly available package versions that have been released to one of the supported registries. The information contained in this diff is provided for informational purposes only and reflects changes between package versions as they appear in their respective public registries.
- package/CHANGELOG.md +475 -0
- package/README.md +15 -14
- package/dist/{ReaderBox-VOJSJ66R.js → ReaderBox-3FFPHWSI.js} +15 -10
- package/dist/{annotateEngine-DLMFJZ67.js → annotateEngine-ET4DM2OK.js} +5 -1
- package/dist/build-identity.json +3 -3
- package/dist/{chunk-SS42FJVN.js → chunk-2ALFFOKB.js} +460 -148
- package/dist/chunk-2BP6X5GX.js +125 -0
- package/dist/chunk-2C4SYWZ3.js +25 -0
- package/dist/{chunk-7X2ZYVAX.js → chunk-2TAK2ELB.js} +3 -3
- package/dist/{chunk-XZOHR765.js → chunk-2YNF6AHH.js} +5 -5
- package/dist/{chunk-DDI2W4TR.js → chunk-32IKJMUF.js} +3 -3
- package/dist/{chunk-ADKCLH3Z.js → chunk-33FCWTGT.js} +1 -1
- package/dist/{chunk-AQROQDLR.js → chunk-37A6CLR5.js} +1729 -196
- package/dist/{chunk-DCTCUZ5L.js → chunk-3AJY353W.js} +3 -3
- package/dist/chunk-3B3CFJ2H.js +48 -0
- package/dist/{chunk-M4EUXOLU.js → chunk-3B3K7TD5.js} +83 -9
- package/dist/{chunk-QSXK6PJL.js → chunk-3C24WWUQ.js} +1 -1
- package/dist/{chunk-BWTX7LUG.js → chunk-3L2VXXM4.js} +9 -4
- package/dist/{chunk-DO5OZJAO.js → chunk-3OZRODC4.js} +39 -21
- package/dist/{chunk-A6CQPJWR.js → chunk-3XOWXLLQ.js} +6 -7
- package/dist/{chunk-TBGUEF3M.js → chunk-3ZAH24P6.js} +164 -51
- package/dist/{chunk-TGK6KUGN.js → chunk-4CJ6UCX4.js} +33 -16
- package/dist/{chunk-VDAZPGR2.js → chunk-4DZFR52I.js} +2 -2
- package/dist/{chunk-323YZWYJ.js → chunk-4WT3T5SH.js} +124 -54
- package/dist/{chunk-O3S2KNIW.js → chunk-4X3HNETE.js} +3 -3
- package/dist/{chunk-FBB4BWKN.js → chunk-4Y7BA2NW.js} +4 -4
- package/dist/{chunk-AWTG3RFF.js → chunk-4YHZSPAJ.js} +6 -7
- package/dist/{chunk-CNX7EGSU.js → chunk-5DMHMQFP.js} +7 -7
- package/dist/{chunk-BPKXEMRE.js → chunk-5SHI57XD.js} +45 -14
- package/dist/{chunk-H63XQ3OO.js → chunk-5SLJGRUO.js} +139 -47
- package/dist/{chunk-5LYXD6ME.js → chunk-5UVJKB7L.js} +137 -70
- package/dist/{chunk-ZNHFLJSY.js → chunk-63L35UCI.js} +6 -6
- package/dist/{chunk-YCNLQYTC.js → chunk-6C64IBOG.js} +5 -5
- package/dist/{chunk-N3TPMXS3.js → chunk-6D4EO3S7.js} +5 -5
- package/dist/chunk-6H3OSHEY.js +25 -0
- package/dist/chunk-6WZZADRL.js +25 -0
- package/dist/{chunk-6RBTTCQD.js → chunk-75TWO5B2.js} +89 -57
- package/dist/chunk-7ADUVRG5.js +14 -0
- package/dist/{chunk-3QWZAEW5.js → chunk-7DAH2E4T.js} +4 -3
- package/dist/{chunk-VKQNDOAI.js → chunk-7FKY6YWU.js} +11 -7
- package/dist/{chunk-NSSNYY6Y.js → chunk-7GVYMGLK.js} +6 -3
- package/dist/{chunk-KZS46KDY.js → chunk-7Q2WV6D2.js} +3 -3
- package/dist/{chunk-JFBEAUJ6.js → chunk-7Q37C6GZ.js} +1 -1
- package/dist/{chunk-SPTPFY4S.js → chunk-7UPZPFHQ.js} +41 -34
- package/dist/{chunk-V6O6KVOA.js → chunk-7Z73MM35.js} +14 -6
- package/dist/{chunk-MJZHFH5R.js → chunk-AB35GVPG.js} +80 -31
- package/dist/{chunk-MYMT5KJL.js → chunk-AF7EB6N6.js} +151 -84
- package/dist/chunk-AIU4GZV5.js +24 -0
- package/dist/{chunk-KSJVENRU.js → chunk-AM2CG7VX.js} +13 -3
- package/dist/{chunk-XN4ARQ2W.js → chunk-APQPYM2Z.js} +3 -3
- package/dist/{chunk-AHQ4L3BE.js → chunk-AZM4YNRE.js} +2 -2
- package/dist/{chunk-XXOHXA3A.js → chunk-B3AXM3MT.js} +2 -2
- package/dist/{chunk-BWGRWGVA.js → chunk-BDGLMWPO.js} +14 -14
- package/dist/{chunk-EHBB2Z4D.js → chunk-BFFPYT3Y.js} +13 -7
- package/dist/{chunk-2QT5ZUHO.js → chunk-BGJRCG7N.js} +135 -114
- package/dist/{chunk-RNOJSEES.js → chunk-BK6P6KMW.js} +1 -1
- package/dist/{chunk-XB4KZ6WO.js → chunk-BSATR6ZO.js} +40 -13
- package/dist/{chunk-4UVW5WU6.js → chunk-BVYIKLQ5.js} +1 -1
- package/dist/chunk-BWVNCLUS.js +19 -0
- package/dist/{chunk-LCWJS34U.js → chunk-CKNOLGRR.js} +1 -1
- package/dist/chunk-CLGUFVHM.js +24 -0
- package/dist/{chunk-NY5NUFDZ.js → chunk-COQEHO7B.js} +3 -3
- package/dist/{chunk-3EZRM4YM.js → chunk-CPGASWNN.js} +25 -1
- package/dist/{chunk-GTG3IGLF.js → chunk-CVIW2MV4.js} +284 -150
- package/dist/chunk-CYKIX3IQ.js +24 -0
- package/dist/{chunk-DIHUGBZO.js → chunk-CZ3WCG55.js} +5 -4
- package/dist/{chunk-DRTA6JG5.js → chunk-D2B3KP35.js} +26 -15
- package/dist/{chunk-6OCR6ITN.js → chunk-D2QMNHCC.js} +4 -5
- package/dist/{chunk-EUADDXAV.js → chunk-D7G27EYZ.js} +4 -4
- package/dist/{chunk-NOSDEJ3K.js → chunk-DB2JKPOX.js} +806 -69
- package/dist/{chunk-2CVH5E57.js → chunk-DEYAI662.js} +60 -13
- package/dist/{chunk-HA4IPWMM.js → chunk-DRHQG44U.js} +23 -5
- package/dist/{chunk-WZGJSQKN.js → chunk-DZ3S4RPI.js} +15 -1
- package/dist/{chunk-B6GFKYBZ.js → chunk-E44W4EEG.js} +8 -5
- package/dist/{chunk-YCRGWQBS.js → chunk-E5OEWMNX.js} +66 -12
- package/dist/chunk-E6HDUEGK.js +26 -0
- package/dist/{chunk-A7IEVBYI.js → chunk-E76U5H52.js} +1 -5
- package/dist/{chunk-NKIYLFXZ.js → chunk-EAR43REB.js} +213 -73
- package/dist/{chunk-NQDVMUHX.js → chunk-EBC5TMI2.js} +29 -8
- package/dist/chunk-EBVJCVXL.js +25 -0
- package/dist/chunk-EC2PGJ64.js +24 -0
- package/dist/chunk-EGPXEY2K.js +24 -0
- package/dist/{chunk-CUVUDK4O.js → chunk-EQRFSVDD.js} +2 -1
- package/dist/{chunk-CYOJZ3GQ.js → chunk-EW47LNWH.js} +228 -58
- package/dist/{chunk-7EVIIADO.js → chunk-EXDMYV5W.js} +3 -1
- package/dist/{chunk-VJ3FCGQF.js → chunk-EZZ533MH.js} +1 -1
- package/dist/{chunk-IBXXZVG7.js → chunk-F5V7YFKS.js} +11 -8
- package/dist/{chunk-COYOTQC2.js → chunk-F6CVYNDY.js} +5 -4
- package/dist/{chunk-66RFKRGO.js → chunk-F6OLHND5.js} +2 -2
- package/dist/chunk-FI5EXISD.js +27 -0
- package/dist/{chunk-CAQ5P4VN.js → chunk-FQF7GSJK.js} +46 -27
- package/dist/{chunk-XJP5DKIL.js → chunk-FS6ZE5TG.js} +2 -2
- package/dist/{chunk-7CTKTIPF.js → chunk-G63WXSQP.js} +75 -34
- package/dist/{chunk-3A2IEBCN.js → chunk-GCSCHK5Y.js} +4 -18
- package/dist/{chunk-REOPXBUR.js → chunk-GD5TYS5R.js} +32 -21
- package/dist/{chunk-RGZGLKFB.js → chunk-GDVR3XHT.js} +418 -62
- package/dist/{chunk-XQCQZBGX.js → chunk-GDZI5ZJ7.js} +1 -1
- package/dist/{chunk-P5RNWMZC.js → chunk-GFIT3FRE.js} +277 -291
- package/dist/chunk-GM2HIU6C.js +24 -0
- package/dist/{chunk-DOFYKPTC.js → chunk-GMJFCBR6.js} +1 -1
- package/dist/{chunk-CRNMNZJD.js → chunk-H3AEYPRP.js} +66 -43
- package/dist/{chunk-BUPLB3EX.js → chunk-H3IBJQ5A.js} +6 -2
- package/dist/chunk-H4VDQ7OE.js +24 -0
- package/dist/{chunk-J6I2YFJH.js → chunk-H5L2P2GO.js} +6 -4
- package/dist/{chunk-X4YNDLVA.js → chunk-HFRQLMKK.js} +12 -7
- package/dist/{chunk-YG5GUELW.js → chunk-HGT3UKDW.js} +91 -48
- package/dist/{chunk-CWDHCSL2.js → chunk-HJRNBKIT.js} +801 -76
- package/dist/{chunk-FV3VF36K.js → chunk-HLOXWM2O.js} +119 -63
- package/dist/{chunk-3SQCCESO.js → chunk-HR2BKLS3.js} +113 -128
- package/dist/{chunk-S4QSJAGY.js → chunk-HZUAEMN5.js} +1 -1
- package/dist/{chunk-QWXWVPNE.js → chunk-IF2ZABAM.js} +2 -2
- package/dist/chunk-IF76JRXT.js +24 -0
- package/dist/chunk-IGNBQT23.js +248 -0
- package/dist/{chunk-DCCJRLAJ.js → chunk-IGVAWAOK.js} +31 -96
- package/dist/{chunk-DDCB7ZA5.js → chunk-ILFQ75N4.js} +253 -141
- package/dist/chunk-INHDHZNP.js +8 -0
- package/dist/chunk-IOKWBUQP.js +25 -0
- package/dist/{chunk-33PB4V6K.js → chunk-IQDMZ33D.js} +20 -9
- package/dist/{chunk-IDDA5INB.js → chunk-IVRYF7QA.js} +7 -4
- package/dist/{chunk-L7RHB734.js → chunk-J5PL6JLL.js} +1 -1
- package/dist/chunk-JBMWRXDS.js +24 -0
- package/dist/{chunk-RPIW5T55.js → chunk-JKOEHRGV.js} +1 -1
- package/dist/chunk-JMGB444D.js +26 -0
- package/dist/chunk-JU7S52HI.js +26 -0
- package/dist/{chunk-BBL3R5YZ.js → chunk-JXBZIJCG.js} +1 -1
- package/dist/{chunk-WLZ54FWG.js → chunk-JYAZPMSA.js} +70 -1
- package/dist/chunk-K5S3K6QK.js +24 -0
- package/dist/{chunk-5LGSRWFC.js → chunk-KAYBRD4F.js} +3 -3
- package/dist/{chunk-N3G2FYDL.js → chunk-KC52E5G4.js} +31 -20
- package/dist/{chunk-LNKY5Z2X.js → chunk-KDSYZLF6.js} +2 -3
- package/dist/{chunk-B67K6OWJ.js → chunk-KEDNHCGB.js} +4 -4
- package/dist/chunk-KFGZMHIB.js +28 -0
- package/dist/{chunk-KPKXJYQH.js → chunk-KHRAJDBM.js} +1 -1
- package/dist/{chunk-2V6CLH33.js → chunk-KND4OM4B.js} +117 -102
- package/dist/{chunk-X6SUFTD7.js → chunk-KZH2QI6S.js} +2 -2
- package/dist/{chunk-IYEFEBRN.js → chunk-KZJ5VM6E.js} +14 -3
- package/dist/{chunk-JSEYUJUQ.js → chunk-LA5OYJ5P.js} +146 -69
- package/dist/{chunk-MVV6RQMG.js → chunk-LAVVML3X.js} +33 -9
- package/dist/{chunk-4G2O2ZPJ.js → chunk-LD4LML5P.js} +10 -8
- package/dist/{chunk-OURX73UJ.js → chunk-LF6RTFNK.js} +13 -11
- package/dist/{chunk-SVZDXFPX.js → chunk-LFUJTEJO.js} +100 -36
- package/dist/{chunk-53OYF4ZT.js → chunk-LHKDZAWN.js} +16 -8
- package/dist/{chunk-GCBOHVDZ.js → chunk-LLDKKEUD.js} +1 -1
- package/dist/{chunk-VTEV3WVF.js → chunk-LRCO4G7C.js} +314 -92
- package/dist/{chunk-5HECRVXJ.js → chunk-LSF76AS3.js} +7 -3
- package/dist/chunk-M427S3G7.js +25 -0
- package/dist/{chunk-ZMF7WEGG.js → chunk-MEMPP7VZ.js} +3 -3
- package/dist/{chunk-D7SHZDA3.js → chunk-MJMOKPTF.js} +186 -167
- package/dist/chunk-MLGEBFEX.js +47 -0
- package/dist/chunk-MLW72KWN.js +24 -0
- package/dist/chunk-MQYIBGZE.js +19 -0
- package/dist/{chunk-SDSONLMZ.js → chunk-MTRV3BJL.js} +301 -130
- package/dist/{chunk-H4H4O62O.js → chunk-N5HN5QGH.js} +1 -1
- package/dist/chunk-N5TZL74Y.js +53 -0
- package/dist/chunk-N7N5NIAU.js +211 -0
- package/dist/{chunk-XN7MQO45.js → chunk-NA6WLZ66.js} +66 -26
- package/dist/{chunk-B54RN2FD.js → chunk-NB7M4KX4.js} +99 -56
- package/dist/{chunk-ADWSGPH5.js → chunk-NCZWLV7T.js} +4 -4
- package/dist/{chunk-C54QLNE4.js → chunk-NGA7ICG4.js} +1 -1
- package/dist/{chunk-TJSND556.js → chunk-NHYKSPL4.js} +155 -100
- package/dist/chunk-NMTWUYUF.js +30 -0
- package/dist/{chunk-Q3CV2JJ2.js → chunk-NOCIN2EM.js} +425 -251
- package/dist/{chunk-SKRSCTT5.js → chunk-NUCYUKVH.js} +3 -3
- package/dist/{chunk-S32YYDIB.js → chunk-NVGAEQ6M.js} +4 -3
- package/dist/{chunk-N23YFPPI.js → chunk-O2KKQNGW.js} +4 -1
- package/dist/chunk-O36WX56O.js +13 -0
- package/dist/{chunk-FF23FYQD.js → chunk-O4WJWHCH.js} +187 -85
- package/dist/{chunk-H67RTX46.js → chunk-O6NJDRXE.js} +2 -2
- package/dist/{chunk-2DOR5SS6.js → chunk-O7DVW3IE.js} +141 -68
- package/dist/{chunk-2VWJ5BGO.js → chunk-O7W35PT3.js} +13 -12
- package/dist/{chunk-MF6IVSBJ.js → chunk-ODZJ4LW7.js} +6 -3
- package/dist/{chunk-FG6EDGMI.js → chunk-OHGEDG46.js} +1 -1
- package/dist/{chunk-HZI56ASJ.js → chunk-OJ2BPQGQ.js} +11 -5
- package/dist/chunk-ONKSGT2M.js +28 -0
- package/dist/{chunk-2WNYRWHG.js → chunk-OOFSQ5AS.js} +1 -1
- package/dist/{chunk-IYMI7YI4.js → chunk-OY2UJ4XK.js} +64 -42
- package/dist/{chunk-6Y7EXYLR.js → chunk-P6TA7M3G.js} +102 -32
- package/dist/{chunk-MQFCG4KS.js → chunk-PQYJZMCR.js} +99 -92
- package/dist/{chunk-BWLOXQDV.js → chunk-PYV6ZIR6.js} +41 -14
- package/dist/chunk-PZ46S2SY.js +69 -0
- package/dist/{chunk-IL5T7I2A.js → chunk-Q3E74U2W.js} +4 -4
- package/dist/{chunk-TXS3U77A.js → chunk-QBJDHFJJ.js} +4 -2
- package/dist/chunk-QBRRJ5OR.js +24 -0
- package/dist/{chunk-P6KZIZDV.js → chunk-QEP3X3OV.js} +141 -79
- package/dist/{chunk-CCCEBIUZ.js → chunk-QKWBDH2L.js} +2 -2
- package/dist/{chunk-QY5ZKUWY.js → chunk-QOWE55RR.js} +9 -3
- package/dist/{chunk-SREWFAAJ.js → chunk-QRVIS2QB.js} +6 -5
- package/dist/chunk-R27IDIJI.js +24 -0
- package/dist/{chunk-G5FMTRG5.js → chunk-RNIYG6PI.js} +2 -2
- package/dist/{chunk-PEUSKIFV.js → chunk-RO2PSSAI.js} +13 -23
- package/dist/{chunk-ZQF34VPS.js → chunk-ROLR7HRB.js} +12 -6
- package/dist/{chunk-YF2PYLC4.js → chunk-RSCRIWAH.js} +1 -1
- package/dist/{chunk-L6DJ4ZY5.js → chunk-RTXRIZYU.js} +370 -134
- package/dist/{chunk-VK5ZDV67.js → chunk-RUWNG2JC.js} +6 -5
- package/dist/chunk-RYPJB3RO.js +132 -0
- package/dist/{chunk-DAVHGK27.js → chunk-S7NRL66K.js} +46 -23
- package/dist/{chunk-VABRPZVC.js → chunk-SA46CNMS.js} +5 -1
- package/dist/{chunk-3H2W76TB.js → chunk-SBR2RLEQ.js} +72 -38
- package/dist/chunk-SC42DPNV.js +24 -0
- package/dist/{chunk-27QADBDV.js → chunk-SFG7NG23.js} +20 -3
- package/dist/{chunk-AG2CJ4JY.js → chunk-SNQ7D5R7.js} +18 -1
- package/dist/{chunk-QTZVVZ2A.js → chunk-SPSGUFTI.js} +11 -3
- package/dist/chunk-SRUV7AT6.js +51 -0
- package/dist/{chunk-F6CNPC4L.js → chunk-SZXKV3BX.js} +1 -1
- package/dist/{chunk-UB6ODJHO.js → chunk-T5Y4HXYO.js} +7 -4
- package/dist/{chunk-EJPVVGD7.js → chunk-U7W7GYXP.js} +37 -37
- package/dist/{chunk-LFX7W4B7.js → chunk-UDKYY27B.js} +1 -1
- package/dist/{chunk-24BHMKDD.js → chunk-UF3HSFAE.js} +25 -2
- package/dist/chunk-UIYXMPDW.js +24 -0
- package/dist/{chunk-N7J7CZS6.js → chunk-UNMIUILK.js} +1 -1
- package/dist/chunk-V3MSLNSD.js +24 -0
- package/dist/chunk-V634AXDM.js +31 -0
- package/dist/{chunk-57ZGVAU3.js → chunk-V7F4F6JA.js} +39 -6
- package/dist/{chunk-4X66BTP5.js → chunk-VBVG6NEL.js} +6 -6
- package/dist/chunk-VL7WLE4H.js +24 -0
- package/dist/chunk-W45AR6EW.js +94 -0
- package/dist/{chunk-RL3NUWMY.js → chunk-WALYNKBN.js} +444 -101
- package/dist/{chunk-DYS7EIXY.js → chunk-WAPCCJUB.js} +70 -26
- package/dist/{chunk-FBAYZSFC.js → chunk-WDIVAU5U.js} +241 -118
- package/dist/{chunk-EHVESNLV.js → chunk-WEMUCDPK.js} +1 -1
- package/dist/{chunk-N73IBH55.js → chunk-WFSOKGGA.js} +2 -2
- package/dist/{chunk-WI5ITCOH.js → chunk-WG5CJGLU.js} +2 -2
- package/dist/{chunk-S6UX7KB6.js → chunk-WQT6HIIY.js} +18 -17
- package/dist/{chunk-MZL6LGKO.js → chunk-WSJDLZSZ.js} +78 -47
- package/dist/{chunk-XJI6SWFS.js → chunk-WWIY6BBY.js} +77 -38
- package/dist/{chunk-33PLBIMA.js → chunk-WXJ5MHLH.js} +3 -2
- package/dist/chunk-X3YP4DUV.js +76 -0
- package/dist/{chunk-MBKZYJRC.js → chunk-X7XTIM6U.js} +50 -36
- package/dist/chunk-XJQXFVXY.js +24 -0
- package/dist/{chunk-KZJOV4QW.js → chunk-XMN3Z43K.js} +5 -5
- package/dist/{chunk-2ND7ZITT.js → chunk-XPOMQWXY.js} +90 -70
- package/dist/chunk-XVUQMZWV.js +24 -0
- package/dist/chunk-XYYRHGQI.js +24 -0
- package/dist/{chunk-NHQGRKEA.js → chunk-XZLU3G23.js} +7 -7
- package/dist/chunk-Y2CAIAUI.js +24 -0
- package/dist/{chunk-QO6HEXIZ.js → chunk-Y3L655X6.js} +6 -6
- package/dist/{chunk-QKL7IY42.js → chunk-Y54LU4CU.js} +1 -1
- package/dist/chunk-YGTNVZJE.js +89 -0
- package/dist/{chunk-LIWLBLCT.js → chunk-YLC42C3M.js} +1 -1
- package/dist/{chunk-SGD3ZHID.js → chunk-YOOHNQ3L.js} +15 -4
- package/dist/{chunk-DRW6KGBK.js → chunk-YTCIGJUU.js} +116 -42
- package/dist/{chunk-ULTSSIOU.js → chunk-YV5KYGE5.js} +1 -1
- package/dist/{chunk-4RRNJLCM.js → chunk-YXM4W3TN.js} +146 -67
- package/dist/{chunk-2L2Q53EP.js → chunk-Z2X4JQNY.js} +81 -21
- package/dist/{chunk-LS7HVBI7.js → chunk-Z5V6ZM76.js} +3 -3
- package/dist/{chunk-DU4A5AOY.js → chunk-Z7NHFNH3.js} +165 -79
- package/dist/{chunk-HOAH5XBR.js → chunk-ZBSNF5F7.js} +208 -62
- package/dist/chunk-ZGHBDMYF.js +24 -0
- package/dist/{chunk-TM4OC53S.js → chunk-ZHFUMVW7.js} +2 -1
- package/dist/{chunk-TWOREVKJ.js → chunk-ZLYQWUNR.js} +84 -50
- package/dist/chunk-ZTMZOKVC.js +61 -0
- package/dist/cli/index.js +3 -3
- package/dist/{core-LA6XDYG7.js → core-2SICIP63.js} +6 -1
- package/dist/{core-5HQBPCHL.js → core-2YTKFBNZ.js} +6 -1
- package/dist/{core-FVR3WZEC.js → core-3647Z25D.js} +5 -1
- package/dist/{core-GES44OTS.js → core-3IJPBNGC.js} +3 -1
- package/dist/{core-KKQS3WI2.js → core-6HMJHFRR.js} +9 -1
- package/dist/{core-QY7AVIKZ.js → core-7JKE7H32.js} +6 -1
- package/dist/{core-WUQVFARS.js → core-BMY7OL76.js} +6 -1
- package/dist/{core-4BZQQSHS.js → core-CAL7YNFC.js} +4 -1
- package/dist/{core-NP4VHWXL.js → core-CBEGB2NO.js} +4 -1
- package/dist/{core-C6YUSTZI.js → core-CLLIG7ZU.js} +3 -1
- package/dist/{core-MJ7JWQT5.js → core-CTZLHGXE.js} +2 -1
- package/dist/{core-UHECQHJ2.js → core-EYJ3WJK4.js} +4 -1
- package/dist/{core-ETAGQBZO.js → core-FX7HRKTF.js} +3 -1
- package/dist/{core-Z2F3IGSR.js → core-GQC6VDW5.js} +4 -1
- package/dist/{core-IKD3EE3S.js → core-GRWI22NS.js} +4 -1
- package/dist/{core-OJUQLIQ5.js → core-H7KMWYP5.js} +5 -1
- package/dist/{core-WGM4XUN3.js → core-HJUGHAX7.js} +3 -1
- package/dist/{core-V5FV4NWL.js → core-JMYMIH6Z.js} +9 -1
- package/dist/{core-GGQREDSI.js → core-KEB5PBCO.js} +6 -1
- package/dist/{core-6RYHWUJO.js → core-MEC6A5DD.js} +5 -1
- package/dist/{core-GCTFVYMH.js → core-MV6KGAUV.js} +4 -1
- package/dist/{core-MR52YBRX.js → core-NTWHFDM4.js} +3 -1
- package/dist/{core-SBQMHWTA.js → core-OIC5KJSD.js} +7 -1
- package/dist/{core-Q6VLFFYC.js → core-OWCTIPHD.js} +6 -1
- package/dist/{core-NSIJEKLI.js → core-PMYCLXT7.js} +6 -1
- package/dist/{core-EEB7HTCL.js → core-PTRQPQTO.js} +4 -1
- package/dist/{core-3VCCUFVX.js → core-QABTVASG.js} +3 -1
- package/dist/{core-AJTVU6X7.js → core-RPQBIOU4.js} +5 -1
- package/dist/{core-4VT4MHNB.js → core-SKRADU7T.js} +4 -1
- package/dist/{core-EFMVDWNH.js → core-T2KHX5LG.js} +4 -1
- package/dist/{core-PB3VUQSS.js → core-T4ZH3FAU.js} +3 -1
- package/dist/{core-JM4R426L.js → core-UAY2G7LN.js} +2 -1
- package/dist/{core-NQLNZDX5.js → core-ULZ7XUQP.js} +5 -1
- package/dist/{core-MLROKJ2M.js → core-VBR253SM.js} +4 -1
- package/dist/{core-7BZJCIXN.js → core-VMIBBHXI.js} +4 -1
- package/dist/{core-5535KXRD.js → core-XMTKUXLO.js} +4 -1
- package/dist/{core-HRYOV6QD.js → core-YEFGEW3Z.js} +4 -1
- package/dist/{dataTable-3CPPIHB3.js → dataTable-2ZXK54TP.js} +4 -2
- package/dist/{engine-FXFBCWHB.js → engine-HGXSWGOI.js} +27 -27
- package/dist/fixtures.js +7 -1
- package/dist/{fontTables-WYCZNRE7.js → fontTables-ZPZQ6IR3.js} +1 -1
- package/dist/fonts.js +2 -1
- package/dist/geo/dach.js +3 -1
- package/dist/geo/de-states.js +3 -1
- package/dist/geo/eu27.js +3 -1
- package/dist/geo/europe.js +3 -1
- package/dist/geo/index.js +4 -2
- package/dist/geo/us-states.js +3 -1
- package/dist/geo/world.js +3 -1
- package/dist/index.js +31 -26
- package/dist/{main-YLKBTHJP.js → main-PVT6FMGC.js} +55 -24
- package/dist/mcp/server.js +51 -23
- package/dist/{module-SVEW5ZUE.js → module-ZSR7KTAS.js} +1 -1
- package/dist/react/bar.js +7 -1
- package/dist/react/bartable.js +7 -1
- package/dist/react/box.js +7 -1
- package/dist/react/bullet.js +5 -1
- package/dist/react/butterfly.js +6 -1
- package/dist/react/choropleth.js +5 -1
- package/dist/react/cohort.js +5 -1
- package/dist/react/column.js +10 -1
- package/dist/react/combo.js +4 -1
- package/dist/react/creative.js +3 -1
- package/dist/react/diagram.js +4 -1
- package/dist/react/dimswitch.js +5 -1
- package/dist/react/dot.js +10 -1
- package/dist/react/export.js +34 -31
- package/dist/react/funnel.js +5 -1
- package/dist/react/gantt.js +4 -1
- package/dist/react/grid.js +5 -1
- package/dist/react/heatmap.js +5 -1
- package/dist/react/histogram.js +7 -1
- package/dist/react/index.js +95 -90
- package/dist/react/kpi.js +3 -1
- package/dist/react/likert.js +8 -1
- package/dist/react/line.js +5 -1
- package/dist/react/mekko.js +6 -1
- package/dist/react/pareto.js +4 -1
- package/dist/react/pie.js +6 -1
- package/dist/react/prepare.js +34 -28
- package/dist/react/pvm.js +5 -1
- package/dist/react/pyramid.js +6 -1
- package/dist/react/sankey.js +5 -1
- package/dist/react/scatter.js +5 -1
- package/dist/react/slope.js +7 -1
- package/dist/react/sparkline.js +5 -1
- package/dist/react/spec.js +25 -31
- package/dist/react/status.js +4 -1
- package/dist/react/story.js +7 -4
- package/dist/react/table.js +5 -1
- package/dist/react/theme.js +7 -3
- package/dist/react/tilemap.js +5 -1
- package/dist/react/treemap.js +4 -1
- package/dist/react/variance.js +6 -1
- package/dist/react/waffle.js +4 -1
- package/dist/react/waterfall.js +5 -1
- package/dist/{resvg-ZOVDIZTV.js → resvg-VB7S5HRF.js} +1 -1
- package/dist/rows.js +2 -3
- package/dist/{rowsModule-YVLAROIP.js → rowsModule-JTDPTWXG.js} +3 -1
- package/dist/{schema-BNRNHGHQ.js → schema-2M3LXR35.js} +3 -1
- package/dist/{schema-5HA5DSYN.js → schema-2Q7IJ22V.js} +3 -1
- package/dist/{schema-FA6XIHTW.js → schema-3OLBUVMZ.js} +3 -1
- package/dist/{schema-F3WYTR65.js → schema-3XLO43SX.js} +3 -1
- package/dist/{schema-RTWES6NR.js → schema-5753NOAL.js} +3 -1
- package/dist/{schema-S3TCLTYD.js → schema-5KHDHTIX.js} +3 -1
- package/dist/{schema-WOSEZNKG.js → schema-76XRTBCJ.js} +3 -1
- package/dist/{schema-MPXZNWV3.js → schema-7CPGNCOL.js} +3 -1
- package/dist/{schema-2KIHLTYI.js → schema-BKHQ3ZUH.js} +3 -1
- package/dist/{schema-JB2H6KPA.js → schema-BMD5JR3Y.js} +3 -1
- package/dist/{schema-5BKQV56C.js → schema-BOGTPL7F.js} +3 -1
- package/dist/{schema-ORTRMYI6.js → schema-BUTNGYTT.js} +3 -1
- package/dist/{schema-SWWMOLOR.js → schema-C7NVOQNV.js} +6 -3
- package/dist/{schema-O4YNAGIY.js → schema-FNTAAXQ3.js} +3 -1
- package/dist/{schema-7TLSFG6M.js → schema-FYULDJFB.js} +3 -1
- package/dist/{schema-NHNQK6XO.js → schema-FZKNIAIH.js} +3 -1
- package/dist/{schema-B7CZPPB4.js → schema-G2PLJCYL.js} +3 -1
- package/dist/{schema-ZUUUY3QS.js → schema-GGG2VOY7.js} +3 -2
- package/dist/{schema-6RYJS2GM.js → schema-GLN7IHSH.js} +3 -1
- package/dist/{schema-OJCML6LV.js → schema-HIDW4BA4.js} +3 -1
- package/dist/{schema-S36SRYGO.js → schema-J53LCIY3.js} +3 -1
- package/dist/{schema-2K6C3U24.js → schema-KIJA53MB.js} +4 -1
- package/dist/{schema-O7AKK232.js → schema-LEQNLBNG.js} +2 -1
- package/dist/{schema-AMFRKUFS.js → schema-LHMEXFLY.js} +3 -1
- package/dist/{schema-65FOKNHK.js → schema-MT6NA5AL.js} +3 -3
- package/dist/{schema-4S5CXHAO.js → schema-MUTAVQMI.js} +3 -1
- package/dist/{schema-Y6KBWUUR.js → schema-NVMEOHAW.js} +3 -1
- package/dist/{schema-6OHZWHUI.js → schema-TA3MSAPQ.js} +3 -1
- package/dist/{schema-YQYTLKSW.js → schema-U26KG42U.js} +3 -1
- package/dist/{schema-E4MRCGPZ.js → schema-UHHFTVGS.js} +3 -1
- package/dist/{schema-4HY2MWZC.js → schema-V3BPW4LA.js} +3 -1
- package/dist/{schema-PJ6P52BC.js → schema-WIZ2TZAT.js} +3 -1
- package/dist/{schema-NN6UPDPW.js → schema-WZLWHOMY.js} +3 -1
- package/dist/{schema-6W4M3WJ4.js → schema-XATDKZPW.js} +3 -1
- package/dist/{schema-5NKJPSBD.js → schema-XHKSGMUH.js} +3 -1
- package/dist/{schema-GZNOW4LX.js → schema-XKY2EQFH.js} +3 -1
- package/dist/{schema-HEIDGCSL.js → schema-ZE7WUNFS.js} +3 -1
- package/dist/{specValidation-VNWIKLHH.js → specValidation-X5XJBPTP.js} +4 -1
- package/dist/theme.js +5 -2
- package/dist/{themeShapeRules-2D3KWSPQ.js → themeShapeRules-PW4BQHKL.js} +1 -1
- package/dist/types/core/a11y/recordsShared.d.ts +4 -0
- package/dist/types/core/annotate.d.ts +39 -0
- package/dist/types/core/annotateArms.d.ts +1 -1
- package/dist/types/core/annotateEngine.d.ts +14 -0
- package/dist/types/core/axis.d.ts +2 -0
- package/dist/types/core/calendarLabels.d.ts +15 -0
- package/dist/types/core/charts/band/stacks.d.ts +71 -2
- package/dist/types/core/charts/bartable/types.d.ts +10 -0
- package/dist/types/core/charts/choropleth/index.d.ts +7 -0
- package/dist/types/core/charts/choropleth/layout.d.ts +7 -0
- package/dist/types/core/charts/choropleth/schema.d.ts +36 -0
- package/dist/types/core/charts/cohort/types.d.ts +8 -1
- package/dist/types/core/charts/column/layout.d.ts +1 -1
- package/dist/types/core/charts/column/model.d.ts +4 -0
- package/dist/types/core/charts/combo/endpoints.d.ts +1 -1
- package/dist/types/core/charts/creative/types.d.ts +1 -1
- package/dist/types/core/charts/dimswitch/compile.d.ts +2 -0
- package/dist/types/core/charts/dimswitch/types.d.ts +8 -0
- package/dist/types/core/charts/grid/normalize.d.ts +18 -1
- package/dist/types/core/charts/heatmap/fixtures.d.ts +2 -2
- package/dist/types/core/charts/histogram/types.d.ts +14 -2
- package/dist/types/core/charts/likert/layout.d.ts +14 -9
- package/dist/types/core/charts/logAxis.d.ts +55 -0
- package/dist/types/core/charts/pvm/types.d.ts +6 -0
- package/dist/types/core/charts/pyramid/types.d.ts +7 -4
- package/dist/types/core/charts/sankey/types.d.ts +3 -1
- package/dist/types/core/charts/scatter/clamp.d.ts +155 -0
- package/dist/types/core/charts/scatter/frontier.d.ts +21 -0
- package/dist/types/core/charts/scatter/index.d.ts +9 -0
- package/dist/types/core/charts/scatter/layout.d.ts +26 -0
- package/dist/types/core/charts/scatter/logAxis.d.ts +14 -0
- package/dist/types/core/charts/scatter/model.d.ts +258 -0
- package/dist/types/core/charts/scatter/schema.d.ts +57 -0
- package/dist/types/core/charts/scatter/trend.d.ts +54 -0
- package/dist/types/core/charts/scatter/valueLines.d.ts +47 -0
- package/dist/types/core/charts/sparkline/fixtures.d.ts +1 -1
- package/dist/types/core/charts/status/layout.d.ts +5 -3
- package/dist/types/core/charts/table/resolve.d.ts +0 -7
- package/dist/types/core/charts/tilemap/index.d.ts +6 -0
- package/dist/types/core/charts/tilemap/layout.d.ts +5 -0
- package/dist/types/core/charts/tilemap/schema.d.ts +4 -0
- package/dist/types/core/charts/treemap/types.d.ts +2 -2
- package/dist/types/core/charts/variance/fixtures.d.ts +2 -1
- package/dist/types/core/charts/waffle/types.d.ts +2 -0
- package/dist/types/core/dateFormat.d.ts +1 -1
- package/dist/types/core/deferred.d.ts +6 -1
- package/dist/types/core/doc/diagnostics.d.ts +8 -0
- package/dist/types/core/doc/document.d.ts +9 -1
- package/dist/types/core/doc/ownedDocumentCopy.d.ts +2 -1
- package/dist/types/core/fontMetrics/index.d.ts +1 -1
- package/dist/types/core/footer.d.ts +9 -1
- package/dist/types/core/format.d.ts +4 -1
- package/dist/types/core/formatSpec.d.ts +84 -6
- package/dist/types/core/frame.d.ts +41 -8
- package/dist/types/core/geo/packs/registry.d.ts +3 -2
- package/dist/types/core/geometry.d.ts +19 -0
- package/dist/types/core/icons.d.ts +11 -0
- package/dist/types/core/inputError.d.ts +3 -0
- package/dist/types/core/isoDate.d.ts +2 -0
- package/dist/types/core/label/categoryRow.d.ts +8 -0
- package/dist/types/core/label/occupied.d.ts +5 -0
- package/dist/types/core/label/solver.d.ts +31 -2
- package/dist/types/core/notes.d.ts +13 -1
- package/dist/types/core/ols.d.ts +38 -0
- package/dist/types/core/periodYears.d.ts +5 -1
- package/dist/types/core/registry.d.ts +12 -0
- package/dist/types/core/request.d.ts +3 -2
- package/dist/types/core/scale.d.ts +7 -0
- package/dist/types/core/schema/capability.d.ts +17 -20
- package/dist/types/core/schema/namedColumns.d.ts +6 -0
- package/dist/types/core/schema/refusals.d.ts +1 -4
- package/dist/types/core/shareRounding.d.ts +8 -0
- package/dist/types/core/sizing.d.ts +17 -12
- package/dist/types/core/story.d.ts +3 -0
- package/dist/types/core/target.d.ts +6 -0
- package/dist/types/core/text.d.ts +8 -0
- package/dist/types/core/theme.d.ts +55 -2
- package/dist/types/core/themeShape.d.ts +3 -3
- package/dist/types/core/themeValidate.d.ts +3 -3
- package/dist/types/core/types/annotations.d.ts +15 -3
- package/dist/types/core/types/data.d.ts +4 -1
- package/dist/types/core/types/diagram.d.ts +81 -2
- package/dist/types/core/types/optionInput.d.ts +13 -0
- package/dist/types/core/types/options.d.ts +65 -24
- package/dist/types/core/types/scene.d.ts +79 -2
- package/dist/types/core/types/table.d.ts +9 -0
- package/dist/types/core/types/theme.d.ts +50 -4
- package/dist/types/index.d.ts +28 -27
- package/dist/types/optionTypes.d.ts +44 -0
- package/dist/types/react/DimSwitchChart.d.ts +2 -1
- package/dist/types/react/RefusalBoundary.d.ts +25 -0
- package/dist/types/react/SceneRenderer.d.ts +3 -1
- package/dist/types/react/SizePlaceholder.d.ts +2 -1
- package/dist/types/react/TableChart.d.ts +8 -4
- package/dist/types/react/barrelCharts.d.ts +1521 -1012
- package/dist/types/react/charts/bar.d.ts +36 -25
- package/dist/types/react/charts/bartable.d.ts +36 -25
- package/dist/types/react/charts/box.d.ts +36 -25
- package/dist/types/react/charts/bullet.d.ts +36 -25
- package/dist/types/react/charts/butterfly.d.ts +36 -25
- package/dist/types/react/charts/choropleth.d.ts +36 -25
- package/dist/types/react/charts/cohort.d.ts +76 -50
- package/dist/types/react/charts/column.d.ts +36 -25
- package/dist/types/react/charts/combo.d.ts +2 -1
- package/dist/types/react/charts/creative.d.ts +31 -25
- package/dist/types/react/charts/diagram.d.ts +302 -160
- package/dist/types/react/charts/dot.d.ts +36 -25
- package/dist/types/react/charts/funnel.d.ts +36 -25
- package/dist/types/react/charts/gantt.d.ts +36 -25
- package/dist/types/react/charts/grid.d.ts +38 -27
- package/dist/types/react/charts/heatmap.d.ts +36 -25
- package/dist/types/react/charts/histogram.d.ts +36 -25
- package/dist/types/react/charts/kpi.d.ts +36 -25
- package/dist/types/react/charts/likert.d.ts +36 -25
- package/dist/types/react/charts/line.d.ts +36 -25
- package/dist/types/react/charts/mekko.d.ts +36 -25
- package/dist/types/react/charts/pareto.d.ts +33 -25
- package/dist/types/react/charts/pie.d.ts +36 -25
- package/dist/types/react/charts/pvm.d.ts +36 -25
- package/dist/types/react/charts/pyramid.d.ts +33 -25
- package/dist/types/react/charts/sankey.d.ts +36 -25
- package/dist/types/react/charts/scatter.d.ts +36 -25
- package/dist/types/react/charts/slope.d.ts +36 -25
- package/dist/types/react/charts/sparkline.d.ts +36 -25
- package/dist/types/react/charts/status.d.ts +36 -25
- package/dist/types/react/charts/tilemap.d.ts +36 -25
- package/dist/types/react/charts/treemap.d.ts +36 -25
- package/dist/types/react/charts/variance.d.ts +36 -25
- package/dist/types/react/charts/waffle.d.ts +36 -25
- package/dist/types/react/charts/waterfall.d.ts +36 -25
- package/dist/types/react/createChartComponent.d.ts +11 -9
- package/dist/types/react/footerFrame.d.ts +1 -1
- package/dist/types/react/hover/engine.d.ts +2 -1
- package/dist/types/react/hover/labelCard.d.ts +14 -2
- package/dist/types/react/prepare.d.ts +2 -2
- package/dist/types/react/prepared.d.ts +5 -1
- package/dist/types/react/rowsStore.d.ts +5 -0
- package/dist/types/react/useContainerSize.d.ts +2 -0
- package/dist/types/rows.d.ts +1 -1
- package/dist/validate.js +13 -8
- package/docs/manual.md +143 -37
- package/docs/reference/bar.md +10 -7
- package/docs/reference/bartable.md +7 -3
- package/docs/reference/box.md +5 -2
- package/docs/reference/bullet.md +7 -5
- package/docs/reference/butterfly.md +12 -5
- package/docs/reference/choropleth.md +9 -7
- package/docs/reference/cohort.md +3 -2
- package/docs/reference/column.md +14 -7
- package/docs/reference/combo.md +8 -6
- package/docs/reference/creative.md +1 -1
- package/docs/reference/diagram.md +94 -18
- package/docs/reference/dimswitch.md +16 -13
- package/docs/reference/dot.md +7 -4
- package/docs/reference/fixtures.md +49 -5
- package/docs/reference/funnel.md +4 -3
- package/docs/reference/gantt.md +1 -1
- package/docs/reference/grid.md +1 -1
- package/docs/reference/heatmap.md +6 -4
- package/docs/reference/histogram.md +7 -4
- package/docs/reference/kpi.md +11 -8
- package/docs/reference/likert.md +7 -3
- package/docs/reference/line.md +9 -8
- package/docs/reference/mekko.md +4 -4
- package/docs/reference/options.md +34 -32
- package/docs/reference/pareto.md +4 -4
- package/docs/reference/pie.md +8 -7
- package/docs/reference/pvm.md +4 -2
- package/docs/reference/pyramid.md +4 -4
- package/docs/reference/react.md +20 -11
- package/docs/reference/sankey.md +5 -3
- package/docs/reference/scatter.md +3 -3
- package/docs/reference/slope.md +7 -6
- package/docs/reference/sparkline.md +6 -5
- package/docs/reference/status.md +6 -4
- package/docs/reference/table.md +28 -26
- package/docs/reference/theme.md +94 -87
- package/docs/reference/tilemap.md +7 -6
- package/docs/reference/treemap.md +6 -5
- package/docs/reference/variance.md +8 -5
- package/docs/reference/waffle.md +2 -1
- package/docs/reference/waterfall.md +12 -9
- package/docs/use-cases.md +221 -0
- package/llms.txt +2 -1
- package/package.json +2 -1
- package/dist/chunk-2FNNAPCI.js +0 -24
- package/dist/chunk-2RSG7JYI.js +0 -24
- package/dist/chunk-3JEQGGVD.js +0 -19
- package/dist/chunk-3XHJHQWU.js +0 -42
- package/dist/chunk-4JLBVIGW.js +0 -24
- package/dist/chunk-6KWIQ5KF.js +0 -18
- package/dist/chunk-7X65ZQN4.js +0 -38
- package/dist/chunk-BBRBCMNR.js +0 -28
- package/dist/chunk-BMRD6MAH.js +0 -24
- package/dist/chunk-BW5VLBSZ.js +0 -15
- package/dist/chunk-CJGSJKPO.js +0 -25
- package/dist/chunk-CN7JRHST.js +0 -25
- package/dist/chunk-DJHIQWSG.js +0 -25
- package/dist/chunk-E4IQ6M4S.js +0 -24
- package/dist/chunk-EFUWFB64.js +0 -24
- package/dist/chunk-FIANWJXX.js +0 -19
- package/dist/chunk-GZTNTHSW.js +0 -21
- package/dist/chunk-H5G7T35P.js +0 -24
- package/dist/chunk-HKYTOJLV.js +0 -33
- package/dist/chunk-HYY5V2KL.js +0 -19
- package/dist/chunk-I6VAWNNU.js +0 -24
- package/dist/chunk-IK4BHOPZ.js +0 -33
- package/dist/chunk-ILSXT6KT.js +0 -24
- package/dist/chunk-JR7Y5ONB.js +0 -27
- package/dist/chunk-K3HSQPSM.js +0 -24
- package/dist/chunk-KDMKHR5A.js +0 -32
- package/dist/chunk-KOJ5QETJ.js +0 -8
- package/dist/chunk-L3JWM7FR.js +0 -50
- package/dist/chunk-L4S6UFTL.js +0 -26
- package/dist/chunk-LFTAMH7I.js +0 -24
- package/dist/chunk-MIAPBQCA.js +0 -24
- package/dist/chunk-NCB3YLHF.js +0 -28
- package/dist/chunk-ONZLC47B.js +0 -88
- package/dist/chunk-OUEGGWH7.js +0 -24
- package/dist/chunk-P25VEGGX.js +0 -24
- package/dist/chunk-P26Z62UV.js +0 -24
- package/dist/chunk-PFVTYFSL.js +0 -24
- package/dist/chunk-QGCEHR6S.js +0 -13
- package/dist/chunk-QOIVXZUF.js +0 -24
- package/dist/chunk-RA66JA3D.js +0 -24
- package/dist/chunk-SMCDXUIO.js +0 -24
- package/dist/chunk-T3IGJARD.js +0 -22
- package/dist/chunk-TKOJZQAJ.js +0 -24
- package/dist/chunk-UBZXQIDR.js +0 -24
- package/dist/chunk-VERLFNWR.js +0 -25
- package/dist/chunk-VH2UUU7K.js +0 -24
- package/dist/chunk-Z6CL7AR6.js +0 -24
- package/dist/chunk-ZU425HNM.js +0 -24
- package/dist/chunk-ZZU5R5UU.js +0 -24
- /package/dist/{DiagnosticDetails-UNYNYCAH.js → DiagnosticDetails-JFBBXOT2.js} +0 -0
|
@@ -59,27 +59,29 @@ A `cell` is a number, null or a value object; see [Value cell](options.md#value-
|
|
|
59
59
|
| series[].id | string | yes | Series identity used by keyed options, annotations and legend entries. |
|
|
60
60
|
| series[].label | string | | Displayed series name; defaults to the series id. |
|
|
61
61
|
| series[].values | (cell \| { categoryId, value: cell })[] | yes | Values in category order, or keyed entries pairing a categoryId with its value. |
|
|
62
|
-
| series[].scenario | string | | AC, PY, PL, FC (or ACT, BUD, FCST). Read only on the variance.vs series, where it names the tier (ΔPL). Every data value draws as the actual, so name a forecast or plan value in its category label or a footnote. |
|
|
62
|
+
| series[].scenario | string | | AC, PY, PL, FC (or ACT, BUD, FCST, LY for last year). Codes and aliases accept any case. Read only on the variance.vs series, where it names the tier (ΔPL). Every data value draws as the actual, so name a forecast or plan value in its category label or a footnote. In a grid tier, a category whose values are all FC draws hatched, like a partial one. |
|
|
63
63
|
| series[].direction | string | | Whether increases are favorable; defaults to higherIsBetter for directional comparisons. One of `'higherIsBetter'`, `'lowerIsBetter'`. |
|
|
64
64
|
| series[].role | string | | Data series or comparison-only reference series; references are excluded from the main plotted data. One of `'data'`, `'reference'`. |
|
|
65
65
|
| series[].colorRole | string | | Theme color role of the integrated actual columns and their key when this series is the actual and sets no fill; no effect in the other modes or on a reference series. One of good, bad, warn, neutral, neutralLight, highlight, total, others; series-N for step N of the theme ramp, 1-based (series-2 is color.series[1]); or status-<key> for a theme status colour. A hex colour goes in fill. |
|
|
66
66
|
| series[].fill | string | | CSS fill of the integrated actual columns and their key when this series is the actual; a cell fill wins. No effect in the other modes or on a reference series. |
|
|
67
|
-
| series[].unit | string | | Unit of this series' values, read
|
|
67
|
+
| series[].unit | string | | Unit of this series' values, read by the grid shared-scale check and the hover card; the drawn labels print options.unit. |
|
|
68
68
|
| series[].format | string | | Format-by-example for this series values, for example 1,234 or 1.2%. |
|
|
69
69
|
|
|
70
70
|
## Options
|
|
71
71
|
|
|
72
72
|
| Path | Type | Values | Default | Meaning |
|
|
73
73
|
|---|---|---|---|---|
|
|
74
|
+
| sort | object \| string \| true | `'sheet'`, `'asc'`, `'desc'`, `'reverse'`, `true` (or another value of its type) | | Category ranking value: the signed drawn difference, delta percent in relative mode and absolute difference otherwise. desc puts the largest positive difference first, asc the smallest; stable ties and missing values last. sheet keeps authored order and reverse reverses it. Dated categories keep authored order when a growth or difference annotation spans periods. |
|
|
75
|
+
| topN | object \| integer | | | Keep the n largest drawn differences by absolute size, delta percent in relative mode and absolute difference otherwise, before sorting. Missing differences count as zero. No Others row is drawn; omitted category names are disclosed. Authored rest: true, restLabel, showRestCount or threshold warns that it is ignored when categories are omitted. |
|
|
74
76
|
| axisTitles | object | | | Title of the value axis when it is drawn: over the value axis, in the top row left of the plot, when valueAxis.show draws it. Drawn only when authored. |
|
|
75
77
|
| axisTitles.primary | string | | | 'Measure, unit' title of the value axis, e.g. 'Margin, %'. |
|
|
76
78
|
| variant | string | `'absolute'`, `'relative'`, `'integrated'` | | Show raw differences, relative percentage differences, or an integrated comparison with the absolute values. The key builds its entries from the scenario code of the variance.vs series (AC, PY, PL or FC), or from its label when it has no scenario, here PY. absolute and relative: 'Better than PY' and 'Worse than PY', with (lower) and (higher) for a lowerIsBetter series. integrated: the compared series, then 'Above PY' and 'Below PY' for the caps, the same wording at every width, and 'Within rounding of PY' for a muted cap that prints as zero. On report, dashboard, slide and print, the actual value label sits inside the column at its foot; a column too short for it uses the actual edge, then a side position at the same height. |
|
|
77
79
|
| variance | object | | | Required comparison identifying the measured quantity and the reference series. |
|
|
78
80
|
| variance.of | string | `'total'` (or another value of its type) | | Compared series id, or total for the sum of data series. Defaults to total. |
|
|
79
81
|
| variance.vs | string | | | Reference-series id; its scenario names the comparison tier. |
|
|
80
|
-
| missingMark | string | `'dash'`, `'none'` | | What a category with no prior value leaves behind. 'dash' prints an en dash in the muted ink, at the baseline or, over an integrated actual column, where the cap would sit, so a missing reference reads as missing and not as no difference; 'none' (the default) draws nothing. A reference that exists and is not positive keeps its own 'n.m.' glyph. |
|
|
82
|
+
| missingMark | string | `'dash'`, `'none'` | | What a category with no prior value leaves behind. 'dash' prints an en dash in the muted ink, at the baseline or, over an integrated actual column, where the cap would sit, so a missing reference reads as missing and not as no difference; 'none' (the default) draws nothing. A reference that exists and is not positive keeps its own 'n.m.' glyph. A category with a blank part in its actual total leaves the same mark and the info warning missing-value. |
|
|
81
83
|
|
|
82
|
-
Plus the [shared options](options.md). This type does not accept `detailFields`, `
|
|
84
|
+
Plus the [shared options](options.md). This type does not accept `detailFields`, `valueAxis.log`, `valueAxis.reverse`, `valueAxis.break`, `hatchStrength`, `rounding`. This type ignores `animate`, `debug`, `rowLabels`, `categoryAxis`, `categoryLabels`, `secondaryAxis` with an `option-ignored` warning.
|
|
83
85
|
|
|
84
86
|
## Annotations
|
|
85
87
|
|
|
@@ -87,7 +89,7 @@ An annotation anchor is a category or item id string, or an object with category
|
|
|
87
89
|
|
|
88
90
|
| Kind | Purpose | Required | Anchors | Optional fields | Notes |
|
|
89
91
|
|---|---|---|---|---|---|
|
|
90
|
-
| cagr | Draws a growth arrow between two anchored points and computes the compound annual growth rate from their values and ISO-date span. | | from: AnchorRef (optional); to: AnchorRef (optional) | suffix: string, default 'p.a.'. Text after the rate. period: boolean. Print the period before the rate from the anchors' category labels, '2014–2019: +5.8% p.a.'. Default true when the chart carries two or more CAGRs, so nested brackets are told apart by their text, false otherwise. | Omitted endpoints span the first to the last category, or the first to the last total on a waterfall. Resolved endpoints need a positive date interval from ISO dates or year-bearing labels and a positive start value; an end of zero reads -100%, and a start at or below zero or a negative end omits the rate and warns cagr-undefined. On a continuous time axis the years are the exact span between the two readings. An anchor on one series of several (seriesId, or a line category, which reads the first drawn series) names that series in the label, "Product B +10.1% p.a.", and the arm runs from that series' segment or point. In text, ${value} prints the rate with its suffix, so "CAGR 2014–2019: ${value}" keeps the computed number. |
|
|
92
|
+
| cagr | Draws a growth arrow between two anchored points and computes the compound annual growth rate from their values and ISO-date span. | | from: AnchorRef (optional); to: AnchorRef (optional) | suffix: string, default 'p.a.'. Text after the rate. period: boolean. Print the period before the rate from the anchors' category labels, '2014–2019: +5.8% p.a.'. Default true when the chart carries two or more CAGRs, so nested brackets are told apart by their text, false otherwise. An arrow's ends show its span, so an arrow prints the rate alone unless period is true. shape: bracket \| arrow, default bracket. arrow draws one straight arrow over the marks with the rate in an oval on it, lifted until it clears them. Where no straight line clears the chart, the span is too short for the oval, a stack's inner layer is the anchor or the chart lays comparisons out itself, it draws the bracket and warns cagr-arrow-no-room. | Omitted endpoints span the first to the last category, or the first to the last total on a waterfall. Resolved endpoints need a positive date interval from ISO dates or year-bearing labels and a positive start value; an end of zero reads -100%, and a start at or below zero or a negative end omits the rate and warns cagr-undefined. On a continuous time axis the years are the exact span between the two readings. An anchor on one series of several (seriesId, or a line category, which reads the first drawn series) names that series in the label, "Product B +10.1% p.a.", and the arm runs from that series' segment or point. In text, ${value} prints the rate with its suffix, so "CAGR 2014–2019: ${value}" keeps the computed number. |
|
|
91
93
|
| diff | Draws a level-difference arrow between two anchors and computes either percent change or their signed value difference. | from, to | from: AnchorRef; to: AnchorRef | mode: relative \| absolute \| reversed, default relative. relative prints the percent change from 'from' to 'to', reversed the change from 'to' to 'from', absolute the value difference. | Mode defaults to relative. Relative and reversed changes need a nonzero base; negative bases use its absolute magnitude and emit a warning. Absolute mode reports the raw value difference. A hidden label removes its arm. |
|
|
92
94
|
| delta | Computes the signed difference between an anchored value and another anchor or literal, then places a collision-managed label at the first anchor. | at, vs | at: AnchorRef; vs: AnchorRef \| number | | |
|
|
93
95
|
| abs | Reads the anchored data value and places its formatted absolute value in a collision-managed label. | at | at: AnchorRef | | |
|
|
@@ -109,6 +111,7 @@ Below the floor a render is refused with `size-below-floor` and the pixels it ne
|
|
|
109
111
|
| dpy-absolute-regions | example | ΔPY absolute variance columns with forced signs |
|
|
110
112
|
| dpl-relative-pins | example | ΔPL% relative variance pins, ≤1 decimal, forced signs |
|
|
111
113
|
| integrated-fc-caps | example | Integrated variance: AC columns with ΔFC caps |
|
|
114
|
+
| integrated-solid-shortfall | example | Integrated variance with a solid shortfall cap (surface.shortfallCap) |
|
|
112
115
|
| ref-nonpositive-suppression | torture | Torture: REF zero and negative suppress Δ% with warnings |
|
|
113
116
|
| all-positive-deltas | torture | Total SaaS and services revenue growth by region versus prior year |
|
|
114
117
|
| all-negative-deltas | torture | Torture: all-negative ΔPL, labels mirrored below, category labels in one row under the bars |
|
package/docs/reference/waffle.md
CHANGED
|
@@ -58,6 +58,7 @@ A `cell` is a number, null or a value object; see [Value cell](options.md#value-
|
|
|
58
58
|
| grid.columns | integer | | `10` | Columns of cells in every panel, 1 to 50. |
|
|
59
59
|
| fillFrom | string | `'bottom'`, `'top'` | `'bottom'` | Where the fill starts. 'bottom' (default) starts at the bottom left, fills each row left to right and moves up. 'top' starts at the top left and moves down. A partly filled row fills from the left. |
|
|
60
60
|
| headline | string | `'value'`, `'none'` | | Automatic: a single-segment panel prints its value as a big number; several segments print their values in the key or below each grid. Authored 'value' prints a labelled total for several segments, in the format of the series or options.format. 'none' leaves the headline out. |
|
|
61
|
+
| heightFill | string | `'rows'`, `'none'` | `'rows'` | Spare canvas height of one panel with one series. 'rows' (default): a pinned canvas gives the grid the full plot height, with the value and the label beside the filled cells. 'none': the label, the value and the grid stack in a column. |
|
|
61
62
|
| cellNote | string | `'auto'`, `'none'` | | 'auto' (default) prints the note "One cell = 5%" under the chart when one cell is not 1% of the whole, so a coarse grid reads right. 'none' leaves it out. The wording comes from strings.cellNote, with '{value}' for the percent. |
|
|
62
63
|
| variant | string | `'cells'`, `'square'` | `'cells'` | 'cells' (default) draws the grid of cells. 'square' draws one solid square per panel whose AREA is the share (side = square root of the share × panel side), anchored at the fillFrom corner on the left, inside a pale tint of the same colour that stands for 100%. The headline prints under the panel. Square mode takes exactly one series (a nested second square would read as an L-shape, not a share) and refuses grid; there are no cells, so no cell note prints. Area understates differences (59% is 15 times 4% but only about 4 times as wide), so keep the headline. |
|
|
63
64
|
| reference | object | | | Square mode only. One reference share for ALL panels, drawn as a dashed square outline of that area in every panel (not in the reference panel itself) and named once in a key line above the panels (a note when legend is 'none' or a pinned size has no room). One reference keeps the outline meaning the same in every panel. |
|
|
@@ -74,7 +75,7 @@ A `cell` is a number, null or a value object; see [Value cell](options.md#value-
|
|
|
74
75
|
| subtotal.series | array | | | The summed segments: the first series and the ones right after it, in series order. |
|
|
75
76
|
| subtotal.label | string | | | What the sum stands for, such as 'within a day'; printed after the sum. |
|
|
76
77
|
|
|
77
|
-
Plus the [shared options](options.md). This type does not accept `detailFields`, `labels`, `
|
|
78
|
+
Plus the [shared options](options.md). This type does not accept `detailFields`, `labels`, `valueAxis.tickStep`, `valueAxis.log`, `valueAxis.reverse`, `valueAxis.break`, `highlight`, `story`, `hatchStrength`, `rounding`. This type ignores `animate`, `debug`, `rowLabels`, `categoryAxis`, `categoryLabels`, `secondaryAxis`, `sort`, `topN`, `bandFraction` with an `option-ignored` warning.
|
|
78
79
|
|
|
79
80
|
## Annotations
|
|
80
81
|
|
|
@@ -86,18 +86,18 @@ A `cell` is a number, null or a value object; see [Value cell](options.md#value-
|
|
|
86
86
|
| items[].segments[].label | string | | Displayed segment name; defaults to its id. |
|
|
87
87
|
| items[].segments[].value | cell | yes | Signed contribution of this segment to its item. |
|
|
88
88
|
| items[].segments[].colorRole | string | | Theme color role for this segment. One of good, bad, warn, neutral, neutralLight, highlight, total, others; series-N for step N of the theme ramp, 1-based (series-2 is color.series[1]); or status-<key> for a theme status colour. A hex colour goes in fill. |
|
|
89
|
-
| items[].segments[].scenario | string | | AC, PY, PL, FC (or ACT, BUD, FCST). Scenario controlling this segment paint convention. |
|
|
89
|
+
| items[].segments[].scenario | string | | AC, PY, PL, FC (or ACT, BUD, FCST, LY for last year). Codes and aliases accept any case. Scenario controlling this segment paint convention. |
|
|
90
90
|
| items[].date | string | | ISO 8601 date associated with this bridge item. |
|
|
91
|
-
| items[].scenario | string | | AC, PY, PL, FC (or ACT, BUD, FCST). Scenario for this bridge item and its default segment styling. |
|
|
91
|
+
| items[].scenario | string | | AC, PY, PL, FC (or ACT, BUD, FCST, LY for last year). Codes and aliases accept any case. Scenario for this bridge item and its default segment styling. |
|
|
92
92
|
| items[].direction | string | | Under 'lowerIsBetter' a rise paints bad and a fall good (options.signColor). One of `'higherIsBetter'`, `'lowerIsBetter'`. |
|
|
93
|
-
| items[].toBaseline | boolean | | Start this
|
|
93
|
+
| items[].toBaseline | boolean | | Start this delta at zero and reset the accumulated contribution list. A subtotal draws the sum of the deltas since the last total or baseline subtotal, from zero; the running level carries on. |
|
|
94
94
|
| items[].values | cell[] | | With data.cases: one value per case, in case order, in place of value — the signed delta of each case, or a total's opening or check value. |
|
|
95
95
|
| connectors | array | | Authored connections between item levels; omission uses the default sequence. |
|
|
96
96
|
| connectors[].from | string | yes | Source waterfall item id. |
|
|
97
97
|
| connectors[].to | string | yes | Destination waterfall item id. |
|
|
98
98
|
| connectors[].anchor | string | | Connect at the item sum or a named segment boundary. One of `'sum'` (or another value of its type). |
|
|
99
99
|
| connectors[].hidden | boolean | | Hide this connector and start a new summation at the destination. |
|
|
100
|
-
| cases | array | | Two or three cases of the same bridge side by side in each step (scenarios): each item gives values, one per case, and each case runs its own levels in its own colour, named in the key. Case bars draw no connectors, since a line to a case's next bar would cross the other case's bar; items take no value or segments, and data.connectors
|
|
100
|
+
| cases | array | | Two or three cases of the same bridge side by side in each step (scenarios): each item gives values, one per case, and each case runs its own levels in its own colour, named in the key. Case bars draw no connectors, since a line to a case's next bar would cross the other case's bar; items take no value or segments, and data.connectors is refused. Under variant 'horizontal' each step's case bars stack in its row. |
|
|
101
101
|
| cases[].id | string | yes | Case identity without ':', which joins it to an item id ('<item>:<case>'); an annotation anchor names it as seriesId. |
|
|
102
102
|
| cases[].label | string | | Displayed case name in the key; defaults to the id. |
|
|
103
103
|
|
|
@@ -105,14 +105,14 @@ A `cell` is a number, null or a value object; see [Value cell](options.md#value-
|
|
|
105
105
|
|
|
106
106
|
| Path | Type | Values | Default | Meaning |
|
|
107
107
|
|---|---|---|---|---|
|
|
108
|
-
| legend | string \| object | `'top'`, `'bottom'`, `'none'`, `'auto'` (or another value of its type) | | Key position. Segment, case and scenario encodings keep their key because numeric bar labels do not name them. With these encodings, 'none' retains the key and reports waterfall-legend-required. A plain bridge keys its sign colours only when a lowerIsBetter step inverts them. |
|
|
108
|
+
| legend | string \| object | `'top'`, `'bottom'`, `'right'`, `'left'`, `'none'`, `'auto'` (or another value of its type) | | Key position. Segment, case and scenario encodings keep their key because numeric bar labels do not name them. With these encodings, 'none' retains the key and reports waterfall-legend-required. A plain bridge keys its sign colours only when a lowerIsBetter step inverts them. |
|
|
109
109
|
| axisTitles | object | | | Authored primary value-axis title above the vertical plot, using column title styling. Waterfall draws no value ticks. Horizontal mode accepts this key but does not print it. |
|
|
110
110
|
| axisTitles.primary | string | | | 'Measure, unit' title of the value axis, e.g. 'Margin, %'. |
|
|
111
|
-
| variant | string | `'vertical'`, `'horizontal'` |
|
|
111
|
+
| variant | string | `'vertical'`, `'horizontal'` | | Left out: vertical columns, turned into a horizontal bridge when the step names would rotate, shorten or drop, the horizontal bridge draws without a new finding, and the spec has no cases and no annotations. 'vertical' always keeps columns. A horizontal bridge draws no annotations: it suppresses them and warns horizontal-annotations-unsupported, so use vertical for annotations. |
|
|
112
112
|
| build | string | `'up'`, `'down'` | `'up'` | Build label in the accessible description; defaults to up. Item types and signed values determine accumulation in both modes. |
|
|
113
|
-
| signColor | boolean | | | Paint each plain step good or bad by sign × item direction, as column's signColor; zero is neutral. Default true unless the theme sets marks.bridge or a palette is named; false paints steps neutral. |
|
|
113
|
+
| signColor | boolean | | | Paint each plain step good or bad by sign × item direction, as column's signColor; zero is neutral. Default true unless the theme sets marks.bridge or a palette is named; false paints steps neutral. colorblindSafe paints signed steps, labels and key swatches with the theme's colour-blind pair. |
|
|
114
114
|
|
|
115
|
-
Plus the [shared options](options.md). This type does not accept `detailFields`, `labels`, `
|
|
115
|
+
Plus the [shared options](options.md). This type does not accept `detailFields`, `labels`, `valueAxis.min`, `valueAxis.max`, `valueAxis.tickStep`, `valueAxis.includeZero`, `valueAxis.percent`, `valueAxis.log`, `valueAxis.reverse`, `rounding`. This type ignores `animate`, `debug`, `rowLabels`, `categoryAxis`, `categoryLabels`, `secondaryAxis`, `sort`, `topN`, `valueAxis.show`, `valueAxis.gridlines` with an `option-ignored` warning.
|
|
116
116
|
|
|
117
117
|
## Annotations
|
|
118
118
|
|
|
@@ -120,13 +120,14 @@ An annotation anchor is a category or item id string, or an object with category
|
|
|
120
120
|
|
|
121
121
|
| Kind | Purpose | Required | Anchors | Optional fields | Notes |
|
|
122
122
|
|---|---|---|---|---|---|
|
|
123
|
-
| cagr | Draws a growth arrow between two anchored points and computes the compound annual growth rate from their values and ISO-date span. | | from: AnchorRef (optional); to: AnchorRef (optional) | suffix: string, default 'p.a.'. Text after the rate. period: boolean. Print the period before the rate from the anchors' category labels, '2014–2019: +5.8% p.a.'. Default true when the chart carries two or more CAGRs, so nested brackets are told apart by their text, false otherwise. | Omitted endpoints span the first to the last category, or the first to the last total on a waterfall. Resolved endpoints need a positive date interval from ISO dates or year-bearing labels and a positive start value; an end of zero reads -100%, and a start at or below zero or a negative end omits the rate and warns cagr-undefined. On a continuous time axis the years are the exact span between the two readings. An anchor on one series of several (seriesId, or a line category, which reads the first drawn series) names that series in the label, "Product B +10.1% p.a.", and the arm runs from that series' segment or point. In text, ${value} prints the rate with its suffix, so "CAGR 2014–2019: ${value}" keeps the computed number. |
|
|
123
|
+
| cagr | Draws a growth arrow between two anchored points and computes the compound annual growth rate from their values and ISO-date span. | | from: AnchorRef (optional); to: AnchorRef (optional) | suffix: string, default 'p.a.'. Text after the rate. period: boolean. Print the period before the rate from the anchors' category labels, '2014–2019: +5.8% p.a.'. Default true when the chart carries two or more CAGRs, so nested brackets are told apart by their text, false otherwise. An arrow's ends show its span, so an arrow prints the rate alone unless period is true. shape: bracket \| arrow, default bracket. arrow draws one straight arrow over the marks with the rate in an oval on it, lifted until it clears them. Where no straight line clears the chart, the span is too short for the oval, a stack's inner layer is the anchor or the chart lays comparisons out itself, it draws the bracket and warns cagr-arrow-no-room. | Omitted endpoints span the first to the last category, or the first to the last total on a waterfall. Resolved endpoints need a positive date interval from ISO dates or year-bearing labels and a positive start value; an end of zero reads -100%, and a start at or below zero or a negative end omits the rate and warns cagr-undefined. On a continuous time axis the years are the exact span between the two readings. An anchor on one series of several (seriesId, or a line category, which reads the first drawn series) names that series in the label, "Product B +10.1% p.a.", and the arm runs from that series' segment or point. In text, ${value} prints the rate with its suffix, so "CAGR 2014–2019: ${value}" keeps the computed number. |
|
|
124
124
|
| diff | Draws a level-difference arrow between two anchors and computes either percent change or their signed value difference. | from, to | from: AnchorRef; to: AnchorRef | mode: relative \| absolute \| reversed, default relative. relative prints the percent change from 'from' to 'to', reversed the change from 'to' to 'from', absolute the value difference. | Mode defaults to relative. Relative and reversed changes need a nonzero base; negative bases use its absolute magnitude and emit a warning. Absolute mode reports the raw value difference. A hidden label removes its arm. |
|
|
125
125
|
| delta | Computes the signed difference between an anchored value and another anchor or literal, then places a collision-managed label at the first anchor. | at, vs | at: AnchorRef; vs: AnchorRef \| number | | |
|
|
126
126
|
| note | Places authored text at an anchored data element through collision avoidance, with an optional icon or status chip. | at, text | at: AnchorRef | | |
|
|
127
127
|
| callout | Places authored free text at an anchored data element, routing a leader when displaced and honoring the preferred side. | at, text | at: AnchorRef | preferSide: left \| right \| above \| below. Side the solver tries first; the label keeps a leader when it moves. headline: string. A bold first line over the text, which then prints in plain type; ${value} in it prints the anchored value from the data. Example: "headline": "${value}", "text": "Peak in handheld-loom demand" prints 153 in bold over the words. arrow: boolean, default false. A thin arrow from the text to the anchored point; the first line sits level with the point, right or left of it, where there is room. Not with icon or status. Example: "arrow": true. | |
|
|
128
128
|
| valueLine | Draws a reference line at an authored value or an engine-computed mean, with optional tolerance shading and attainment fill between the line and resolved actuals. | | from: categoryId (optional); to: categoryId (optional) | value: number \| 'mean', default mean. A number draws the line there; mean has the engine compute it. valueKind: 'fraction'. Multiply a numeric value and its tolerance by 100 before layout: 0.35 draws at 35%. Independent of data.valueKind. Omit it for values already in percent points; not valid with mean. label: string \| false. Name plus value; ${value} sets its position. A number already in the name is kept once. false hides it. side: left \| right, default right. Side of the plot the label sits on. tolerance: number \| { low, high }. A number shades that distance on both sides of the line; low and high shade an authored corridor. | No anchor is required. Value defaults to mean. Scoped means are line-only: seriesId and paired from/to compute a primary-axis mean and limit its stroke to those bands; other types refuse scope fields for a mean. Numeric values cannot use scope fields except as a category clip with tolerance or attainment. A secondary-axis line needs an acknowledged secondary scale and an explicit numeric value. Optional tolerance shades a value-axis band; optional attainment fills between the line and resolved actuals. |
|
|
129
129
|
| abs | Reads the anchored data value and places its formatted absolute value in a collision-managed label. | at | at: AnchorRef | | |
|
|
130
|
+
| bracket | Draws a bracket over an inclusive span of steps and prints the sum of their values, after an optional label. | from, to | from: categoryId; to: categoryId | label: string. Name printed before the sum, "Commercial +81". Without it the bracket prints the sum alone. | from and to are step ids, inclusive. The engine adds the steps up and prints the signed sum; every step in the span must be a delta, so a span that holds a total is refused with bracket-span-total. A step the bridge cannot add (an open start) refuses it with bracket-span-no-value. Brackets stand in one row above the steps. Vertical bridges only. |
|
|
130
131
|
|
|
131
132
|
## Sizing
|
|
132
133
|
|
|
@@ -142,6 +143,7 @@ Below the floor a render is refused with `size-below-floor` and the pixels it ne
|
|
|
142
143
|
| ebit-bridge | example | EBIT bridge FY21→FY24 |
|
|
143
144
|
| interview-status-buildup | example | Interview pipeline build-up by status |
|
|
144
145
|
| revenue-build-up | example | Revenue → EBIT build-up with diff arrow |
|
|
146
|
+
| step-brackets | example | Brackets over bridge steps print their sums |
|
|
145
147
|
| build-down | example | Build-down: revenue to net income |
|
|
146
148
|
| whole-axis-opt-out | example | Whole value axis kept with an explicit false |
|
|
147
149
|
| automatic-axis-break | example | Explicit automatic break makes small steps on a large base easier to compare |
|
|
@@ -160,5 +162,6 @@ Below the floor a render is refused with `size-below-floor` and the pixels it ne
|
|
|
160
162
|
| cost-bridge-lower-is-better | example | Cost bridge: a rise paints bad and a saving good under lowerIsBetter |
|
|
161
163
|
| neutral-steps | example | signColor false keeps every step in the neutral |
|
|
162
164
|
| two-case-budget-bridge | example | Two cases side by side in each step: a conservative and an aggressive budget |
|
|
165
|
+
| two-case-budget-bars | example | The two-case bridge as bars: each value stands past the end of its own bar |
|
|
163
166
|
| single-segment-authored-format | example | One segment prints one value at the authored precision |
|
|
164
167
|
| repeated-segment-key | torture | Equal segment names and colours share one key |
|
|
@@ -0,0 +1,221 @@
|
|
|
1
|
+
# Use cases: Boardplot with an AI agent
|
|
2
|
+
|
|
3
|
+
This page shows how to get finished results from an AI agent such as Claude Code or Codex with Boardplot: a slide deck, an analysis page, a React dashboard, a Word report or a weekly report. Install Boardplot once, then name it in the prompt. The agent writes the chart specs, draws the charts with the Boardplot tools and puts them into the result.
|
|
4
|
+
|
|
5
|
+
Each use case has the same parts: what you get, example prompts to copy, what the agent does, tips for better results, and the limits. Each use case also links a worked example in [examples](https://github.com/boardplot/boardplot/tree/main/docs/examples): the data, the specs, the finished file and the script that builds it, all with invented data. The [manual](manual.md) explains the spec, the tools and every option.
|
|
6
|
+
|
|
7
|
+
## Install
|
|
8
|
+
|
|
9
|
+
- **Claude Code and Codex:** install the plugin. It adds the Boardplot MCP server and the `boardplot-chart` skill. See [AI agents](../README.md#ai-agents) in the README.
|
|
10
|
+
- **Other MCP clients:** install the package globally and add the stdio server `boardplot-mcp`. The same README section has the config.
|
|
11
|
+
- **React apps:** add the package to the project. See [React](../README.md#react) in the README.
|
|
12
|
+
|
|
13
|
+
To check the install, start a new session and ask:
|
|
14
|
+
|
|
15
|
+
```text
|
|
16
|
+
Use Boardplot to draw a small column chart from sample data as PNG. Tell me the Boardplot version and the file path.
|
|
17
|
+
```
|
|
18
|
+
|
|
19
|
+
The agent calls `boardplot_render`, writes the PNG and reports the version that every Boardplot tool returns. [The plugin setup](../release/plugin/boardplot-marketplace/plugins/boardplot/SETUP.md) has the full checks and the troubleshooting.
|
|
20
|
+
|
|
21
|
+
**Tips for every use case:**
|
|
22
|
+
|
|
23
|
+
- **Give the data as a file.** Name a CSV or JSON export in the prompt, for example `data/orders.csv`. The agent passes the file to Boardplot as `rowsFile`, so the numbers go from the file to the chart and never pass through the model. See [Rows as data](manual.md#rows-as-data).
|
|
24
|
+
- **Name the destination.** Say "for a slide", "for a Word report" or "for a dashboard". The agent then sets the `target`, which sets the type sizes for that medium. See [Sizing](manual.md#sizing).
|
|
25
|
+
- **Give your brand colours.** Give the hex codes of your highlight and series colours, or a theme file. The agent passes them as a theme, for example `{ "preset": "standard", "overrides": { "color": { "highlight": "#0B5CAD" } } }`. See [the theme reference](reference/theme.md).
|
|
26
|
+
- **Say what each chart should show.** A title that states the finding, such as "Online orders keep growing", gives a better chart than "Orders by week".
|
|
27
|
+
|
|
28
|
+
## PowerPoint or Keynote deck
|
|
29
|
+
|
|
30
|
+
**You get:** a new deck with Boardplot charts, or your existing deck with its charts replaced by Boardplot charts.
|
|
31
|
+
|
|
32
|
+
**Example prompts:**
|
|
33
|
+
|
|
34
|
+
```text
|
|
35
|
+
Build a 10-slide quarterly review deck from data/q3-sales.csv. Use Boardplot for every chart.
|
|
36
|
+
```
|
|
37
|
+
|
|
38
|
+
```text
|
|
39
|
+
Revise my presentation board-update.pptx and replace all charts with Boardplot charts. Keep the slide text and layout.
|
|
40
|
+
```
|
|
41
|
+
|
|
42
|
+
```text
|
|
43
|
+
Add a revenue bridge from FY24 to FY25 to slide 4 of strategy.pptx, drawn with Boardplot, in our colours #0B5CAD and #A9C1D9.
|
|
44
|
+
```
|
|
45
|
+
|
|
46
|
+
**What the agent does:** Boardplot draws the chart images, and the agent's own PowerPoint tool, such as a pptx skill or a Python library, places them in the file. For each chart, the agent:
|
|
47
|
+
|
|
48
|
+
1. Reads the data from your file, or from the chart it replaces.
|
|
49
|
+
2. Calls `boardplot_describe` for the chart type and writes the spec.
|
|
50
|
+
3. Calls `boardplot_render` with `target: "slide"`, `format: "png"` and the size of the picture box, for example `options.size: { "width": 660, "height": 372, "unit": "pt" }`.
|
|
51
|
+
4. Places the PNG in the picture box.
|
|
52
|
+
|
|
53
|
+
The PNG has 2 pixels per layout pixel, the default `scale`, and records 192 dpi. PowerPoint, Keynote and Word read the dpi, so they place a scale-2 PNG at the chart's own size, with sharp text. Without a size, a `slide` chart is 888 × 396 pt, the content area of a 16:9 slide.
|
|
54
|
+
|
|
55
|
+
**Tips:**
|
|
56
|
+
|
|
57
|
+
- Give the size of the picture box, or say "full slide". A box that is too small for the chart is refused, and the error's `suggest` names the size that fits, for example "Pass height 372pt.".
|
|
58
|
+
- Ask for SVG instead of PNG when the deck stays in PowerPoint. A `slide` SVG carries its size in pt and stays sharp at any zoom.
|
|
59
|
+
- For a dark slide background, ask for a dark preset such as `standard-dark`. A transparent background keeps the theme's background colour in the label halos.
|
|
60
|
+
|
|
61
|
+
**Limits:**
|
|
62
|
+
|
|
63
|
+
- The charts are pictures. Colleagues cannot edit their data in PowerPoint. To change a chart, ask the agent to draw it again.
|
|
64
|
+
- Keynote: the agent builds a `.pptx` file, and Keynote opens it.
|
|
65
|
+
- Google Slides does not insert SVG files. Use PNG there.
|
|
66
|
+
- A PNG draws with the fonts installed on the machine that renders. For a brand font, see [Custom fonts](FONTS.md).
|
|
67
|
+
|
|
68
|
+
**Worked example:** [docs/examples/deck](https://github.com/boardplot/boardplot/tree/main/docs/examples/deck) builds an eight-slide board deck, `quarterly-review.pptx`, in a consulting layout: action titles, KPI tiles, a price-volume-mix bridge, CAGR labels, IBCS variance charts, a market map and a P&L table with computed variances. Each chart fills its slot beside editable takeaways. The revise case turns `board-update-before.pptx`, with native PowerPoint charts, into `board-update-after.pptx`: the same data drawn by Boardplot, in the same boxes, with the slide text unchanged.
|
|
69
|
+
|
|
70
|
+
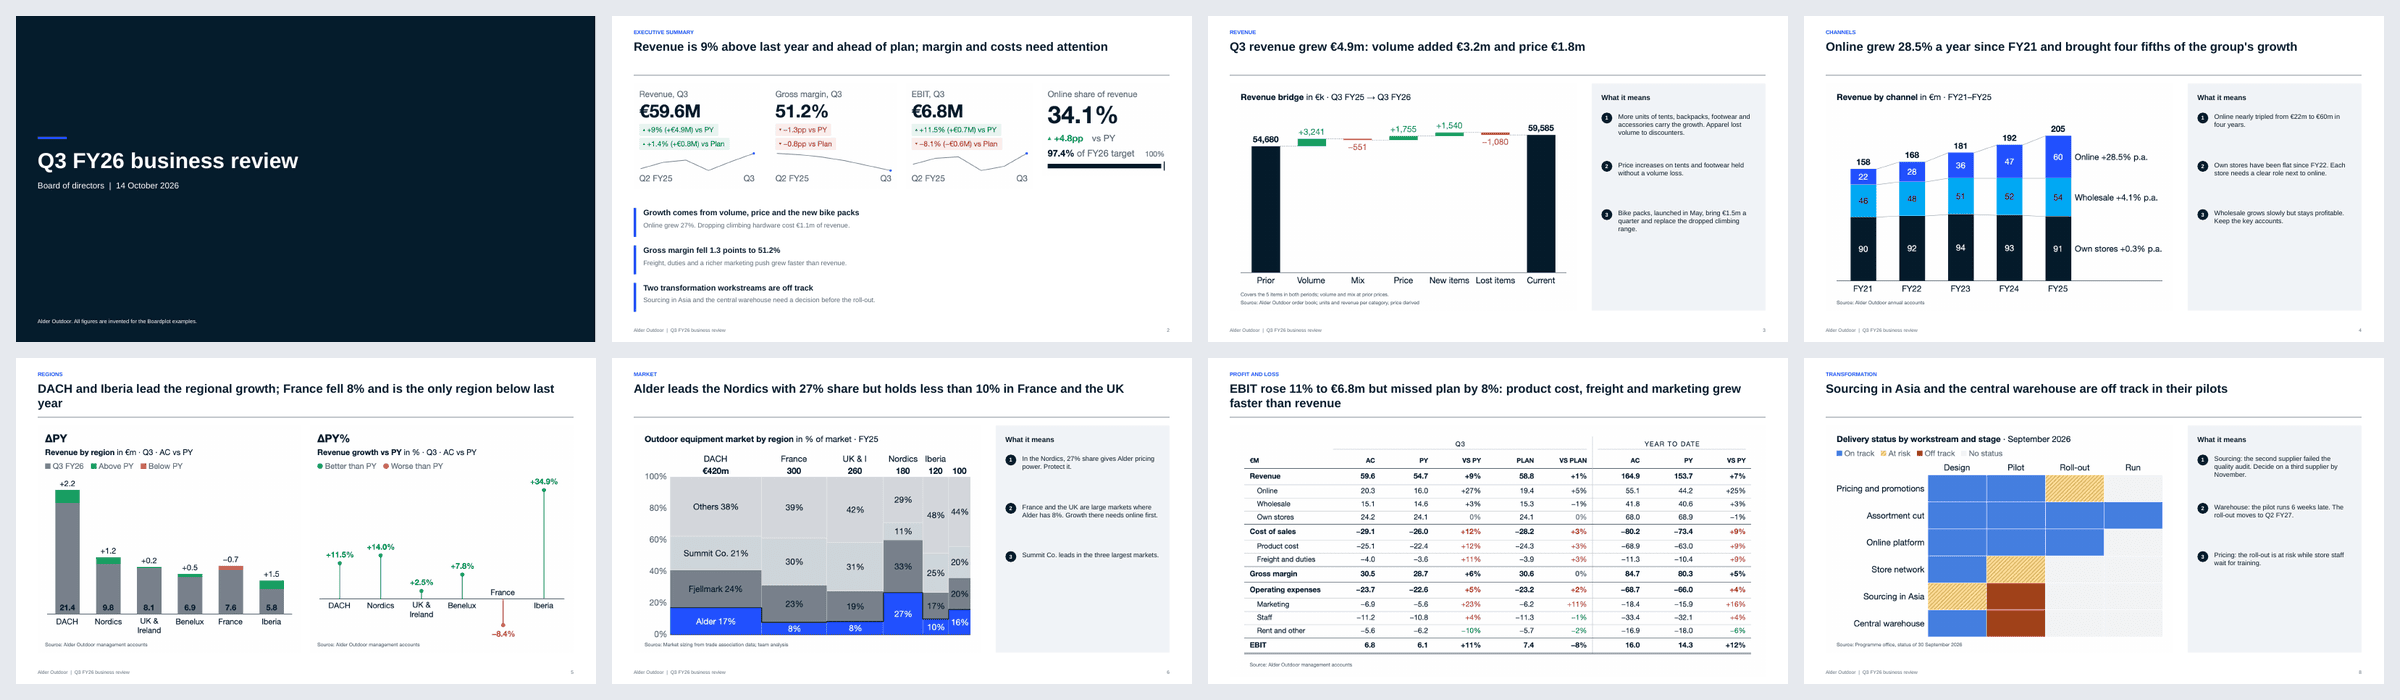
|
|
71
|
+
|
|
72
|
+
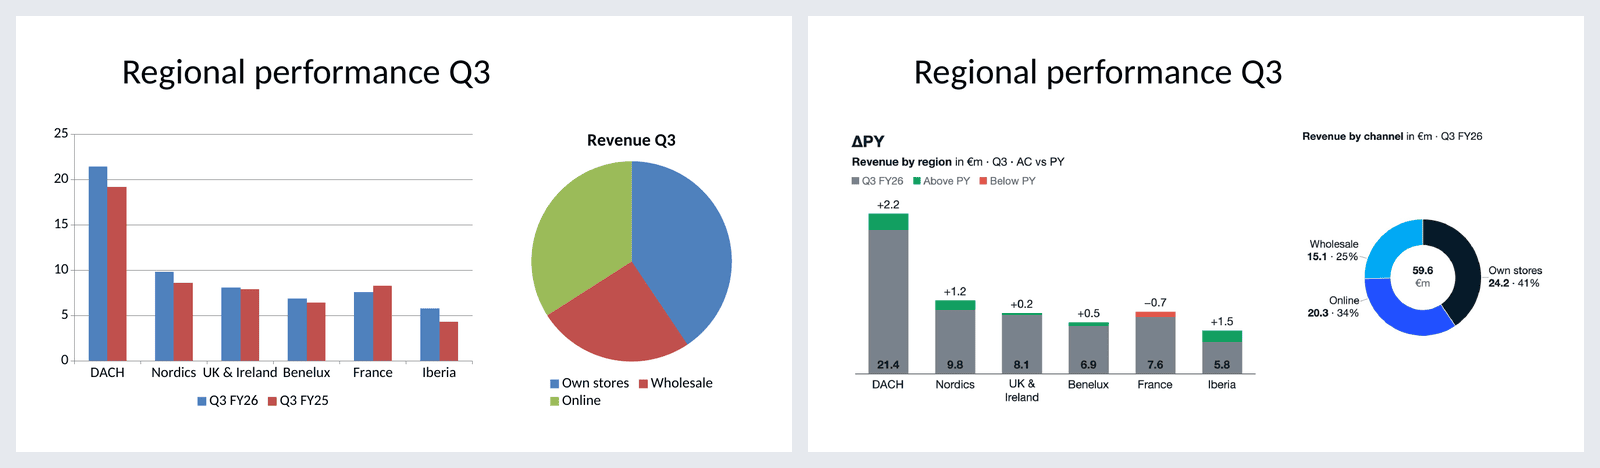
|
|
73
|
+
|
|
74
|
+
## Analysis page or Claude artifact
|
|
75
|
+
|
|
76
|
+
**You get:** an analysis written as an HTML page, such as a Claude artifact or a report page, with the charts in the page.
|
|
77
|
+
|
|
78
|
+
**Example prompts:**
|
|
79
|
+
|
|
80
|
+
```text
|
|
81
|
+
Analyse data/churn.csv: which customer segments churn most, and since when? Write the result as an artifact and draw every chart with Boardplot.
|
|
82
|
+
```
|
|
83
|
+
|
|
84
|
+
```text
|
|
85
|
+
Write a one-page HTML report on last month's marketing spend from exports/spend.csv. Use Boardplot for the charts and our colours #0B5CAD and #A9C1D9.
|
|
86
|
+
```
|
|
87
|
+
|
|
88
|
+
**What the agent does:**
|
|
89
|
+
|
|
90
|
+
1. Analyses the data and decides which finding each chart shows.
|
|
91
|
+
2. Calls `boardplot_render` with the data file as `rowsFile` and `return: ["reading", "svg"]`. The answer carries the chart's SVG markup in `svg`.
|
|
92
|
+
3. Puts each SVG inline in the page. The page needs no script and loads nothing from the network to show the charts.
|
|
93
|
+
4. Reads the `reading` of each render, the numbers Boardplot computed (totals, differences, growth rates), and uses them in the text, so text and chart agree.
|
|
94
|
+
|
|
95
|
+
**Tips:**
|
|
96
|
+
|
|
97
|
+
- Ask the agent to state the finding in each chart title.
|
|
98
|
+
- Ask it to check the warnings of each render, such as `label-hidden`, before it writes the page.
|
|
99
|
+
- Say the column width of the page if it is not about 720 px. The agent renders at that width instead of shrinking a wider chart.
|
|
100
|
+
|
|
101
|
+
**Limits:**
|
|
102
|
+
|
|
103
|
+
- The SVG is a static image: no hover cards or filters. Those need the React components.
|
|
104
|
+
- The SVG names the theme's font stack and embeds no font. The preset themes use system fonts. A brand web font must be loaded by the page.
|
|
105
|
+
|
|
106
|
+
**Worked example:** [docs/examples/analysis-page](https://github.com/boardplot/boardplot/tree/main/docs/examples/analysis-page) has `index.html`, a gross margin review with a margin bridge, a category table with bars and a price-volume scatter with quadrants. Its headline, key numbers and findings take their numbers from the data and the `reading` of each render.
|
|
107
|
+
|
|
108
|
+
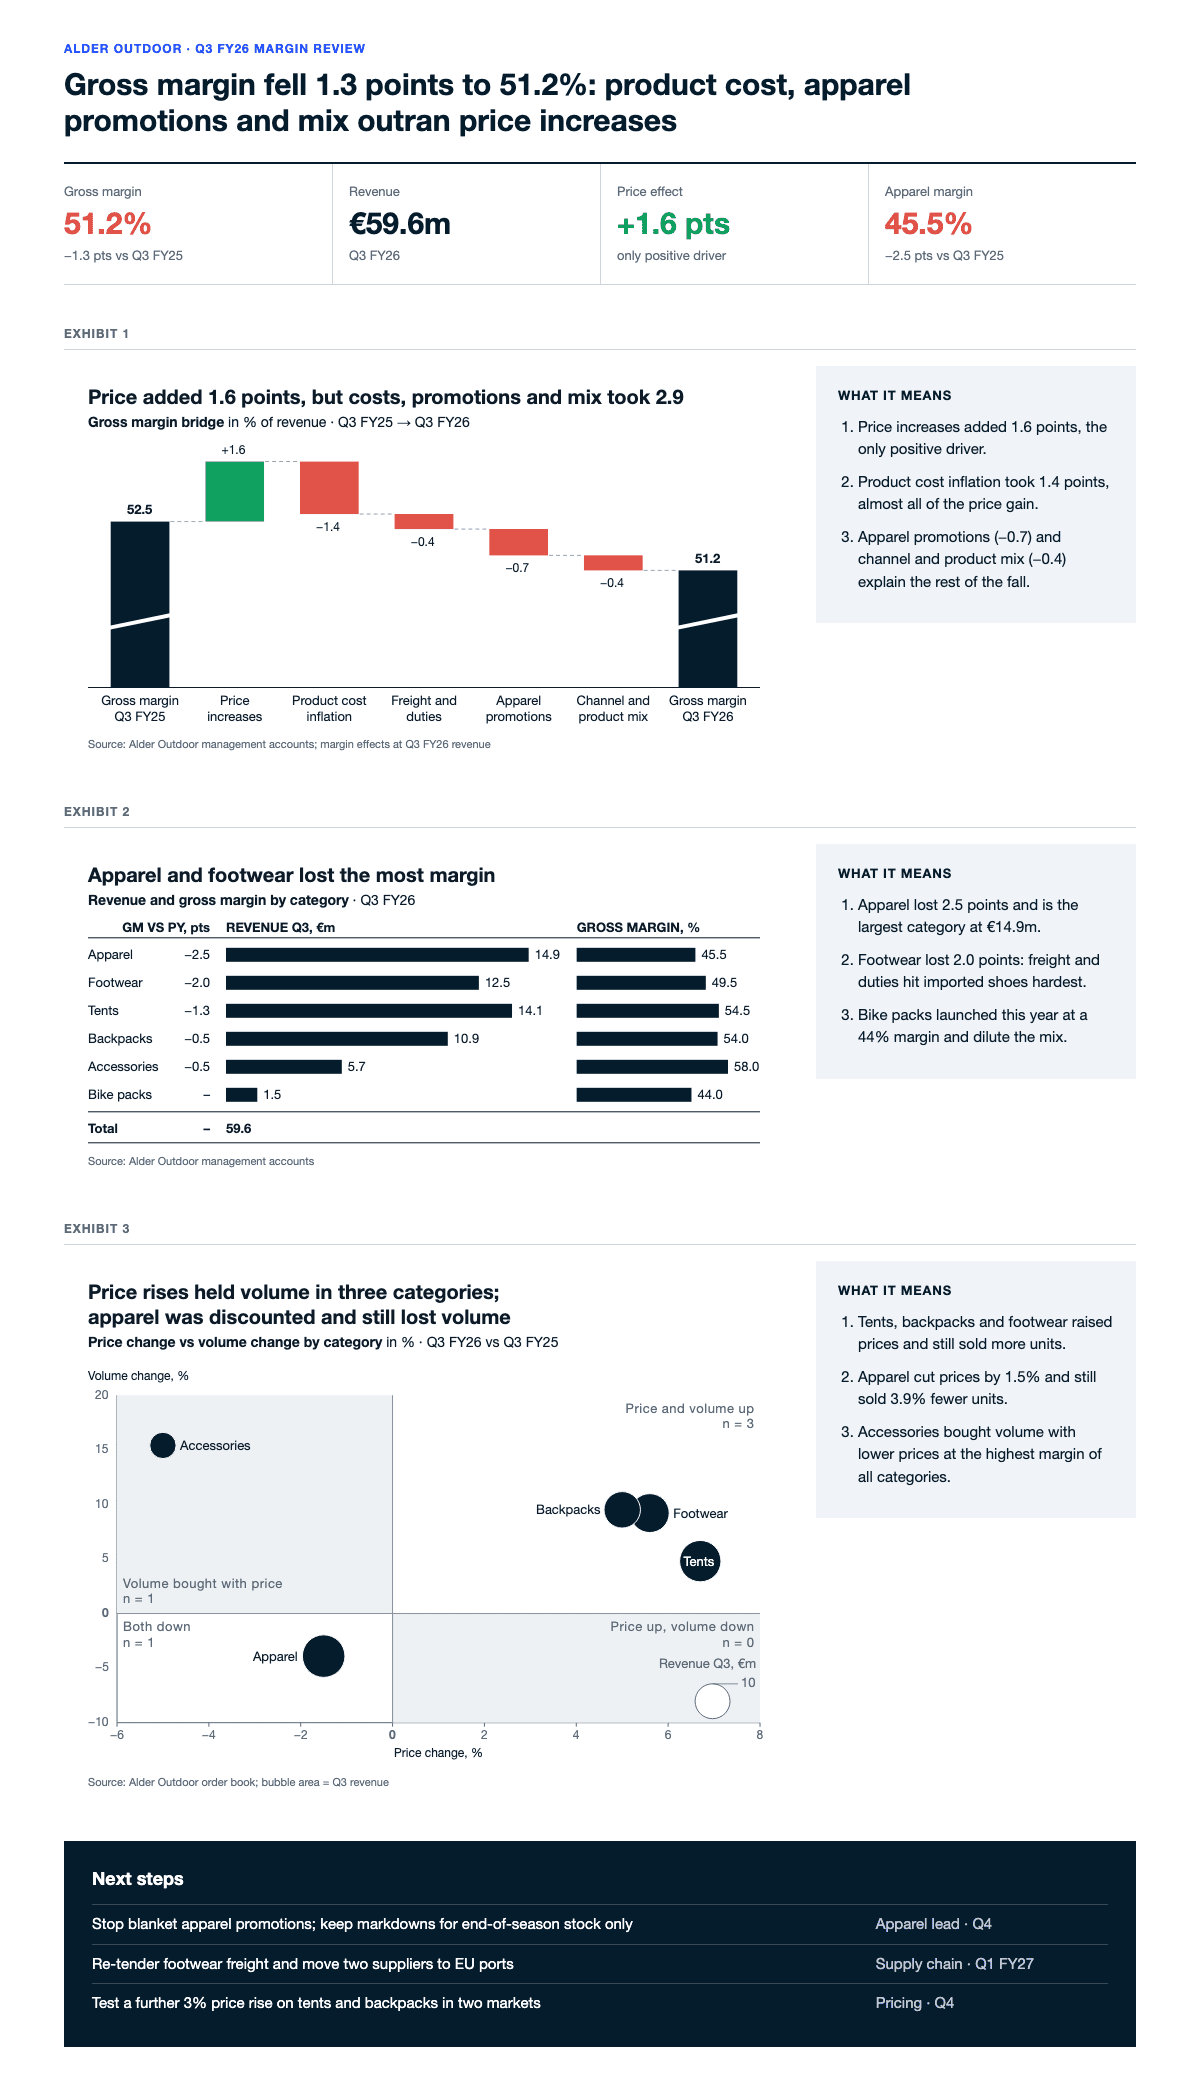
|
|
109
|
+
|
|
110
|
+
## React dashboard
|
|
111
|
+
|
|
112
|
+
**You get:** a new React or Next.js dashboard with Boardplot charts, or an existing dashboard with its charts moved to Boardplot.
|
|
113
|
+
|
|
114
|
+
**Example prompts:**
|
|
115
|
+
|
|
116
|
+
```text
|
|
117
|
+
Build the sales dashboard in Next.js from the API in src/api/sales.ts and use Boardplot for the chart work.
|
|
118
|
+
```
|
|
119
|
+
|
|
120
|
+
```text
|
|
121
|
+
Move the charts of this dashboard from our current chart library to Boardplot. Keep the data loading and the page layout as they are.
|
|
122
|
+
```
|
|
123
|
+
|
|
124
|
+
**What the agent does:**
|
|
125
|
+
|
|
126
|
+
1. Calls `boardplot_list` and `boardplot_describe` to choose the chart types and their options.
|
|
127
|
+
2. Uses the per-type components, such as `ColumnChart` from `boardplot/react/column`, with `size="container"`, so each chart lays out in its card.
|
|
128
|
+
3. Wraps the page in `BoardplotTheme` with `target="dashboard"` and your theme, so every chart shares one look.
|
|
129
|
+
4. In Next.js, prepares the charts on the server with `prepareChart`, so the first paint shows the chart.
|
|
130
|
+
|
|
131
|
+
The [React reference](reference/react.md) has each part: [per-type components](reference/react.md#per-type-components), [container sizing](reference/react.md#container-sizing), [theme provider](reference/react.md#theme-provider), [server preparation](reference/react.md#server-preparation), [rows from a query](reference/react.md#rows-from-a-query) and [export](reference/react.md#export).
|
|
132
|
+
|
|
133
|
+
**Tips:**
|
|
134
|
+
|
|
135
|
+
- Ask the agent to draw each chart once with `boardplot_render` before it writes the component. A refusal or a warning then shows up before the page is built.
|
|
136
|
+
- Name the chart for each card if you know it, for example "a waterfall for the margin bridge".
|
|
137
|
+
- When you move a dashboard, ask the agent to list each old chart with the Boardplot type it chose.
|
|
138
|
+
|
|
139
|
+
**Limits:**
|
|
140
|
+
|
|
141
|
+
- React 18 or 19. The package has ES module entries only.
|
|
142
|
+
- `boardplot_list` names chart forms that Boardplot does not draw. The agent keeps those charts in the old library or proposes another type.
|
|
143
|
+
- A parent that takes its width from its content keeps the chart at its fallback width. See [container sizing](reference/react.md#container-sizing).
|
|
144
|
+
- A strict content security policy needs a style nonce. See [content security policy](reference/react.md#content-security-policy).
|
|
145
|
+
|
|
146
|
+
**Worked example:** [docs/examples/react-dashboard](https://github.com/boardplot/boardplot/tree/main/docs/examples/react-dashboard) is a weekly trading dashboard in Vite and React: KPI tiles with sparklines, a channel KPI table that switches between two views, a region variance that compares with last year or plan, two weekly charts on one shared scale (`ScaleGroup`) and PNG and CSV export on each card. Run `npm install` and `npm run dev` in that folder.
|
|
147
|
+
|
|
148
|
+
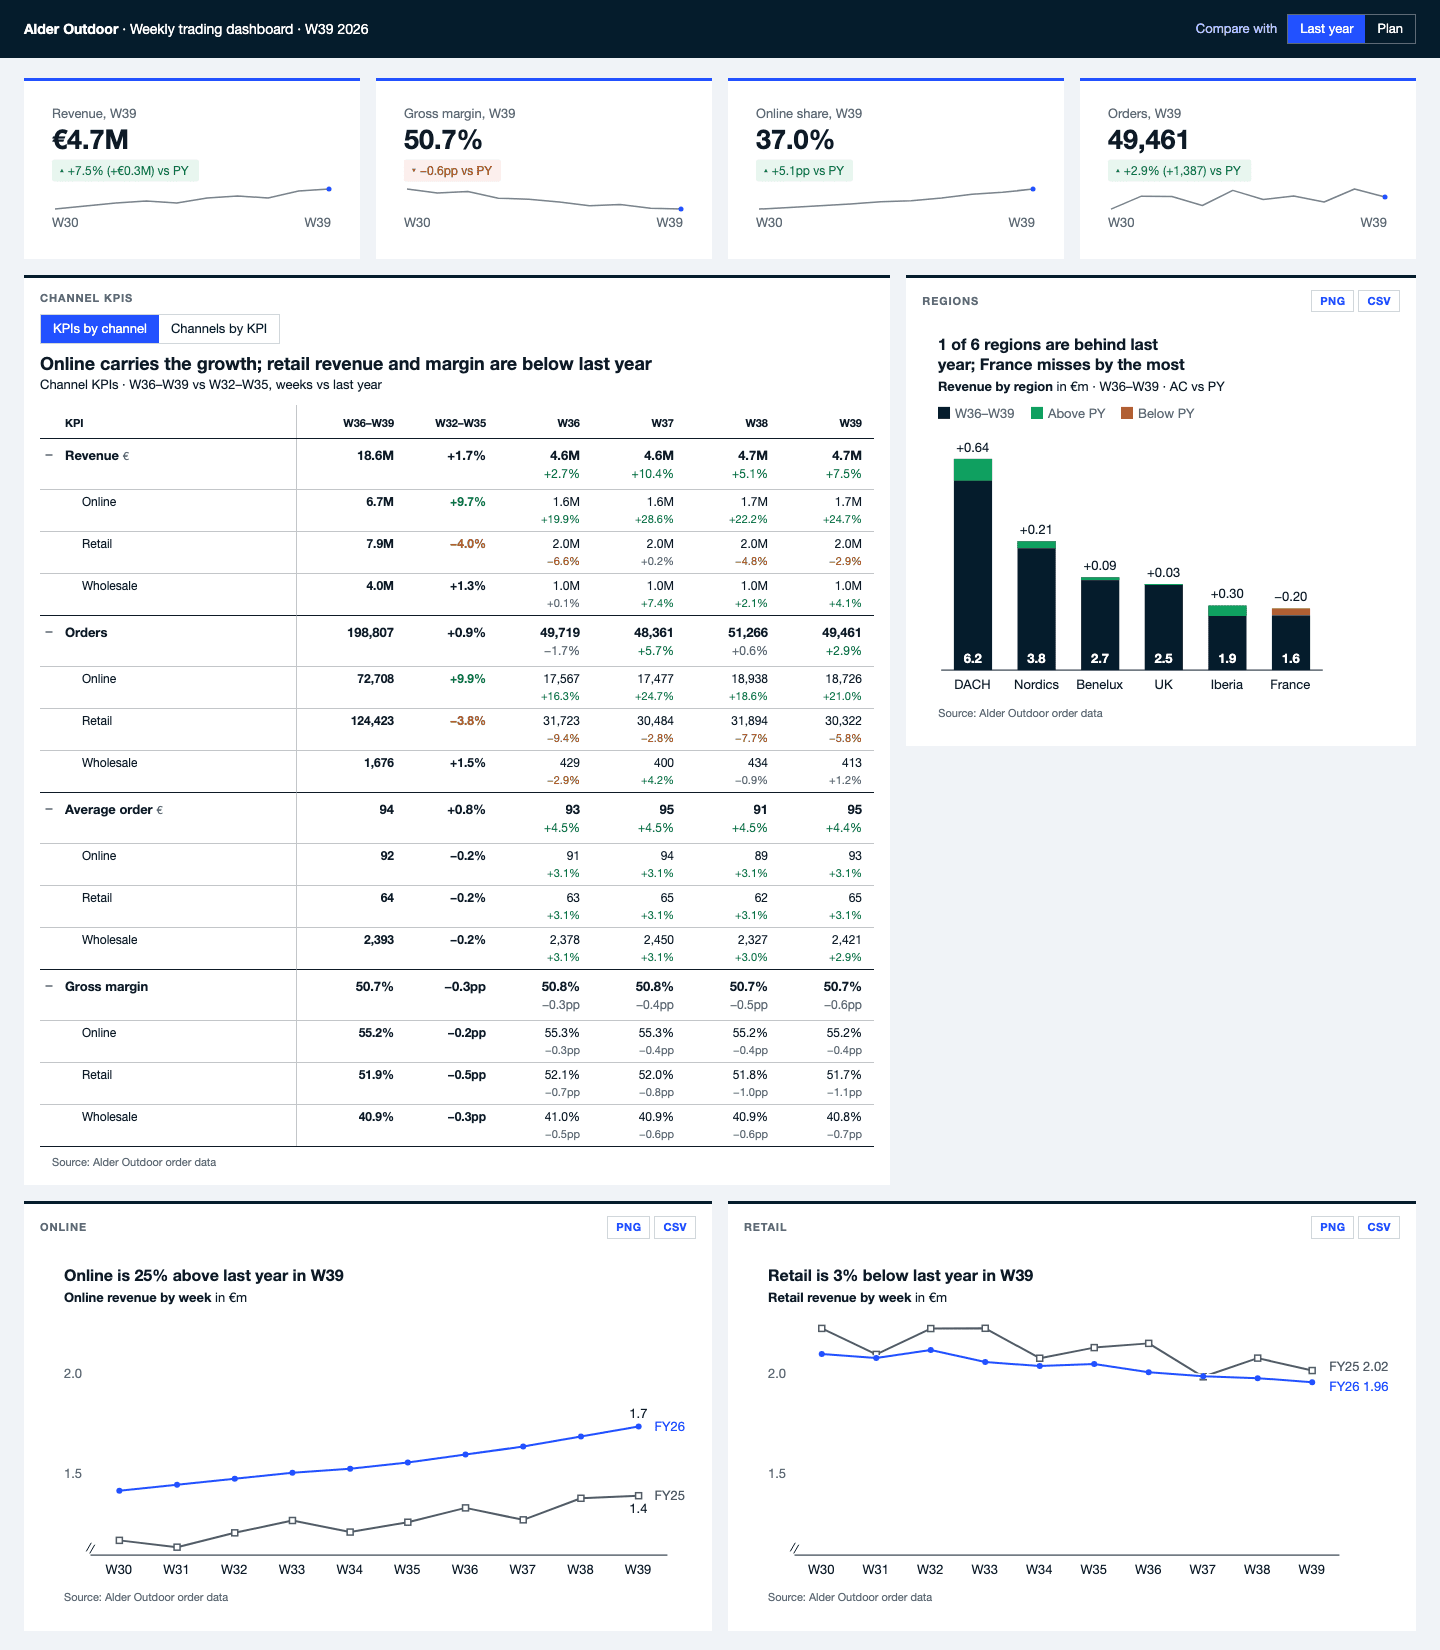
|
|
149
|
+
|
|
150
|
+
## Word or PDF report
|
|
151
|
+
|
|
152
|
+
**You get:** a Word document or PDF with print-quality charts.
|
|
153
|
+
|
|
154
|
+
**Example prompts:**
|
|
155
|
+
|
|
156
|
+
```text
|
|
157
|
+
Write the monthly finance report as a Word document from exports/finance.csv. Draw the charts with Boardplot for print.
|
|
158
|
+
```
|
|
159
|
+
|
|
160
|
+
```text
|
|
161
|
+
Turn this analysis into a PDF report on A4. Use Boardplot for all charts, 300 dpi.
|
|
162
|
+
```
|
|
163
|
+
|
|
164
|
+
**What the agent does:** Boardplot draws the chart images, and the agent's own Word or PDF tool places them in the document. For each chart, the agent calls `boardplot_render` with `target: "print"`, the text column width in mm, for example `options.size: { "width": 160, "unit": "mm" }`, `format: "png"` and `scale: 3.125` for 300 dpi. Word places the PNG at 160 mm.
|
|
165
|
+
|
|
166
|
+
**Tips:**
|
|
167
|
+
|
|
168
|
+
- Give the page format and margins, or the text column width.
|
|
169
|
+
- Ask for the `print` target. A `report` chart in print keeps screen type sizes.
|
|
170
|
+
|
|
171
|
+
**Limits:**
|
|
172
|
+
|
|
173
|
+
- The charts are pictures. Colleagues cannot edit their data in Word.
|
|
174
|
+
- A PNG draws with the fonts installed on the machine that renders.
|
|
175
|
+
|
|
176
|
+
**Worked example:** [docs/examples/word-report](https://github.com/boardplot/boardplot/tree/main/docs/examples/word-report) has a three-page monthly management report, `report.docx`, and its PDF export, `report.pdf`: an executive summary, a P&L table with computed variances, monthly revenue with a forecast range, a price-volume-mix bridge and an EBIT bridge to budget, as print charts at 160 mm and 300 dpi.
|
|
177
|
+
|
|
178
|
+
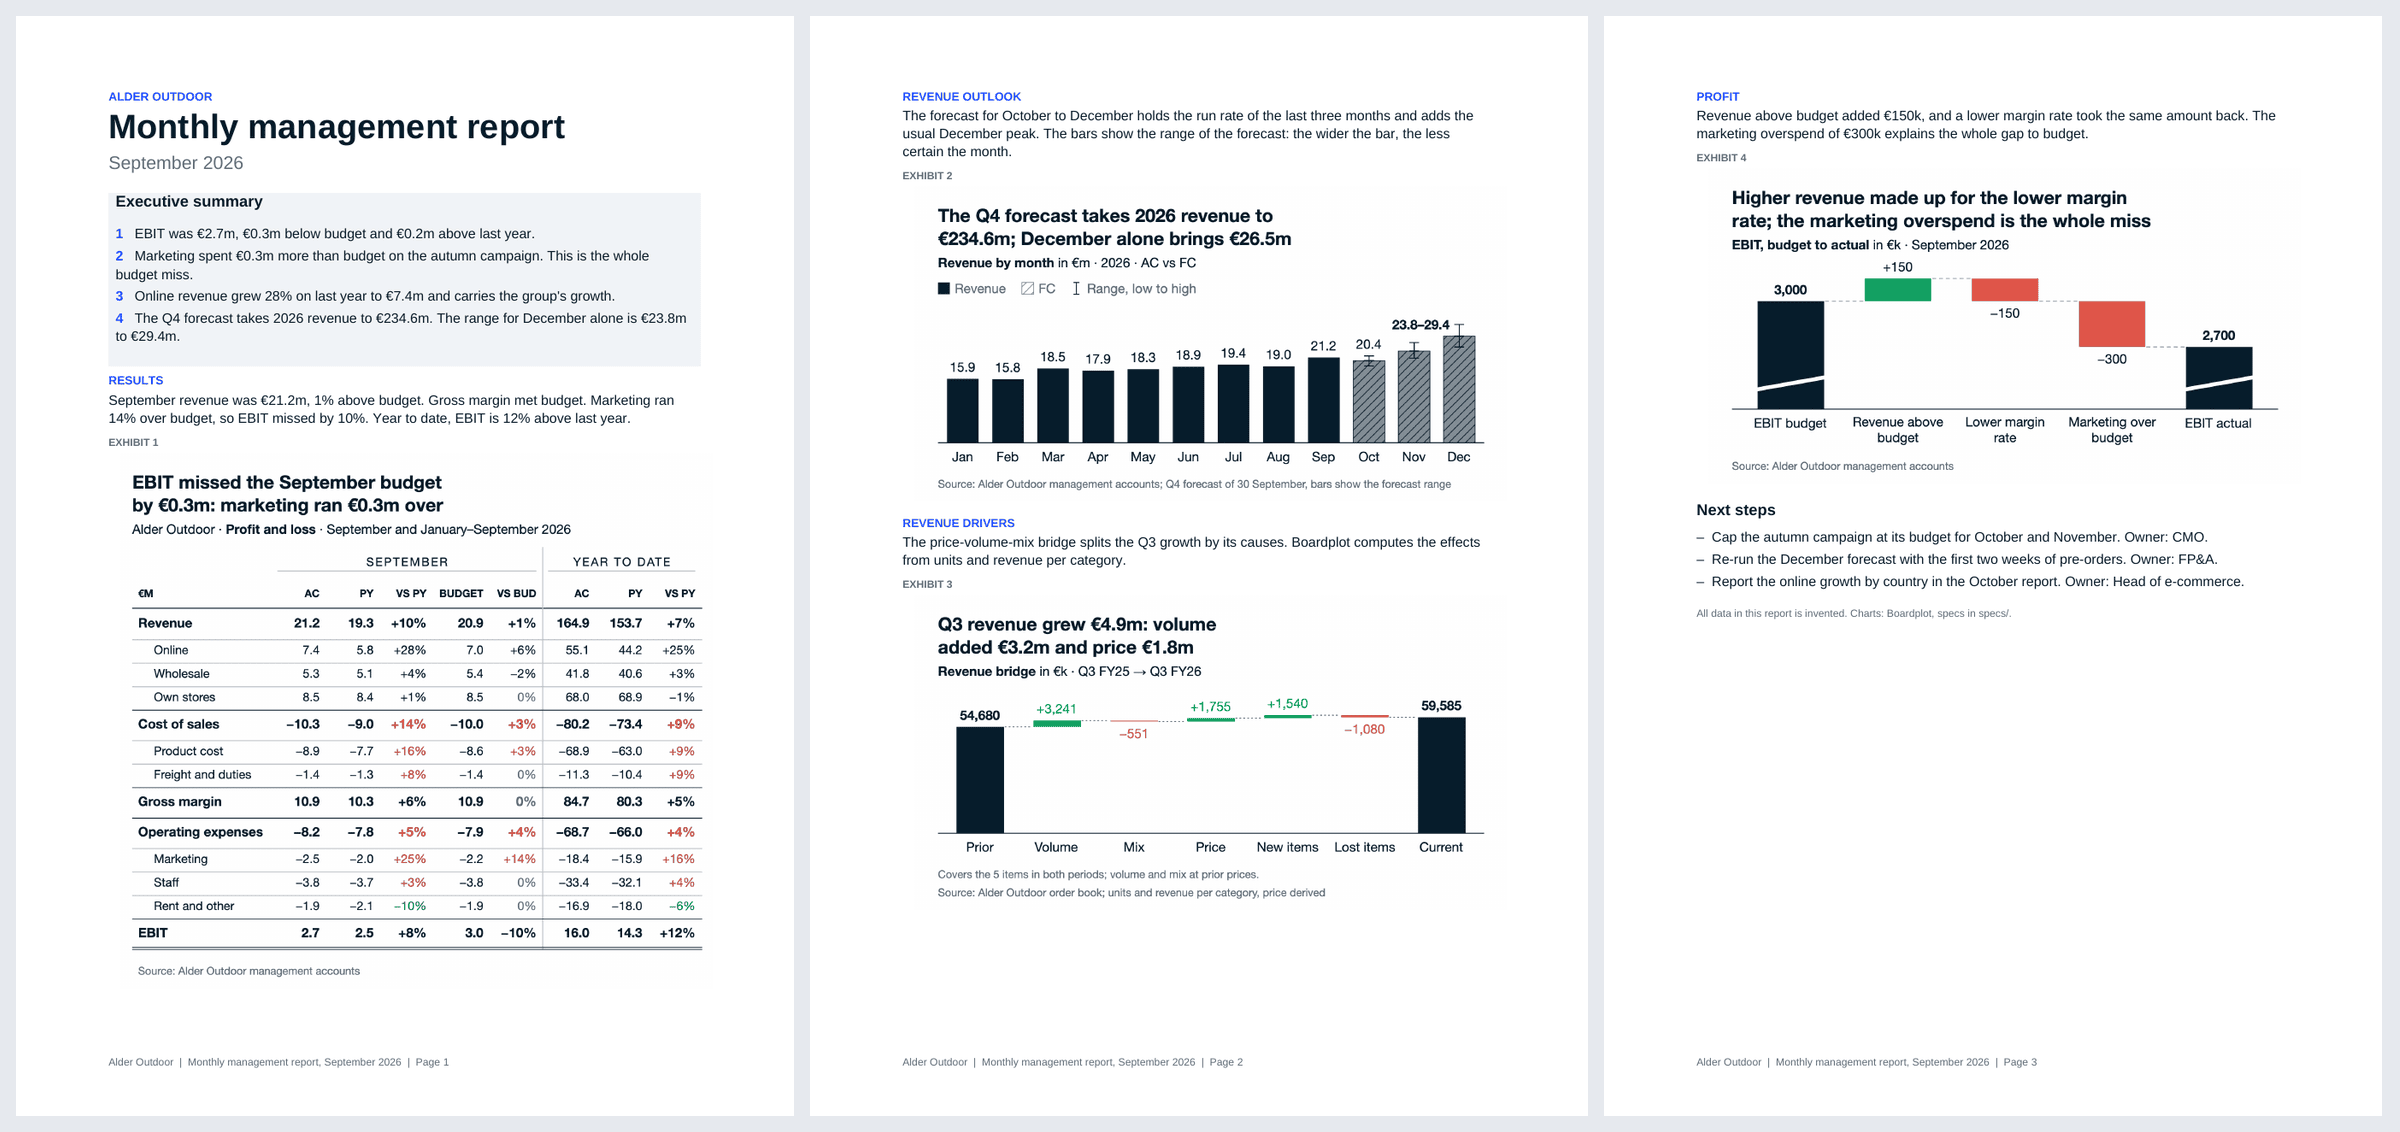
|
|
179
|
+
|
|
180
|
+
## Recurring report
|
|
181
|
+
|
|
182
|
+
**You get:** the same report every week or month, such as a weekly business review, with charts from the latest query export.
|
|
183
|
+
|
|
184
|
+
**Example prompts:**
|
|
185
|
+
|
|
186
|
+
```text
|
|
187
|
+
Every Monday, read exports/orders.csv and write the weekly business review with Boardplot charts. Reuse the chart specs in reports/specs/.
|
|
188
|
+
```
|
|
189
|
+
|
|
190
|
+
```text
|
|
191
|
+
Write a script that renders the charts in reports/specs/ from the latest exports with the Boardplot CLI, so our scheduled job can run it without an agent.
|
|
192
|
+
```
|
|
193
|
+
|
|
194
|
+
**What the agent does:** in the first run, the agent writes one spec per chart and saves it as a template, without data. In each later run, it calls `boardplot_render` with the template, the new export as `rowsFile` and the column names in `columns`. A refused call has `ok: false` and errors with a `path`, a `suggest` sentence and often a `fix`, a JSON Patch the agent applies to the spec. See [Reading errors and warnings](manual.md#reading-errors-and-warnings).
|
|
195
|
+
|
|
196
|
+
A scheduled job needs no agent. It runs the CLI on the same templates:
|
|
197
|
+
|
|
198
|
+
```sh
|
|
199
|
+
boardplot render weekly-orders.json --rows exports/orders.csv \
|
|
200
|
+
--columns category=week,series=channel,value=orders \
|
|
201
|
+
--format png --out "out/$(date +%F)" --quiet
|
|
202
|
+
```
|
|
203
|
+
|
|
204
|
+
It writes `out/<date>/weekly-orders.png`, named after the template's `name`, and prints `{"ok":true,"outputs":[...]}` with the file path. The CLI exits 1 when it refuses the input, for example a renamed column (`missing-column`), and 2 for an internal error. Let the job fail on a non-zero exit.
|
|
205
|
+
|
|
206
|
+
**Tips:**
|
|
207
|
+
|
|
208
|
+
- Keep the templates in the repository. Each run then draws the same charts with new data.
|
|
209
|
+
- Give every template a `name`. It names the output file. Without it each chart writes `chart.png`, and with `--overwrite` the next chart replaces it.
|
|
210
|
+
- Name every series with its label in the template. A series that only the rows name prints its raw id.
|
|
211
|
+
- Write each run to a dated folder, or pass `--overwrite`. A taken file name otherwise gets `-2`.
|
|
212
|
+
|
|
213
|
+
**Limits:**
|
|
214
|
+
|
|
215
|
+
- The MCP server reads `rowsFile` only from its allowed folders: the client's roots, its working directory, the system temp folder and the folders in `BOARDPLOT_ROWS_ROOTS`. Other paths are refused with `rows-outside-roots`.
|
|
216
|
+
- PNG needs `@resvg/resvg-js`, an optional dependency, or Chrome. On a Linux server, install one of the fonts the manual lists, or the render returns only the SVG with the warning `raster-fonts-missing`. See [Getting a chart with MCP](manual.md#getting-a-chart-with-mcp).
|
|
217
|
+
- A CSV with grouping marks in numbers, such as `1.234,5`, is refused. Export plain numbers.
|
|
218
|
+
|
|
219
|
+
**Worked example:** [docs/examples/recurring-report](https://github.com/boardplot/boardplot/tree/main/docs/examples/recurring-report) is a weekly business review. `render.sh`, the CLI script for a scheduled job, draws three templates from three warehouse exports, including a table that computes the week-on-week, year-on-year and plan changes, and writes one page to send.
|
|
220
|
+
|
|
221
|
+
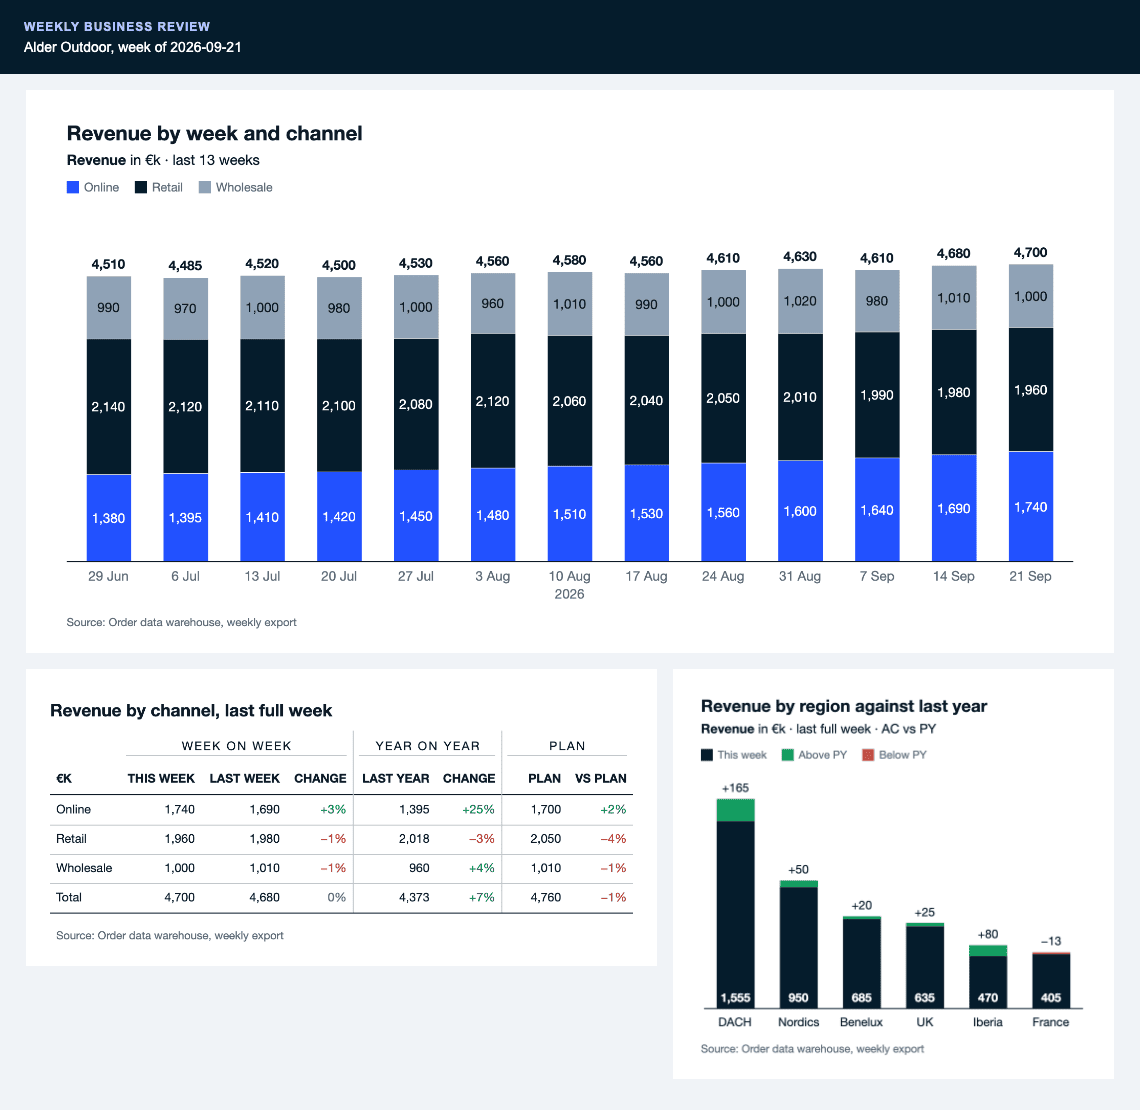
|
package/llms.txt
CHANGED
|
@@ -7,6 +7,7 @@ Every chart is one spec, `{ "type", "data", "options", "annotations", "theme" }`
|
|
|
7
7
|
## Start here
|
|
8
8
|
|
|
9
9
|
- [Manual](docs/manual.md): the spec, the tools, the CLI, React, targets and sizing, errors and themes
|
|
10
|
+
- [Use cases](docs/use-cases.md): example prompts and agent steps for a slide deck, an analysis page, a React dashboard, a Word or PDF report and a recurring report
|
|
10
11
|
|
|
11
12
|
## Chart references
|
|
12
13
|
|
|
@@ -44,7 +45,7 @@ Every chart is one spec, `{ "type", "data", "options", "annotations", "theme" }`
|
|
|
44
45
|
- [box](docs/reference/box.md): Box plots of raw observations; rows category,value[,categoryLabel,date]
|
|
45
46
|
- [waffle](docs/reference/waffle.md): Share of a whole as a grid of cells
|
|
46
47
|
- [pyramid](docs/reference/pyramid.md): Mirrored bands on one scale
|
|
47
|
-
- [diagram](docs/reference/diagram.md): Node and edge diagrams
|
|
48
|
+
- [diagram](docs/reference/diagram.md): Node and edge diagrams, including system architecture
|
|
48
49
|
- [tilemap](docs/reference/tilemap.md): Equal-size region tiles
|
|
49
50
|
- [creative](docs/reference/creative.md): Ad-creative review card (early alpha)
|
|
50
51
|
|
package/package.json
CHANGED
|
@@ -1,6 +1,6 @@
|
|
|
1
1
|
{
|
|
2
2
|
"name": "boardplot",
|
|
3
|
-
"version": "0.
|
|
3
|
+
"version": "0.55.0",
|
|
4
4
|
"description": "Consulting-grade charts for AI agents and React: one JSON spec gives a deterministic SVG, PNG or React chart.",
|
|
5
5
|
"mcpName": "io.github.boardplot/boardplot",
|
|
6
6
|
"type": "module",
|
|
@@ -346,6 +346,7 @@
|
|
|
346
346
|
"docs/manual.md",
|
|
347
347
|
"docs/reference",
|
|
348
348
|
"docs/FONTS.md",
|
|
349
|
+
"docs/use-cases.md",
|
|
349
350
|
"docs/TELEMETRY.md",
|
|
350
351
|
"NOTICE.md",
|
|
351
352
|
"THIRD_PARTY_NOTICES.md",
|
package/dist/chunk-2FNNAPCI.js
DELETED
|
@@ -1,24 +0,0 @@
|
|
|
1
|
-
import {
|
|
2
|
-
sharedKeys10,
|
|
3
|
-
sharedKeys5,
|
|
4
|
-
sharedKeys9
|
|
5
|
-
} from "./chunk-QGCEHR6S.js";
|
|
6
|
-
import {
|
|
7
|
-
optionKeyCheck
|
|
8
|
-
} from "./chunk-H4H4O62O.js";
|
|
9
|
-
import {
|
|
10
|
-
createChartComponent
|
|
11
|
-
} from "./chunk-YG5GUELW.js";
|
|
12
|
-
import {
|
|
13
|
-
slopeCore
|
|
14
|
-
} from "./chunk-5LYXD6ME.js";
|
|
15
|
-
import {
|
|
16
|
-
registeredType
|
|
17
|
-
} from "./chunk-DOFYKPTC.js";
|
|
18
|
-
|
|
19
|
-
// src/react/charts/slope.ts
|
|
20
|
-
var checkOptionKeys = optionKeyCheck({ tree: { target: 0, textScale: 0, textSize: 0, a11y: { title: 0, table: 0 }, mode: 0, belowMinimum: 0, size: { width: 0, height: 0, unit: 0 }, embed: { width: 0 }, margin: { top: 0, right: 0, bottom: 0, left: 0 }, canvas: { margin: { top: 0, right: 0, bottom: 0, left: 0 } }, title: 0, subtitle: { company: 0, measure: 0, period: 0, scenarios: 0 }, unit: 0, unitShown: 0, source: 0, footnotes: 0, notes: { maxListed: 0, placement: 0, maxLines: 0, show: 0, pointer: 0 }, theme: { preset: 0, overrides: 0 }, locale: { language: 0, decimal: 0, thousands: 0, minusGlyph: 0, weekStartsOn: 0 }, strings: sharedKeys10, format: 0, detailFields: { "[]": { key: 0, label: 0, format: 0, unit: 0 } }, smallValues: 0, palette: 0, labelDensity: 0, labels: 0, labelPlacements: 0, legend: { position: 0, order: 0 }, valueAxis: { min: 0, max: 0 }, scaleGroup: { y: 0, id: 0 }, highlight: 0, story: { steps: { "[]": { id: 0, title: 0, body: 0, highlight: 0 } }, step: 0 }, focus: sharedKeys5, hatchStrength: 0, interactive: 0, annotations: sharedKeys9, foldBelowShare: 0, variant: 0, diverging: { labels: { positive: 0, negative: 0 }, sort: 0, net: 0, neutralNote: 0, minBase: 0 } }, labels: ["category", "series"] }), SlopeChart = createChartComponent(registeredType(slopeCore), checkOptionKeys);
|
|
21
|
-
|
|
22
|
-
export {
|
|
23
|
-
SlopeChart
|
|
24
|
-
};
|
package/dist/chunk-2RSG7JYI.js
DELETED
|
@@ -1,24 +0,0 @@
|
|
|
1
|
-
import {
|
|
2
|
-
sharedKeys10,
|
|
3
|
-
sharedKeys5,
|
|
4
|
-
sharedKeys9
|
|
5
|
-
} from "./chunk-QGCEHR6S.js";
|
|
6
|
-
import {
|
|
7
|
-
optionKeyCheck
|
|
8
|
-
} from "./chunk-H4H4O62O.js";
|
|
9
|
-
import {
|
|
10
|
-
createChartComponent
|
|
11
|
-
} from "./chunk-YG5GUELW.js";
|
|
12
|
-
import {
|
|
13
|
-
funnelCore
|
|
14
|
-
} from "./chunk-MBKZYJRC.js";
|
|
15
|
-
import {
|
|
16
|
-
registeredType
|
|
17
|
-
} from "./chunk-DOFYKPTC.js";
|
|
18
|
-
|
|
19
|
-
// src/react/charts/funnel.ts
|
|
20
|
-
var checkOptionKeys = optionKeyCheck({ tree: { target: 0, textScale: 0, textSize: 0, a11y: { title: 0, table: 0 }, mode: 0, belowMinimum: 0, size: { width: 0, height: 0, unit: 0 }, embed: { width: 0 }, margin: { top: 0, right: 0, bottom: 0, left: 0 }, canvas: { margin: { top: 0, right: 0, bottom: 0, left: 0 } }, title: 0, subtitle: { company: 0, measure: 0, period: 0, scenarios: 0 }, unit: 0, unitShown: 0, source: 0, footnotes: 0, notes: { maxListed: 0, placement: 0, maxLines: 0, show: 0, pointer: 0 }, theme: { preset: 0, overrides: 0 }, locale: { language: 0, decimal: 0, thousands: 0, minusGlyph: 0, weekStartsOn: 0 }, strings: sharedKeys10, format: 0, detailFields: { "[]": { key: 0, label: 0, format: 0, unit: 0 } }, smallValues: 0, palette: 0, labelDensity: 0, labels: 0, labelPlacements: 0, legend: { position: 0, order: 0 }, scaleGroup: { y: 0, id: 0 }, bandFraction: 0, highlight: 0, story: { steps: { "[]": { id: 0, title: 0, body: 0, highlight: 0 } }, step: 0 }, focus: sharedKeys5, hatchStrength: 0, interactive: 0, annotations: sharedKeys9, variant: 0, totalCvr: 0, stageShade: 0, worstDropCallout: 0 }, labels: ["category", "segment", "point", "total", "annotation"] }), FunnelChart = createChartComponent(registeredType(funnelCore), checkOptionKeys);
|
|
21
|
-
|
|
22
|
-
export {
|
|
23
|
-
FunnelChart
|
|
24
|
-
};
|
package/dist/chunk-3JEQGGVD.js
DELETED
|
@@ -1,19 +0,0 @@
|
|
|
1
|
-
import {
|
|
2
|
-
optionKeyCheck
|
|
3
|
-
} from "./chunk-H4H4O62O.js";
|
|
4
|
-
import {
|
|
5
|
-
createChartComponent
|
|
6
|
-
} from "./chunk-YG5GUELW.js";
|
|
7
|
-
import {
|
|
8
|
-
creativeCore
|
|
9
|
-
} from "./chunk-KPKXJYQH.js";
|
|
10
|
-
import {
|
|
11
|
-
registeredType
|
|
12
|
-
} from "./chunk-DOFYKPTC.js";
|
|
13
|
-
|
|
14
|
-
// src/react/charts/creative.ts
|
|
15
|
-
var checkOptionKeys = optionKeyCheck({ tree: { target: 0, textScale: 0, textSize: 0, mode: 0, interactive: 0, embed: { width: 0 }, palette: 0, locale: { language: 0, decimal: 0, thousands: 0, minusGlyph: 0, weekStartsOn: 0 }, title: 0, subtitle: { company: 0, measure: 0, period: 0, scenarios: 0 }, source: 0, theme: { preset: 0, overrides: 0 }, size: { width: 0, height: 0, unit: 0 }, notes: { maxListed: 0, placement: 0, maxLines: 0, show: 0, pointer: 0 }, footnotes: 0 } }), CreativeChart = createChartComponent(registeredType(creativeCore), checkOptionKeys);
|
|
16
|
-
|
|
17
|
-
export {
|
|
18
|
-
CreativeChart
|
|
19
|
-
};
|
package/dist/chunk-3XHJHQWU.js
DELETED
|
@@ -1,42 +0,0 @@
|
|
|
1
|
-
import {
|
|
2
|
-
baseOptionsSchema,
|
|
3
|
-
refusedBaseOptions
|
|
4
|
-
} from "./chunk-2V6CLH33.js";
|
|
5
|
-
|
|
6
|
-
// src/core/charts/histogram/schema.ts
|
|
7
|
-
import * as z from "zod";
|
|
8
|
-
var histogramDataSchema = z.object({
|
|
9
|
-
observations: z.array(z.number().finite()).min(4).describe(
|
|
10
|
-
"Raw observations, at least four. Pre-binned counts and edges are rejected: bins the engine cannot recompute cannot be checked. Rows: value."
|
|
11
|
-
)
|
|
12
|
-
}).strict(), histogramOptionsSchema = baseOptionsSchema.safeExtend(refusedBaseOptions("histogram")).safeExtend({
|
|
13
|
-
axisTitles: z.strictObject({
|
|
14
|
-
y: z.string().trim().min(1).optional().describe("Title of the frequency axis, e.g. 'Orders'.")
|
|
15
|
-
}).optional().describe("Title of the frequency axis, drawn in the top row left of the plot while the axis is drawn. When every bin carries its count, the automatic axis gives way and this title leads the base note under the plot. The bin labels carry the measure and its unit."),
|
|
16
|
-
bins: z.union(
|
|
17
|
-
[
|
|
18
|
-
z.literal("auto"),
|
|
19
|
-
z.number().int().positive().max(250),
|
|
20
|
-
z.object({ width: z.number().positive().describe("Authored bin width in observation units; bypasses automatic width selection and snapping."), anchor: z.number().finite().optional().describe("Origin of the regularly spaced bin boundaries.") }).strict()
|
|
21
|
-
],
|
|
22
|
-
{
|
|
23
|
-
// A union reports "Invalid input" and nothing else, which sends an
|
|
24
|
-
// agent that guessed `bins: 'sturges'` straight into a retry loop.
|
|
25
|
-
// The accepted forms are cheaper to print than to guess.
|
|
26
|
-
error: "bins accepts 'auto' (the engine derives and states the rule), a positive integer bin COUNT (max 250), or { width, anchor? }. Named rules such as 'sturges', 'fd', 'scott' or 'rice' are not accepted: the engine picks between Freedman-Diaconis and Sturges itself and prints which one it used."
|
|
27
|
-
}
|
|
28
|
-
).optional().describe(
|
|
29
|
-
"Binning. 'auto' (default) takes the narrower of the Freedman-Diaconis and Sturges widths, then snaps it to a round number. A positive integer is an EXACT bin count: that many equal bins from the smallest to the largest observation, so the width is rarely round. { width } sets the width outright and skips the snap. Named rules such as 'sturges' or 'fd' are not accepted \u2014 the engine states which rule it used on the exhibit."
|
|
30
|
-
),
|
|
31
|
-
binSnap: z.boolean().optional().describe(
|
|
32
|
-
"Snap an 'auto' width onto the {1, 2, 2.5, 5} ladder so bin edges are round numbers. Default true; ignored for an authored count or width."
|
|
33
|
-
),
|
|
34
|
-
methodNote: z.boolean().optional().describe(
|
|
35
|
-
"Default false: the axis caption states the sample base n and the realized bins; without a caption, a method note carries them. true adds the binning rule, width, first edge and interval convention. footnotes: false hides method notes."
|
|
36
|
-
)
|
|
37
|
-
});
|
|
38
|
-
|
|
39
|
-
export {
|
|
40
|
-
histogramDataSchema,
|
|
41
|
-
histogramOptionsSchema
|
|
42
|
-
};
|
package/dist/chunk-4JLBVIGW.js
DELETED
|
@@ -1,24 +0,0 @@
|
|
|
1
|
-
import {
|
|
2
|
-
sharedKeys10,
|
|
3
|
-
sharedKeys5,
|
|
4
|
-
sharedKeys9
|
|
5
|
-
} from "./chunk-QGCEHR6S.js";
|
|
6
|
-
import {
|
|
7
|
-
optionKeyCheck
|
|
8
|
-
} from "./chunk-H4H4O62O.js";
|
|
9
|
-
import {
|
|
10
|
-
createChartComponent
|
|
11
|
-
} from "./chunk-YG5GUELW.js";
|
|
12
|
-
import {
|
|
13
|
-
pyramidCore
|
|
14
|
-
} from "./chunk-SPTPFY4S.js";
|
|
15
|
-
import {
|
|
16
|
-
registeredType
|
|
17
|
-
} from "./chunk-DOFYKPTC.js";
|
|
18
|
-
|
|
19
|
-
// src/react/charts/pyramid.ts
|
|
20
|
-
var checkOptionKeys = optionKeyCheck({ tree: { target: 0, textScale: 0, textSize: 0, a11y: { title: 0, table: 0 }, mode: 0, belowMinimum: 0, size: { width: 0, height: 0, unit: 0 }, embed: { width: 0 }, margin: { top: 0, right: 0, bottom: 0, left: 0 }, canvas: { margin: { top: 0, right: 0, bottom: 0, left: 0 } }, title: 0, subtitle: { company: 0, measure: 0, period: 0, scenarios: 0 }, unit: 0, unitShown: 0, source: 0, footnotes: 0, notes: { maxListed: 0, placement: 0, maxLines: 0, show: 0, pointer: 0 }, theme: { preset: 0, overrides: 0 }, locale: { language: 0, decimal: 0, thousands: 0, minusGlyph: 0, weekStartsOn: 0 }, strings: sharedKeys10, format: 0, smallValues: 0, palette: 0, labelDensity: 0, labels: 0, labelPlacements: 0, legend: { position: 0, order: 0 }, scaleGroup: { y: 0, id: 0 }, bandFraction: 0, highlight: 0, story: { steps: { "[]": { id: 0, title: 0, body: 0, highlight: 0 } }, step: 0 }, focus: sharedKeys5, interactive: 0, annotations: sharedKeys9, basis: 0, methodNote: 0 }, labels: ["category", "series", "point"] }), PyramidChart = createChartComponent(registeredType(pyramidCore), checkOptionKeys);
|
|
21
|
-
|
|
22
|
-
export {
|
|
23
|
-
PyramidChart
|
|
24
|
-
};
|
package/dist/chunk-6KWIQ5KF.js
DELETED
|
@@ -1,18 +0,0 @@
|
|
|
1
|
-
// src/core/stackAdds.ts
|
|
2
|
-
var NON_ADDITIVE = /%|\b(?:share|margin|rate)\b|\bper\s+/i, PERCENT = /%|\bpercent\b|^\s*pp\s*$/i;
|
|
3
|
-
function statedInPercent(label, unit, pctCells = !1) {
|
|
4
|
-
return pctCells || PERCENT.test(label) || PERCENT.test(unit) || unit === "" && NON_ADDITIVE.test(label);
|
|
5
|
-
}
|
|
6
|
-
function stackAdds(parts, chartUnit, sharesOfOneWhole) {
|
|
7
|
-
return parts.length <= 1 || sharesOfOneWhole === !0 || !parts.some((part) => statedInPercent(part.label, part.unit ?? chartUnit ?? "", part.pctCells));
|
|
8
|
-
}
|
|
9
|
-
var NO_STACK_TOTAL = "the stack has no total: its parts are percents of different wholes", NO_STACK_MEAN = "the stack has no sums to average: its parts are percents of different wholes", VALUELESS_ANCHOR_FIX = "anchor it on one series ({ categoryId, seriesId }), or set sharesOfOneWhole when every series is a share of the same whole", SHARES_OF_ONE_WHOLE_FIX = "set sharesOfOneWhole: true when every series is a share of the same whole, or scope it to one series";
|
|
10
|
-
|
|
11
|
-
export {
|
|
12
|
-
statedInPercent,
|
|
13
|
-
stackAdds,
|
|
14
|
-
NO_STACK_TOTAL,
|
|
15
|
-
NO_STACK_MEAN,
|
|
16
|
-
VALUELESS_ANCHOR_FIX,
|
|
17
|
-
SHARES_OF_ONE_WHOLE_FIX
|
|
18
|
-
};
|