adonisjs-server-stats 1.3.2 → 1.5.1
This diff represents the content of publicly available package versions that have been released to one of the supported registries. The information contained in this diff is provided for informational purposes only and reflects changes between package versions as they appear in their respective public registries.
- package/README.md +114 -116
- package/dist/configure.d.ts.map +1 -1
- package/dist/src/controller/debug_controller.d.ts +2 -2
- package/dist/src/controller/debug_controller.d.ts.map +1 -1
- package/dist/src/controller/server_stats_controller.d.ts +1 -1
- package/dist/src/controller/server_stats_controller.d.ts.map +1 -1
- package/dist/src/dashboard/chart_aggregator.d.ts.map +1 -1
- package/dist/src/dashboard/chart_aggregator.js +8 -8
- package/dist/src/dashboard/dashboard_controller.d.ts +12 -97
- package/dist/src/dashboard/dashboard_controller.d.ts.map +1 -1
- package/dist/src/dashboard/dashboard_controller.js +258 -489
- package/dist/src/dashboard/dashboard_routes.d.ts.map +1 -1
- package/dist/src/dashboard/dashboard_routes.js +7 -2
- package/dist/src/dashboard/dashboard_store.d.ts +39 -3
- package/dist/src/dashboard/dashboard_store.d.ts.map +1 -1
- package/dist/src/dashboard/dashboard_store.js +145 -78
- package/dist/src/dashboard/integrations/cache_inspector.d.ts.map +1 -1
- package/dist/src/dashboard/integrations/queue_inspector.d.ts.map +1 -1
- package/dist/src/dashboard/migrator.d.ts.map +1 -1
- package/dist/src/dashboard/migrator.js +3 -1
- package/dist/src/dashboard/models/stats_event.d.ts +1 -1
- package/dist/src/dashboard/models/stats_event.d.ts.map +1 -1
- package/dist/src/dashboard/models/stats_query.d.ts +1 -1
- package/dist/src/dashboard/models/stats_query.d.ts.map +1 -1
- package/dist/src/dashboard/models/stats_request.d.ts +2 -2
- package/dist/src/dashboard/models/stats_request.d.ts.map +1 -1
- package/dist/src/dashboard/models/stats_request.js +1 -1
- package/dist/src/dashboard/models/stats_trace.d.ts +1 -1
- package/dist/src/dashboard/models/stats_trace.d.ts.map +1 -1
- package/dist/src/debug/debug_store.d.ts +6 -6
- package/dist/src/debug/debug_store.d.ts.map +1 -1
- package/dist/src/debug/debug_store.js +10 -10
- package/dist/src/debug/email_collector.d.ts +0 -9
- package/dist/src/debug/email_collector.d.ts.map +1 -1
- package/dist/src/debug/email_collector.js +6 -28
- package/dist/src/debug/event_collector.d.ts +1 -1
- package/dist/src/debug/event_collector.d.ts.map +1 -1
- package/dist/src/debug/event_collector.js +17 -17
- package/dist/src/debug/query_collector.d.ts +1 -1
- package/dist/src/debug/query_collector.d.ts.map +1 -1
- package/dist/src/debug/query_collector.js +13 -14
- package/dist/src/debug/ring_buffer.d.ts.map +1 -1
- package/dist/src/debug/route_inspector.d.ts +1 -1
- package/dist/src/debug/route_inspector.d.ts.map +1 -1
- package/dist/src/debug/route_inspector.js +12 -12
- package/dist/src/debug/trace_collector.d.ts.map +1 -1
- package/dist/src/debug/trace_collector.js +6 -5
- package/dist/src/edge/client/dashboard.css +555 -165
- package/dist/src/edge/client/dashboard.js +2797 -1556
- package/dist/src/edge/client/debug-panel.css +476 -133
- package/dist/src/edge/client/debug-panel.js +1496 -1043
- package/dist/src/edge/client/stats-bar.css +64 -30
- package/dist/src/edge/client/stats-bar.js +598 -319
- package/dist/src/edge/plugin.d.ts +1 -1
- package/dist/src/edge/plugin.d.ts.map +1 -1
- package/dist/src/edge/plugin.js +41 -59
- package/dist/src/edge/views/stats-bar.edge +1 -1
- package/dist/src/index.d.ts +1 -1
- package/dist/src/index.d.ts.map +1 -1
- package/dist/src/middleware/request_tracking_middleware.d.ts +4 -4
- package/dist/src/middleware/request_tracking_middleware.d.ts.map +1 -1
- package/dist/src/middleware/request_tracking_middleware.js +7 -6
- package/dist/src/prometheus/prometheus_collector.d.ts +1 -1
- package/dist/src/prometheus/prometheus_collector.d.ts.map +1 -1
- package/dist/src/provider/server_stats_provider.d.ts +1 -1
- package/dist/src/provider/server_stats_provider.d.ts.map +1 -1
- package/dist/src/provider/server_stats_provider.js +31 -31
- package/dist/src/utils/json_helpers.d.ts +8 -0
- package/dist/src/utils/json_helpers.d.ts.map +1 -0
- package/dist/src/utils/json_helpers.js +21 -0
- package/dist/src/utils/mail_helpers.d.ts +13 -0
- package/dist/src/utils/mail_helpers.d.ts.map +1 -0
- package/dist/src/utils/mail_helpers.js +26 -0
- package/dist/src/utils/math_helpers.d.ts +8 -0
- package/dist/src/utils/math_helpers.d.ts.map +1 -0
- package/dist/src/utils/math_helpers.js +11 -0
- package/dist/src/utils/time_helpers.d.ts +12 -0
- package/dist/src/utils/time_helpers.d.ts.map +1 -0
- package/dist/src/utils/time_helpers.js +32 -0
- package/dist/src/utils/transmit_client.d.ts +9 -0
- package/dist/src/utils/transmit_client.d.ts.map +1 -0
- package/dist/src/utils/transmit_client.js +20 -0
- package/package.json +35 -29
package/README.md
CHANGED
|
@@ -19,16 +19,16 @@ Zero frontend dependencies. Zero build step. Just `@serverStats()` and go.
|
|
|
19
19
|
|
|
20
20
|
**Debug toolbar** -- expandable panels for deep inspection:
|
|
21
21
|
|
|
22
|
-
| Queries
|
|
23
|
-
|
|
22
|
+
| Queries | Events |
|
|
23
|
+
| ------------------------------------------------------------------------------------------------------------------------------------------------------------------------ | ------------------------------------------------------------------------------------------------------------------------------------------------------------------ |
|
|
24
24
|
| 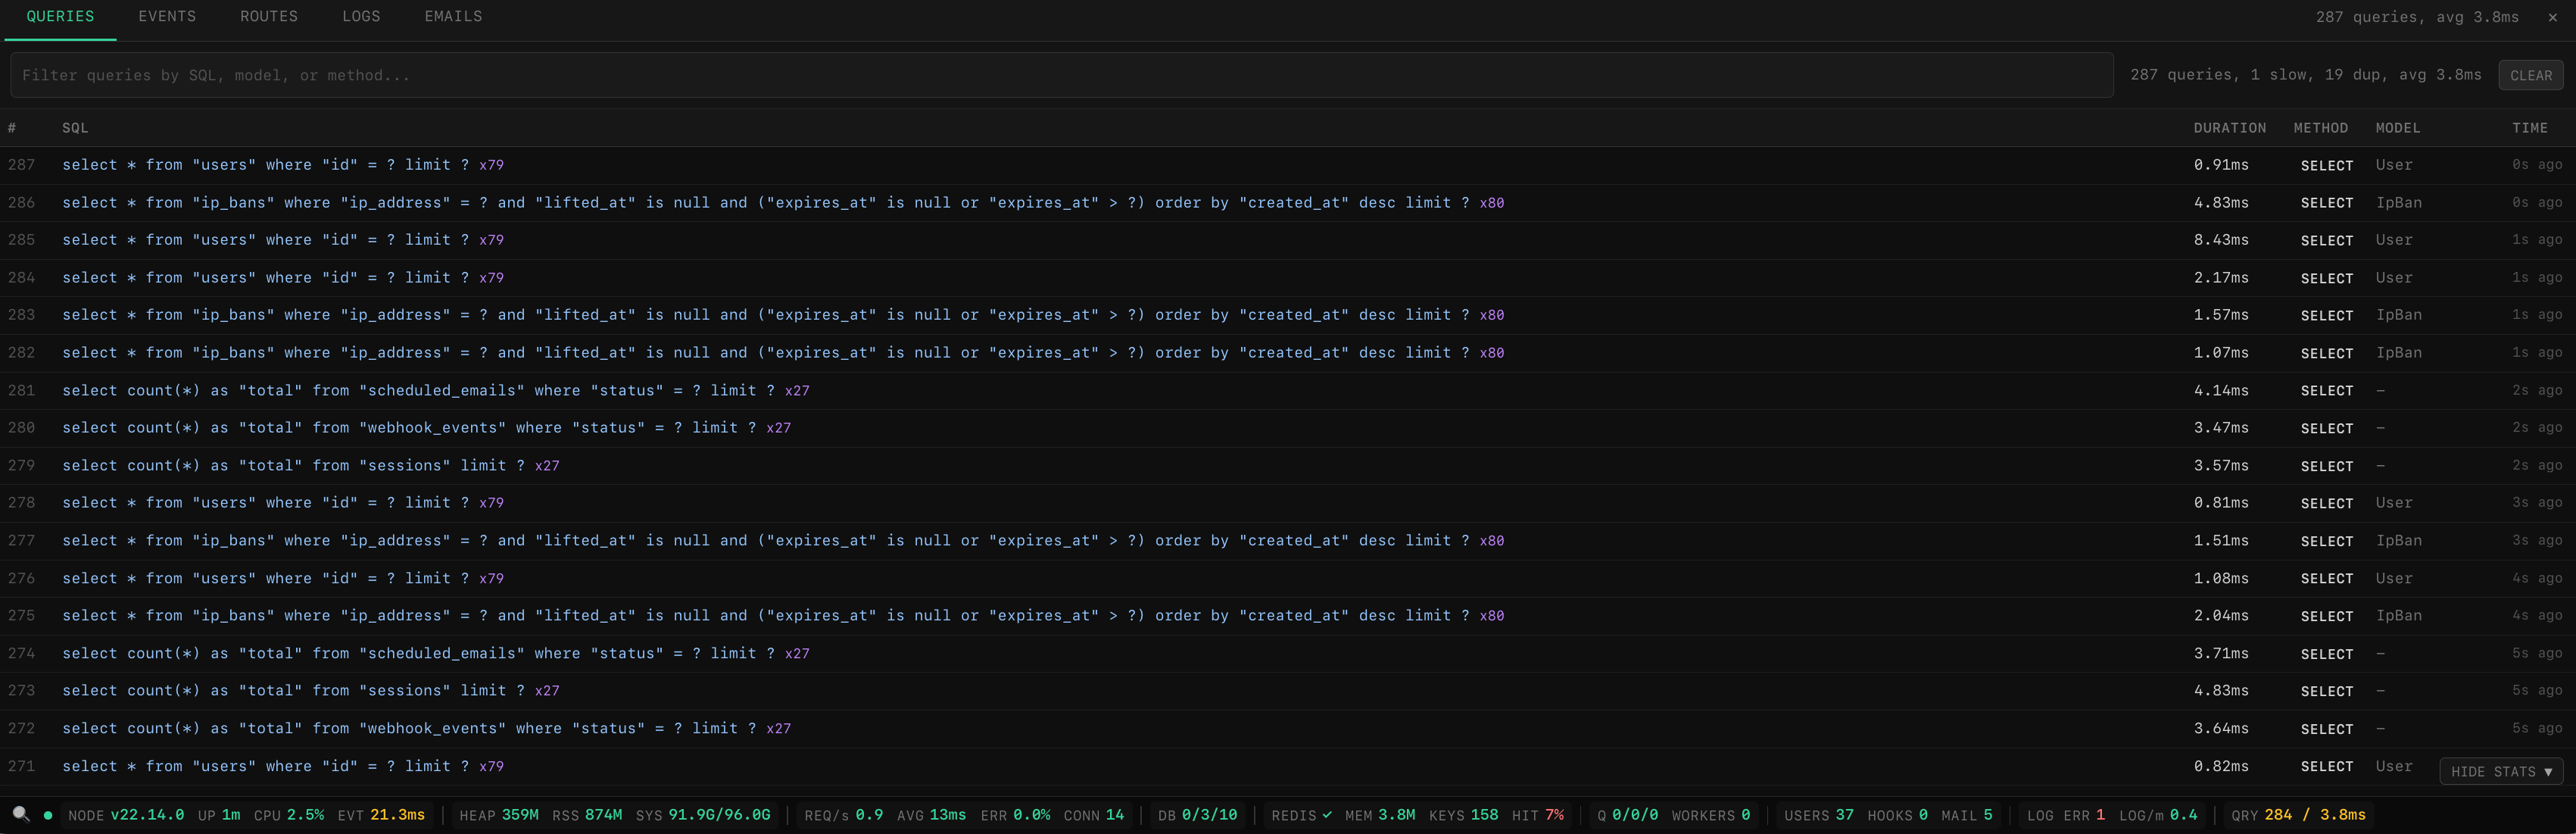 | 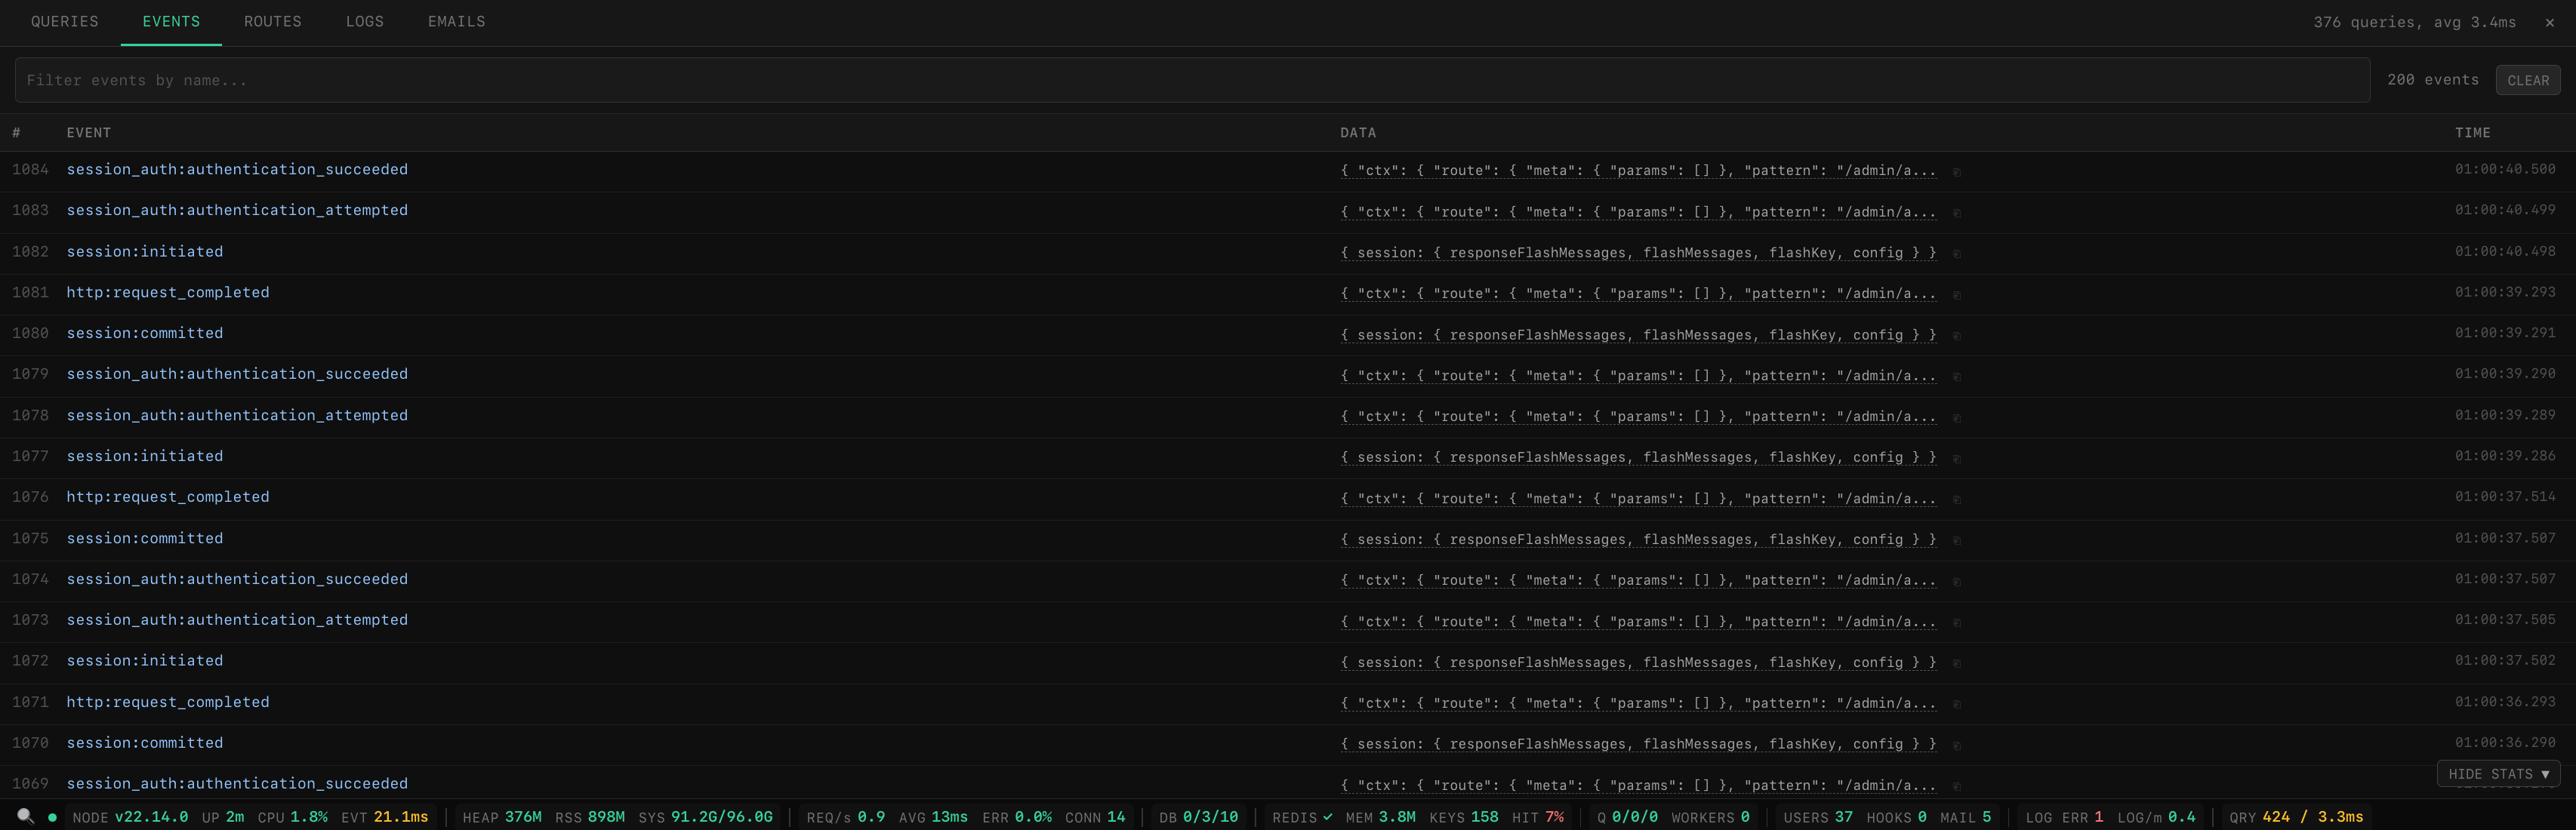 |
|
|
25
25
|
|
|
26
|
-
| Routes
|
|
27
|
-
|
|
26
|
+
| Routes | Logs |
|
|
27
|
+
| ----------------------------------------------------------------------------------------------------------------------------------------------------------------- | ----------------------------------------------------------------------------------------------------------------------------------------------------------------- |
|
|
28
28
|
| 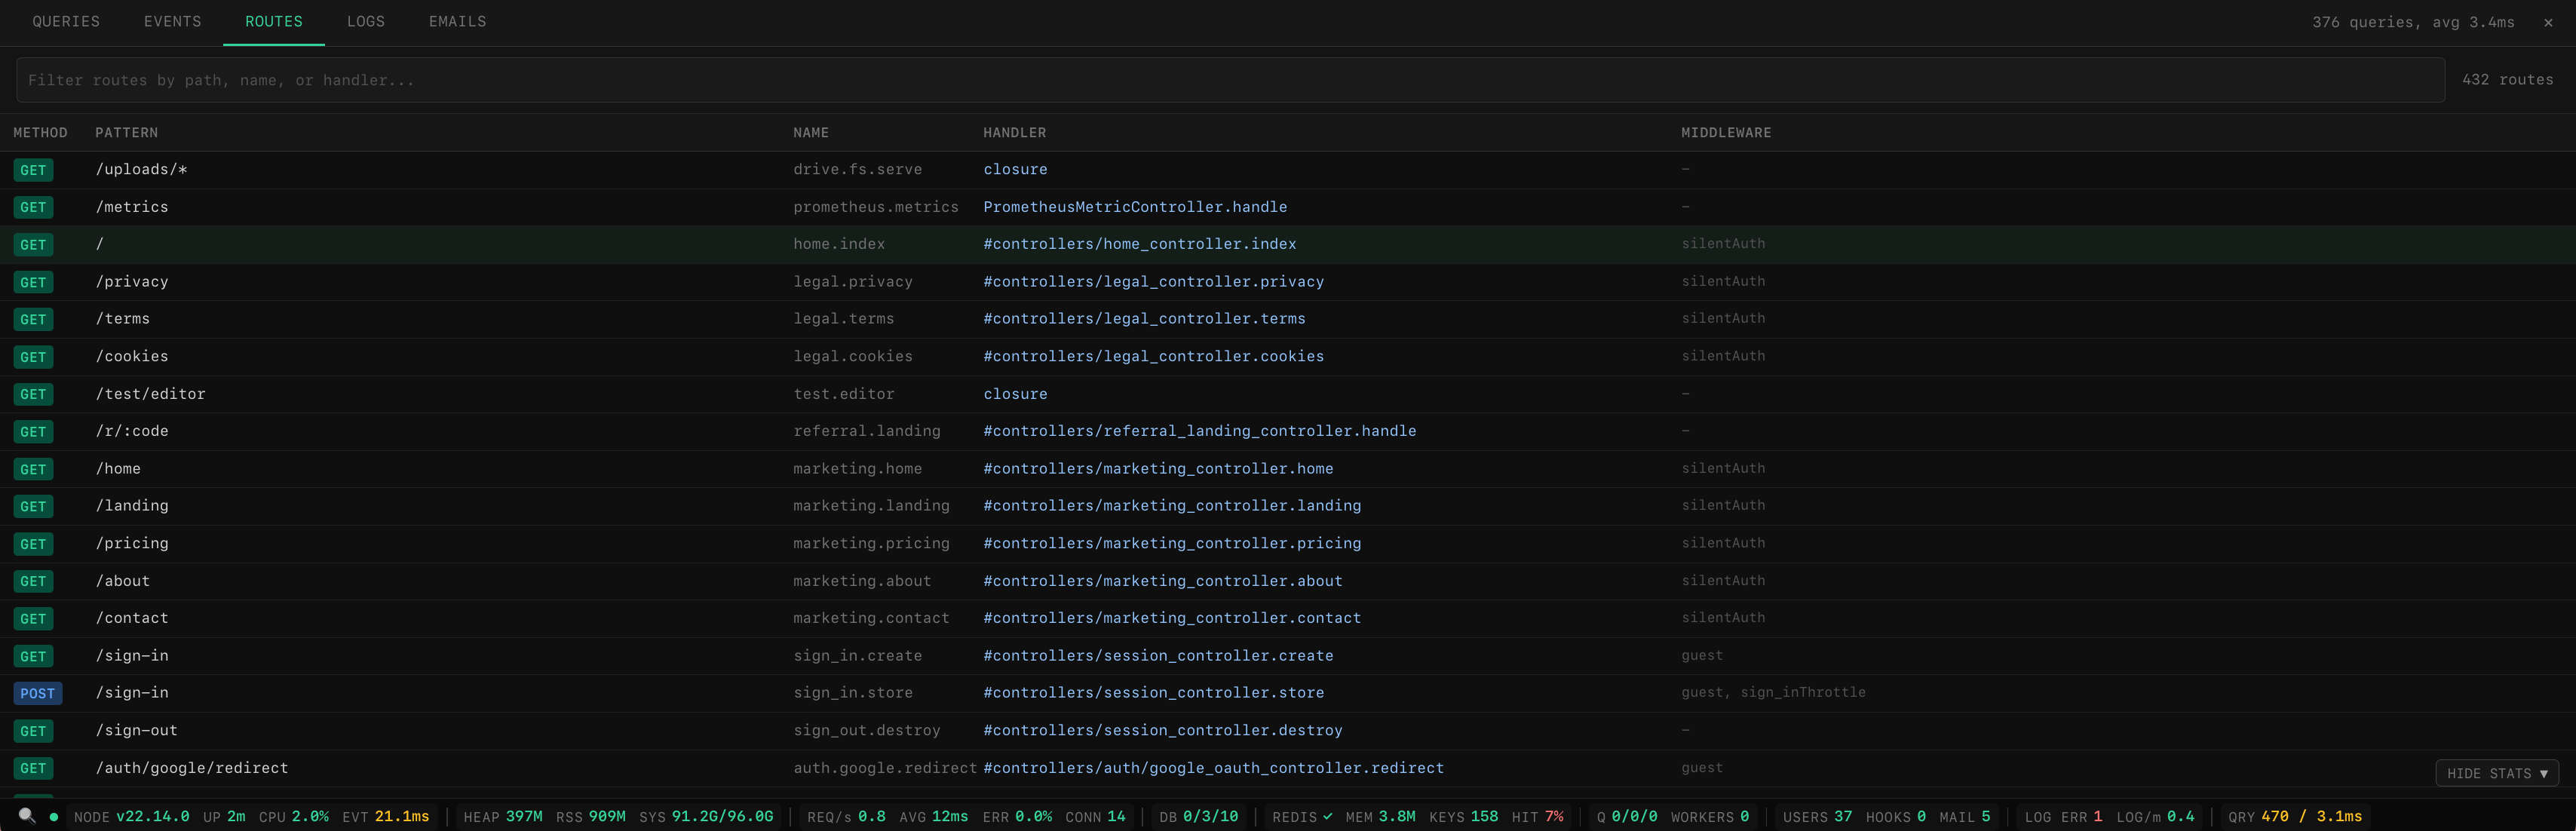 | 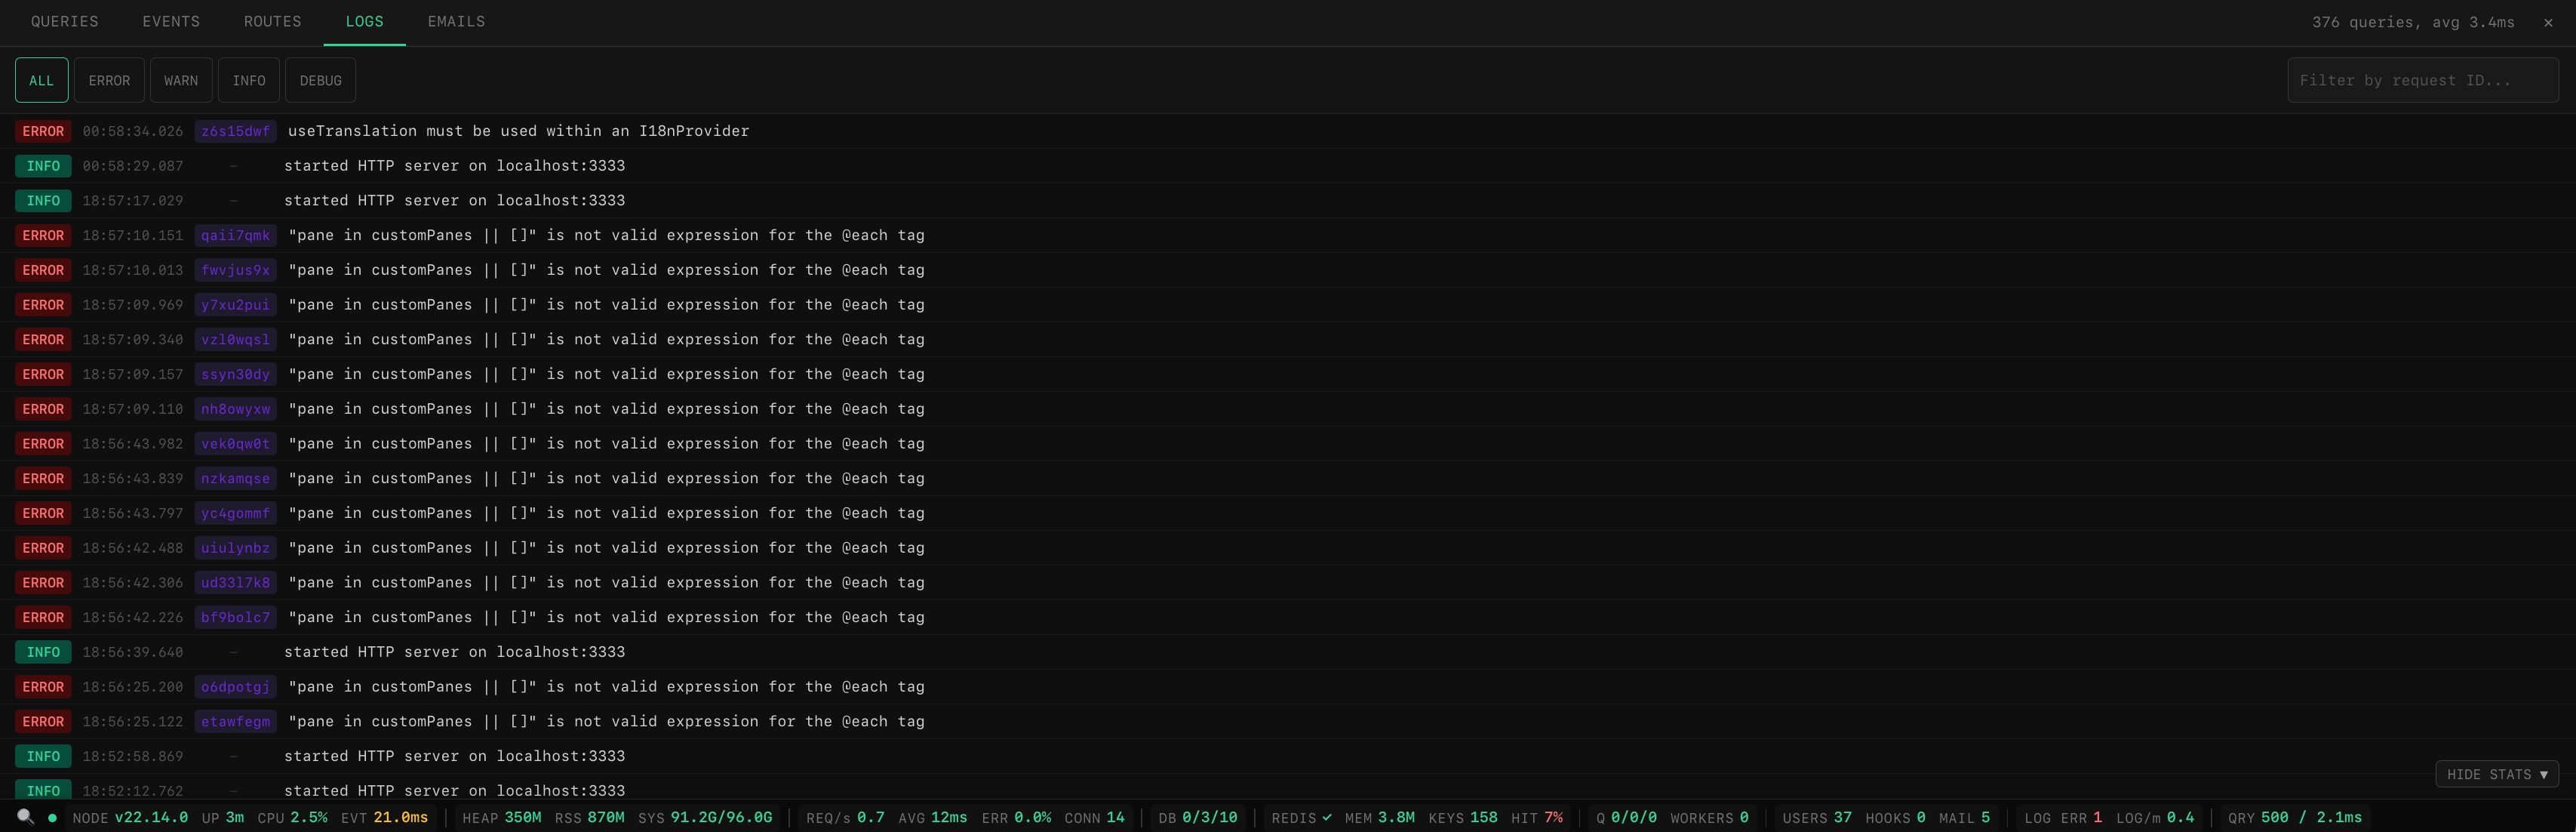 |
|
|
29
29
|
|
|
30
|
-
| Emails (custom pane)
|
|
31
|
-
|
|
30
|
+
| Emails (custom pane) |
|
|
31
|
+
| -------------------------------------------------------------------------------------------------------------------------------------------------------------- |
|
|
32
32
|
|  |
|
|
33
33
|
|
|
34
34
|
## Features
|
|
@@ -74,9 +74,7 @@ providers: [
|
|
|
74
74
|
|
|
75
75
|
```ts
|
|
76
76
|
// start/kernel.ts
|
|
77
|
-
server.use([
|
|
78
|
-
() => import('adonisjs-server-stats/middleware'),
|
|
79
|
-
])
|
|
77
|
+
server.use([() => import('adonisjs-server-stats/middleware')])
|
|
80
78
|
```
|
|
81
79
|
|
|
82
80
|
### 3. Create config
|
|
@@ -87,11 +85,7 @@ import { defineConfig } from 'adonisjs-server-stats'
|
|
|
87
85
|
import { processCollector, systemCollector, httpCollector } from 'adonisjs-server-stats/collectors'
|
|
88
86
|
|
|
89
87
|
export default defineConfig({
|
|
90
|
-
collectors: [
|
|
91
|
-
processCollector(),
|
|
92
|
-
systemCollector(),
|
|
93
|
-
httpCollector(),
|
|
94
|
-
],
|
|
88
|
+
collectors: [processCollector(), systemCollector(), httpCollector()],
|
|
95
89
|
})
|
|
96
90
|
```
|
|
97
91
|
|
|
@@ -184,7 +178,7 @@ import type { StatsEngine } from 'adonisjs-server-stats'
|
|
|
184
178
|
|
|
185
179
|
export default class ServerStatsController {
|
|
186
180
|
async index({ response }: HttpContext) {
|
|
187
|
-
const engine = await app.container.make('server_stats.engine') as StatsEngine
|
|
181
|
+
const engine = (await app.container.make('server_stats.engine')) as StatsEngine
|
|
188
182
|
return response.json(engine.getLatestStats())
|
|
189
183
|
}
|
|
190
184
|
}
|
|
@@ -204,36 +198,36 @@ export default class ServerStatsController {
|
|
|
204
198
|
|
|
205
199
|
### `ServerStatsConfig`
|
|
206
200
|
|
|
207
|
-
| Option | Type | Default | Description
|
|
208
|
-
|
|
209
|
-
| `intervalMs` | `number` | `3000` | Collection + broadcast interval (ms)
|
|
210
|
-
| `transport` | `'transmit' \| 'none'` | `'transmit'` | SSE transport. `'none'` = poll-only.
|
|
211
|
-
| `channelName` | `string` | `'admin/server-stats'` | Transmit channel name
|
|
212
|
-
| `endpoint` | `string \| false` | `'/admin/api/server-stats'` | HTTP endpoint. `false` to disable.
|
|
213
|
-
| `collectors` | `MetricCollector[]` | `[]` | Array of collector instances
|
|
214
|
-
| `skipInTest` | `boolean` | `true` | Skip collection during tests
|
|
215
|
-
| `onStats` | `(stats) => void` | -- | Callback after each collection tick
|
|
216
|
-
| `shouldShow` | `(ctx) => boolean` | -- | Per-request visibility guard
|
|
217
|
-
| `devToolbar` | `DevToolbarOptions` | -- | Dev toolbar configuration
|
|
201
|
+
| Option | Type | Default | Description |
|
|
202
|
+
| ------------- | ---------------------- | --------------------------- | ------------------------------------ |
|
|
203
|
+
| `intervalMs` | `number` | `3000` | Collection + broadcast interval (ms) |
|
|
204
|
+
| `transport` | `'transmit' \| 'none'` | `'transmit'` | SSE transport. `'none'` = poll-only. |
|
|
205
|
+
| `channelName` | `string` | `'admin/server-stats'` | Transmit channel name |
|
|
206
|
+
| `endpoint` | `string \| false` | `'/admin/api/server-stats'` | HTTP endpoint. `false` to disable. |
|
|
207
|
+
| `collectors` | `MetricCollector[]` | `[]` | Array of collector instances |
|
|
208
|
+
| `skipInTest` | `boolean` | `true` | Skip collection during tests |
|
|
209
|
+
| `onStats` | `(stats) => void` | -- | Callback after each collection tick |
|
|
210
|
+
| `shouldShow` | `(ctx) => boolean` | -- | Per-request visibility guard |
|
|
211
|
+
| `devToolbar` | `DevToolbarOptions` | -- | Dev toolbar configuration |
|
|
218
212
|
|
|
219
213
|
### `DevToolbarOptions`
|
|
220
214
|
|
|
221
|
-
| Option | Type
|
|
222
|
-
|
|
223
|
-
| `enabled` | `boolean`
|
|
224
|
-
| `maxQueries` | `number`
|
|
225
|
-
| `maxEvents` | `number`
|
|
226
|
-
| `maxEmails` | `number`
|
|
227
|
-
| `slowQueryThresholdMs` | `number`
|
|
228
|
-
| `persistDebugData` | `boolean \| string` | `false`
|
|
229
|
-
| `tracing` | `boolean`
|
|
230
|
-
| `maxTraces` | `number`
|
|
231
|
-
| `dashboard` | `boolean`
|
|
232
|
-
| `dashboardPath` | `string`
|
|
233
|
-
| `retentionDays` | `number`
|
|
234
|
-
| `dbPath` | `string`
|
|
235
|
-
| `excludeFromTracing` | `string[]`
|
|
236
|
-
| `panes` | `DebugPane[]`
|
|
215
|
+
| Option | Type | Default | Description |
|
|
216
|
+
| ---------------------- | ------------------- | -------------------------------------------- | ------------------------------------------------------------------------------------------------------------------------------------------------------------------------------------------------------------ |
|
|
217
|
+
| `enabled` | `boolean` | `false` | Enable the dev toolbar |
|
|
218
|
+
| `maxQueries` | `number` | `500` | Max SQL queries to buffer |
|
|
219
|
+
| `maxEvents` | `number` | `200` | Max events to buffer |
|
|
220
|
+
| `maxEmails` | `number` | `100` | Max emails to buffer |
|
|
221
|
+
| `slowQueryThresholdMs` | `number` | `100` | Slow query threshold (ms) |
|
|
222
|
+
| `persistDebugData` | `boolean \| string` | `false` | Persist debug data to disk across restarts. `true` writes to `.adonisjs/server-stats/debug-data.json`, or pass a custom path. |
|
|
223
|
+
| `tracing` | `boolean` | `false` | Enable per-request tracing with timeline visualization |
|
|
224
|
+
| `maxTraces` | `number` | `200` | Max request traces to buffer |
|
|
225
|
+
| `dashboard` | `boolean` | `false` | Enable the full-page dashboard (requires `better-sqlite3`) |
|
|
226
|
+
| `dashboardPath` | `string` | `'/__stats'` | URL path for the dashboard page |
|
|
227
|
+
| `retentionDays` | `number` | `7` | Days to keep historical data in SQLite |
|
|
228
|
+
| `dbPath` | `string` | `'.adonisjs/server-stats/dashboard.sqlite3'` | Path to the SQLite database file (relative to app root) |
|
|
229
|
+
| `excludeFromTracing` | `string[]` | `[]` | URL prefixes to exclude from tracing and dashboard persistence. Requests still count toward HTTP metrics but won't appear in the timeline or be stored. The stats endpoint is always excluded automatically. |
|
|
230
|
+
| `panes` | `DebugPane[]` | -- | Custom debug panel tabs |
|
|
237
231
|
|
|
238
232
|
---
|
|
239
233
|
|
|
@@ -243,27 +237,27 @@ Each collector is a factory function that returns a `MetricCollector`. All colle
|
|
|
243
237
|
|
|
244
238
|
### Built-in Collectors
|
|
245
239
|
|
|
246
|
-
| Collector | Metrics
|
|
247
|
-
|
|
248
|
-
| `processCollector()` | CPU %, event loop lag, heap/RSS memory, uptime, Node version
|
|
249
|
-
| `systemCollector()` | OS load averages, system memory, system uptime
|
|
250
|
-
| `httpCollector(opts?)` | Requests/sec, avg response time, error rate, active connections | optional
|
|
251
|
-
| `dbPoolCollector(opts?)` | Pool used/free/pending/max connections
|
|
252
|
-
| `redisCollector()` | Status, memory, clients, keys, hit rate
|
|
253
|
-
| `queueCollector(opts)` | Active/waiting/delayed/failed jobs, worker count
|
|
254
|
-
| `logCollector(opts)` | Errors/warnings/entries (5m window), entries/minute
|
|
255
|
-
| `appCollector()` | Online users, pending webhooks, pending emails
|
|
240
|
+
| Collector | Metrics | Options | Peer Deps |
|
|
241
|
+
| ------------------------ | --------------------------------------------------------------- | ------------ | ----------------- |
|
|
242
|
+
| `processCollector()` | CPU %, event loop lag, heap/RSS memory, uptime, Node version | none | -- |
|
|
243
|
+
| `systemCollector()` | OS load averages, system memory, system uptime | none | -- |
|
|
244
|
+
| `httpCollector(opts?)` | Requests/sec, avg response time, error rate, active connections | optional | -- |
|
|
245
|
+
| `dbPoolCollector(opts?)` | Pool used/free/pending/max connections | optional | `@adonisjs/lucid` |
|
|
246
|
+
| `redisCollector()` | Status, memory, clients, keys, hit rate | none | `@adonisjs/redis` |
|
|
247
|
+
| `queueCollector(opts)` | Active/waiting/delayed/failed jobs, worker count | **required** | `bullmq` |
|
|
248
|
+
| `logCollector(opts)` | Errors/warnings/entries (5m window), entries/minute | **required** | -- |
|
|
249
|
+
| `appCollector()` | Online users, pending webhooks, pending emails | none | `@adonisjs/lucid` |
|
|
256
250
|
|
|
257
251
|
### Collector Options
|
|
258
252
|
|
|
259
253
|
```ts
|
|
260
254
|
httpCollector({
|
|
261
|
-
maxRecords: 10_000,
|
|
262
|
-
windowMs: 60_000,
|
|
255
|
+
maxRecords: 10_000, // Circular buffer size (default: 10,000)
|
|
256
|
+
windowMs: 60_000, // Rolling window for rate calc (default: 60s)
|
|
263
257
|
})
|
|
264
258
|
|
|
265
259
|
dbPoolCollector({
|
|
266
|
-
connectionName: 'postgres',
|
|
260
|
+
connectionName: 'postgres', // Lucid connection name (default: 'postgres')
|
|
267
261
|
})
|
|
268
262
|
|
|
269
263
|
queueCollector({
|
|
@@ -305,7 +299,7 @@ function diskCollector(): MetricCollector {
|
|
|
305
299
|
export default defineConfig({
|
|
306
300
|
collectors: [
|
|
307
301
|
processCollector(),
|
|
308
|
-
diskCollector(),
|
|
302
|
+
diskCollector(), // mix with built-in collectors
|
|
309
303
|
],
|
|
310
304
|
})
|
|
311
305
|
```
|
|
@@ -369,6 +363,7 @@ The `@serverStats()` Edge tag renders a self-contained stats bar with inline HTM
|
|
|
369
363
|
```
|
|
370
364
|
|
|
371
365
|
Features:
|
|
366
|
+
|
|
372
367
|
- Polls the stats API at the configured interval
|
|
373
368
|
- Color-coded thresholds (green/amber/red)
|
|
374
369
|
- SVG sparkline charts with gradient fills
|
|
@@ -392,8 +387,8 @@ export default defineConfig({
|
|
|
392
387
|
maxEvents: 200,
|
|
393
388
|
maxEmails: 100,
|
|
394
389
|
slowQueryThresholdMs: 100,
|
|
395
|
-
persistDebugData: true,
|
|
396
|
-
tracing: true,
|
|
390
|
+
persistDebugData: true, // or a custom path: 'custom/debug.json'
|
|
391
|
+
tracing: true, // enable per-request timeline
|
|
397
392
|
},
|
|
398
393
|
})
|
|
399
394
|
```
|
|
@@ -423,6 +418,7 @@ The debug toolbar captures all emails sent via AdonisJS mail (`mail:sending`, `m
|
|
|
423
418
|
### Persistent Debug Data
|
|
424
419
|
|
|
425
420
|
Enable `persistDebugData: true` to save queries, events, and emails to `.adonisjs/server-stats/debug-data.json`. You can also pass a custom path (relative to app root) like `persistDebugData: 'custom/debug.json'`. Data is:
|
|
421
|
+
|
|
426
422
|
- **Loaded** on server startup (before collectors start)
|
|
427
423
|
- **Flushed** every 30 seconds (handles crashes)
|
|
428
424
|
- **Saved** on graceful shutdown
|
|
@@ -449,14 +445,14 @@ GET /organizations/create 286ms
|
|
|
449
445
|
|
|
450
446
|
#### Span categories
|
|
451
447
|
|
|
452
|
-
| Category | Color | Auto-captured
|
|
453
|
-
|
|
454
|
-
| DB | Purple | `db:query` events
|
|
448
|
+
| Category | Color | Auto-captured |
|
|
449
|
+
| -------- | ------ | ---------------------- |
|
|
450
|
+
| DB | Purple | `db:query` events |
|
|
455
451
|
| Request | Blue | Full request lifecycle |
|
|
456
|
-
| Mail | Green | --
|
|
457
|
-
| Event | Amber | --
|
|
458
|
-
| View | Cyan | --
|
|
459
|
-
| Custom | Gray | Via `trace()` helper
|
|
452
|
+
| Mail | Green | -- |
|
|
453
|
+
| Event | Amber | -- |
|
|
454
|
+
| View | Cyan | -- |
|
|
455
|
+
| Custom | Gray | Via `trace()` helper |
|
|
460
456
|
|
|
461
457
|
#### Custom spans
|
|
462
458
|
|
|
@@ -527,19 +523,19 @@ devToolbar: {
|
|
|
527
523
|
|
|
528
524
|
#### Dashboard Sections
|
|
529
525
|
|
|
530
|
-
| Section
|
|
531
|
-
|
|
532
|
-
| **Overview** | Performance cards (avg/p95 response time, req/min, error rate) with sparkline charts and configurable time ranges (1h/6h/24h/7d)
|
|
533
|
-
| **Requests** | Paginated request history with method, URL, status, duration. Click for detail view with associated queries and trace
|
|
526
|
+
| Section | Description |
|
|
527
|
+
| ------------ | ------------------------------------------------------------------------------------------------------------------------------------------------------- |
|
|
528
|
+
| **Overview** | Performance cards (avg/p95 response time, req/min, error rate) with sparkline charts and configurable time ranges (1h/6h/24h/7d) |
|
|
529
|
+
| **Requests** | Paginated request history with method, URL, status, duration. Click for detail view with associated queries and trace |
|
|
534
530
|
| **Queries** | All captured SQL queries with duration, model, connection. Grouped view shows query patterns by normalized SQL. EXPLAIN plan support for SELECT queries |
|
|
535
|
-
| **Events** | Application events captured from the AdonisJS emitter
|
|
536
|
-
| **Routes** | Full route table with methods, patterns, handlers, and middleware stacks
|
|
537
|
-
| **Logs** | Log history with level filtering, text search, and structured JSON field search (e.g. filter by `userId = 5`)
|
|
538
|
-
| **Emails** | Email history with sender, recipient, subject, status. Click for HTML preview in iframe
|
|
539
|
-
| **Timeline** | Per-request waterfall timeline (requires `tracing: true`)
|
|
540
|
-
| **Cache** | Redis key browser with SCAN-based listing, type-aware detail view, and server stats (requires `@adonisjs/redis`)
|
|
541
|
-
| **Jobs** | Queue overview with job listing, detail, and retry for failed jobs (requires `@rlanz/bull-queue`)
|
|
542
|
-
| **Config** | Sanitized view of app configuration and environment variables. Secrets are auto-redacted
|
|
531
|
+
| **Events** | Application events captured from the AdonisJS emitter |
|
|
532
|
+
| **Routes** | Full route table with methods, patterns, handlers, and middleware stacks |
|
|
533
|
+
| **Logs** | Log history with level filtering, text search, and structured JSON field search (e.g. filter by `userId = 5`) |
|
|
534
|
+
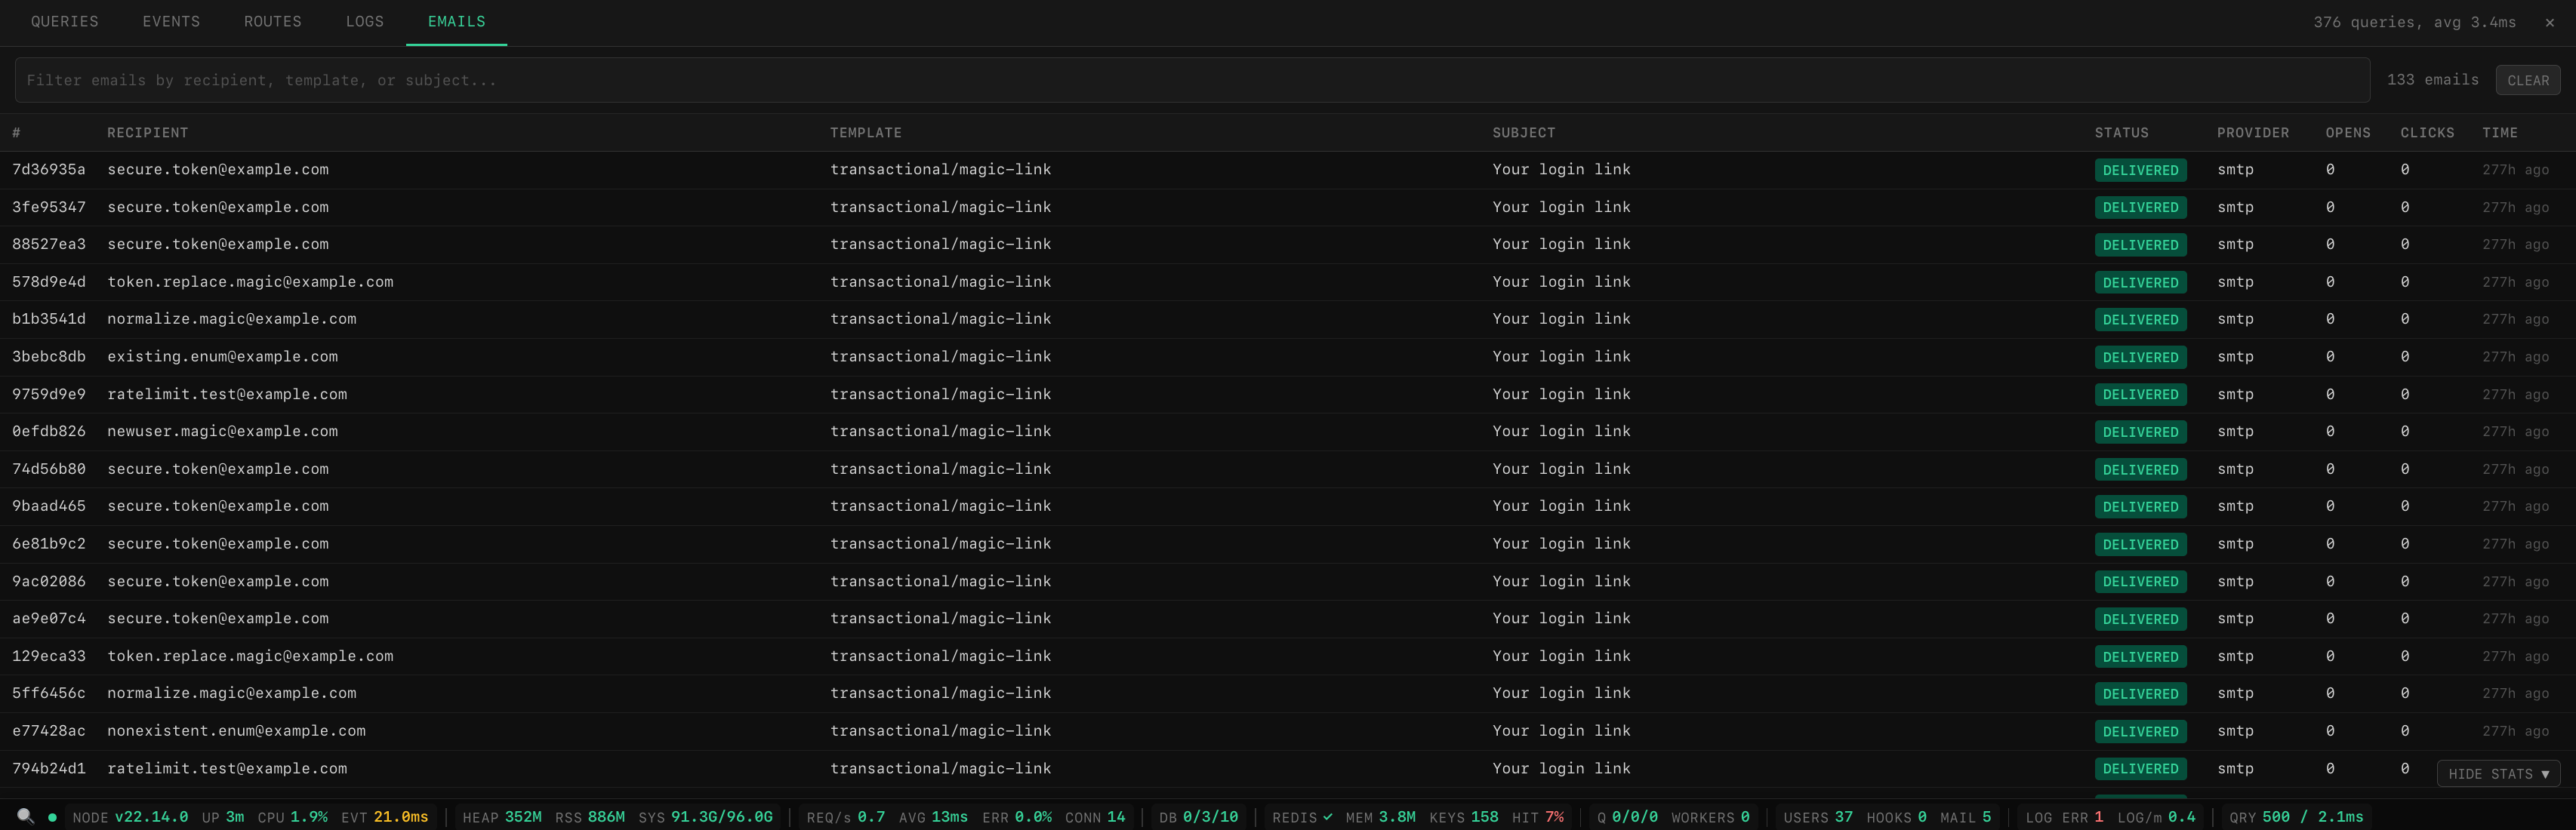
| **Emails** | Email history with sender, recipient, subject, status. Click for HTML preview in iframe |
|
|
535
|
+
| **Timeline** | Per-request waterfall timeline (requires `tracing: true`) |
|
|
536
|
+
| **Cache** | Redis key browser with SCAN-based listing, type-aware detail view, and server stats (requires `@adonisjs/redis`) |
|
|
537
|
+
| **Jobs** | Queue overview with job listing, detail, and retry for failed jobs (requires `@rlanz/bull-queue`) |
|
|
538
|
+
| **Config** | Sanitized view of app configuration and environment variables. Secrets are auto-redacted |
|
|
543
539
|
|
|
544
540
|
#### Access Control
|
|
545
541
|
|
|
@@ -562,12 +558,14 @@ When the dashboard is enabled, the debug panel gains link icons on query, event,
|
|
|
562
558
|
#### Real-Time Updates
|
|
563
559
|
|
|
564
560
|
The dashboard supports real-time updates via two mechanisms:
|
|
561
|
+
|
|
565
562
|
- **Transmit (SSE)**: If `@adonisjs/transmit` is installed, the dashboard subscribes to `server-stats/dashboard` for live overview updates
|
|
566
563
|
- **Polling fallback**: If Transmit is not available, the dashboard polls the API at a configurable interval
|
|
567
564
|
|
|
568
565
|
#### Data Storage
|
|
569
566
|
|
|
570
567
|
The dashboard uses a dedicated SQLite database (separate from your app's database) with 8 tables prefixed with `server_stats_`. The database is:
|
|
568
|
+
|
|
571
569
|
- **Auto-migrated** on startup (no manual migration step)
|
|
572
570
|
- **Self-contained** -- uses its own Knex connection, never touches your app's migration history
|
|
573
571
|
- **Self-cleaning** -- old data is automatically purged based on `retentionDays`
|
|
@@ -640,40 +638,40 @@ async webhooks({ response }: HttpContext) {
|
|
|
640
638
|
|
|
641
639
|
#### `DebugPane` Options
|
|
642
640
|
|
|
643
|
-
| Option | Type | Default | Description
|
|
644
|
-
|
|
645
|
-
| `id` | `string` | -- | Unique identifier (also default data key)
|
|
646
|
-
| `label` | `string` | -- | Tab display name
|
|
647
|
-
| `endpoint` | `string` | -- | API endpoint URL
|
|
648
|
-
| `columns` | `DebugPaneColumn[]` | -- | Column definitions
|
|
649
|
-
| `search` | `{ placeholder }` | -- | Enable search bar
|
|
650
|
-
| `dataKey` | `string` | `id` | JSON key for data array (dot notation OK)
|
|
651
|
-
| `fetchOnce` | `boolean` | `false` | Cache after first fetch
|
|
652
|
-
| `clearable` | `boolean` | `false` | Show Clear button
|
|
641
|
+
| Option | Type | Default | Description |
|
|
642
|
+
| ----------- | ------------------- | ------- | ----------------------------------------- |
|
|
643
|
+
| `id` | `string` | -- | Unique identifier (also default data key) |
|
|
644
|
+
| `label` | `string` | -- | Tab display name |
|
|
645
|
+
| `endpoint` | `string` | -- | API endpoint URL |
|
|
646
|
+
| `columns` | `DebugPaneColumn[]` | -- | Column definitions |
|
|
647
|
+
| `search` | `{ placeholder }` | -- | Enable search bar |
|
|
648
|
+
| `dataKey` | `string` | `id` | JSON key for data array (dot notation OK) |
|
|
649
|
+
| `fetchOnce` | `boolean` | `false` | Cache after first fetch |
|
|
650
|
+
| `clearable` | `boolean` | `false` | Show Clear button |
|
|
653
651
|
|
|
654
652
|
#### `DebugPaneColumn` Options
|
|
655
653
|
|
|
656
|
-
| Option | Type | Default | Description
|
|
657
|
-
|
|
658
|
-
| `key` | `string` | -- | JSON field name
|
|
659
|
-
| `label` | `string` | -- | Column header text
|
|
660
|
-
| `width` | `string` | auto | CSS width (e.g. `'60px'`)
|
|
661
|
-
| `format` | `DebugPaneFormatType` | `'text'` | Cell format (see table below)
|
|
662
|
-
| `searchable` | `boolean` | `false` | Include in search filtering
|
|
663
|
-
| `filterable` | `boolean` | `false` | Click to set as search filter
|
|
664
|
-
| `badgeColorMap` | `Record<string, string>` | -- | Value-to-color map for `badge` format
|
|
654
|
+
| Option | Type | Default | Description |
|
|
655
|
+
| --------------- | ------------------------ | -------- | ------------------------------------- |
|
|
656
|
+
| `key` | `string` | -- | JSON field name |
|
|
657
|
+
| `label` | `string` | -- | Column header text |
|
|
658
|
+
| `width` | `string` | auto | CSS width (e.g. `'60px'`) |
|
|
659
|
+
| `format` | `DebugPaneFormatType` | `'text'` | Cell format (see table below) |
|
|
660
|
+
| `searchable` | `boolean` | `false` | Include in search filtering |
|
|
661
|
+
| `filterable` | `boolean` | `false` | Click to set as search filter |
|
|
662
|
+
| `badgeColorMap` | `Record<string, string>` | -- | Value-to-color map for `badge` format |
|
|
665
663
|
|
|
666
664
|
#### Format Types
|
|
667
665
|
|
|
668
|
-
| Format | Renders As
|
|
669
|
-
|
|
670
|
-
| `text` | Escaped plain text
|
|
671
|
-
| `time` | `HH:MM:SS.mmm`
|
|
672
|
-
| `timeAgo` | `3s ago`, `2m ago`
|
|
673
|
-
| `duration` | `X.XXms` with color coding
|
|
674
|
-
| `method` | HTTP method pill badge
|
|
675
|
-
| `json` | Compact preview, click to expand
|
|
676
|
-
| `badge` | Colored pill via `badgeColorMap`
|
|
666
|
+
| Format | Renders As | Expected Input |
|
|
667
|
+
| ---------- | -------------------------------- | ----------------------- |
|
|
668
|
+
| `text` | Escaped plain text | any |
|
|
669
|
+
| `time` | `HH:MM:SS.mmm` | Unix timestamp (ms) |
|
|
670
|
+
| `timeAgo` | `3s ago`, `2m ago` | Unix timestamp (ms) |
|
|
671
|
+
| `duration` | `X.XXms` with color coding | number (ms) |
|
|
672
|
+
| `method` | HTTP method pill badge | `'GET'`, `'POST'`, etc. |
|
|
673
|
+
| `json` | Compact preview, click to expand | object or array |
|
|
674
|
+
| `badge` | Colored pill via `badgeColorMap` | string |
|
|
677
675
|
|
|
678
676
|
Badge colors: `green`, `amber`, `red`, `blue`, `purple`, `muted`
|
|
679
677
|
|
|
@@ -704,6 +702,7 @@ Gauges are updated automatically on each collection tick.
|
|
|
704
702
|
The log stream module watches a JSON log file and broadcasts new entries via Transmit (SSE).
|
|
705
703
|
|
|
706
704
|
**Two purposes:**
|
|
705
|
+
|
|
707
706
|
1. Provides error/warning counts to the stats bar via `logCollector()`
|
|
708
707
|
2. Broadcasts individual log entries to a Transmit channel via `LogStreamProvider`
|
|
709
708
|
|
|
@@ -778,7 +777,6 @@ import type {
|
|
|
778
777
|
QueueRedisConnection,
|
|
779
778
|
LogCollectorOptions,
|
|
780
779
|
} from 'adonisjs-server-stats/collectors'
|
|
781
|
-
|
|
782
780
|
```
|
|
783
781
|
|
|
784
782
|
---
|
|
@@ -787,16 +785,16 @@ import type {
|
|
|
787
785
|
|
|
788
786
|
All integrations use lazy `import()` -- missing peer deps won't crash the app. The corresponding collector simply returns defaults.
|
|
789
787
|
|
|
790
|
-
| Dependency | Required By
|
|
791
|
-
|
|
792
|
-
| `@adonisjs/core` | Everything (required)
|
|
793
|
-
| `@adonisjs/lucid` | `dbPoolCollector`, `appCollector`, dashboard
|
|
794
|
-
| `@adonisjs/redis` | `redisCollector`, dashboard cache inspector
|
|
795
|
-
| `@adonisjs/transmit` | Provider (SSE broadcast), dashboard real-time
|
|
796
|
-
| `@julr/adonisjs-prometheus` | `serverStatsCollector`
|
|
797
|
-
| `bullmq` | `queueCollector`
|
|
798
|
-
| `better-sqlite3` | Dashboard (`dashboard: true`)
|
|
799
|
-
| `edge.js` | Edge tag
|
|
788
|
+
| Dependency | Required By |
|
|
789
|
+
| --------------------------- | --------------------------------------------- |
|
|
790
|
+
| `@adonisjs/core` | Everything (required) |
|
|
791
|
+
| `@adonisjs/lucid` | `dbPoolCollector`, `appCollector`, dashboard |
|
|
792
|
+
| `@adonisjs/redis` | `redisCollector`, dashboard cache inspector |
|
|
793
|
+
| `@adonisjs/transmit` | Provider (SSE broadcast), dashboard real-time |
|
|
794
|
+
| `@julr/adonisjs-prometheus` | `serverStatsCollector` |
|
|
795
|
+
| `bullmq` | `queueCollector` |
|
|
796
|
+
| `better-sqlite3` | Dashboard (`dashboard: true`) |
|
|
797
|
+
| `edge.js` | Edge tag |
|
|
800
798
|
|
|
801
799
|
## License
|
|
802
800
|
|
package/dist/configure.d.ts.map
CHANGED
|
@@ -1 +1 @@
|
|
|
1
|
-
{"version":3,"file":"configure.d.ts","sourceRoot":"","sources":["../configure.ts"],"names":[],"mappings":"
|
|
1
|
+
{"version":3,"file":"configure.d.ts","sourceRoot":"","sources":["../configure.ts"],"names":[],"mappings":"AAEA,OAAO,KAAK,SAAS,MAAM,mCAAmC,CAAA;AAE9D,wBAAsB,SAAS,CAAC,OAAO,EAAE,SAAS,iBAWjD"}
|
|
@@ -1,5 +1,5 @@
|
|
|
1
|
-
import type {
|
|
2
|
-
import type {
|
|
1
|
+
import type { DebugStore } from '../debug/debug_store.js';
|
|
2
|
+
import type { HttpContext } from '@adonisjs/core/http';
|
|
3
3
|
export default class DebugController {
|
|
4
4
|
private store;
|
|
5
5
|
constructor(store: DebugStore);
|
|
@@ -1 +1 @@
|
|
|
1
|
-
{"version":3,"file":"debug_controller.d.ts","sourceRoot":"","sources":["../../../src/controller/debug_controller.ts"],"names":[],"mappings":"AAAA,OAAO,KAAK,EAAE,
|
|
1
|
+
{"version":3,"file":"debug_controller.d.ts","sourceRoot":"","sources":["../../../src/controller/debug_controller.ts"],"names":[],"mappings":"AAAA,OAAO,KAAK,EAAE,UAAU,EAAE,MAAM,yBAAyB,CAAA;AACzD,OAAO,KAAK,EAAE,WAAW,EAAE,MAAM,qBAAqB,CAAA;AAEtD,MAAM,CAAC,OAAO,OAAO,eAAe;IACtB,OAAO,CAAC,KAAK;gBAAL,KAAK,EAAE,UAAU;IAE/B,OAAO,CAAC,EAAE,QAAQ,EAAE,EAAE,WAAW;IAMjC,MAAM,CAAC,EAAE,QAAQ,EAAE,EAAE,WAAW;IAKhC,MAAM,CAAC,EAAE,QAAQ,EAAE,EAAE,WAAW;IAKhC,MAAM,CAAC,EAAE,QAAQ,EAAE,EAAE,WAAW;IAOhC,YAAY,CAAC,EAAE,MAAM,EAAE,QAAQ,EAAE,EAAE,WAAW;IAS9C,MAAM,CAAC,EAAE,QAAQ,EAAE,EAAE,WAAW;IAahC,WAAW,CAAC,EAAE,MAAM,EAAE,QAAQ,EAAE,EAAE,WAAW;CAWpD"}
|
|
@@ -1,5 +1,5 @@
|
|
|
1
|
-
import type { HttpContext } from '@adonisjs/core/http';
|
|
2
1
|
import type { StatsEngine } from '../engine/stats_engine.js';
|
|
2
|
+
import type { HttpContext } from '@adonisjs/core/http';
|
|
3
3
|
export default class ServerStatsController {
|
|
4
4
|
private engine;
|
|
5
5
|
constructor(engine: StatsEngine);
|
|
@@ -1 +1 @@
|
|
|
1
|
-
{"version":3,"file":"server_stats_controller.d.ts","sourceRoot":"","sources":["../../../src/controller/server_stats_controller.ts"],"names":[],"mappings":"AAAA,OAAO,KAAK,EAAE,WAAW,EAAE,MAAM,
|
|
1
|
+
{"version":3,"file":"server_stats_controller.d.ts","sourceRoot":"","sources":["../../../src/controller/server_stats_controller.ts"],"names":[],"mappings":"AAAA,OAAO,KAAK,EAAE,WAAW,EAAE,MAAM,2BAA2B,CAAA;AAC5D,OAAO,KAAK,EAAE,WAAW,EAAE,MAAM,qBAAqB,CAAA;AAEtD,MAAM,CAAC,OAAO,OAAO,qBAAqB;IAC5B,OAAO,CAAC,MAAM;gBAAN,MAAM,EAAE,WAAW;IAEjC,KAAK,CAAC,EAAE,QAAQ,EAAE,EAAE,WAAW;CAItC"}
|
|
@@ -1 +1 @@
|
|
|
1
|
-
{"version":3,"file":"chart_aggregator.d.ts","sourceRoot":"","sources":["../../../src/dashboard/chart_aggregator.ts"],"names":[],"mappings":"
|
|
1
|
+
{"version":3,"file":"chart_aggregator.d.ts","sourceRoot":"","sources":["../../../src/dashboard/chart_aggregator.ts"],"names":[],"mappings":"AAGA,OAAO,KAAK,EAAE,IAAI,EAAE,MAAM,MAAM,CAAA;AAEhC;;;;;;;;;;GAUG;AACH,qBAAa,eAAe;IAC1B,OAAO,CAAC,EAAE,CAAM;IAChB,OAAO,CAAC,KAAK,CAA8C;gBAE/C,EAAE,EAAE,IAAI;IAIpB,KAAK,IAAI,IAAI;IAQb,IAAI,IAAI,IAAI;YAOE,SAAS;CA0DxB"}
|
|
@@ -1,3 +1,5 @@
|
|
|
1
|
+
import { round } from '../utils/math_helpers.js';
|
|
2
|
+
import { toSqliteTimestamp } from '../utils/time_helpers.js';
|
|
1
3
|
/**
|
|
2
4
|
* Periodically aggregates recent request data into time-bucketed
|
|
3
5
|
* metrics stored in `server_stats_metrics`.
|
|
@@ -31,13 +33,11 @@ export class ChartAggregator {
|
|
|
31
33
|
async aggregate() {
|
|
32
34
|
const bucket = getBucketTimestamp();
|
|
33
35
|
// Check if we already have a row for this bucket (idempotent)
|
|
34
|
-
const existing = await this.db('server_stats_metrics')
|
|
35
|
-
.where('bucket', bucket)
|
|
36
|
-
.first();
|
|
36
|
+
const existing = await this.db('server_stats_metrics').where('bucket', bucket).first();
|
|
37
37
|
if (existing)
|
|
38
38
|
return;
|
|
39
39
|
// Get requests from the last 60 seconds
|
|
40
|
-
const cutoff = new Date(Date.now() - 60_000)
|
|
40
|
+
const cutoff = toSqliteTimestamp(new Date(Date.now() - 60_000));
|
|
41
41
|
const requests = await this.db('server_stats_requests')
|
|
42
42
|
.where('created_at', '>=', cutoff)
|
|
43
43
|
.select('duration', 'status_code');
|
|
@@ -70,11 +70,11 @@ export class ChartAggregator {
|
|
|
70
70
|
await this.db('server_stats_metrics').insert({
|
|
71
71
|
bucket,
|
|
72
72
|
request_count: requestCount,
|
|
73
|
-
avg_duration:
|
|
74
|
-
p95_duration:
|
|
73
|
+
avg_duration: round(avgDuration),
|
|
74
|
+
p95_duration: round(p95Duration),
|
|
75
75
|
error_count: errorCount,
|
|
76
76
|
query_count: queryStats?.query_count ?? 0,
|
|
77
|
-
avg_query_duration:
|
|
77
|
+
avg_query_duration: round(queryStats?.avg_query_duration ?? 0),
|
|
78
78
|
});
|
|
79
79
|
}
|
|
80
80
|
}
|
|
@@ -85,5 +85,5 @@ export class ChartAggregator {
|
|
|
85
85
|
function getBucketTimestamp() {
|
|
86
86
|
const now = new Date();
|
|
87
87
|
now.setSeconds(0, 0);
|
|
88
|
-
return now
|
|
88
|
+
return toSqliteTimestamp(now);
|
|
89
89
|
}
|
|
@@ -1,13 +1,12 @@
|
|
|
1
|
+
import type { DebugStore } from '../debug/debug_store.js';
|
|
2
|
+
import type { DashboardStore } from './dashboard_store.js';
|
|
1
3
|
import type { HttpContext } from '@adonisjs/core/http';
|
|
2
4
|
import type { ApplicationService } from '@adonisjs/core/types';
|
|
3
|
-
import type { DashboardStore } from './dashboard_store.js';
|
|
4
|
-
import type { DebugStore } from '../debug/debug_store.js';
|
|
5
5
|
/**
|
|
6
6
|
* Controller for the full-page dashboard.
|
|
7
7
|
*
|
|
8
8
|
* Serves the dashboard HTML page and all JSON API endpoints.
|
|
9
|
-
*
|
|
10
|
-
* the in-memory DebugStore, and the AdonisJS application instance.
|
|
9
|
+
* Delegates all data access to the DashboardStore.
|
|
11
10
|
*/
|
|
12
11
|
export default class DashboardController {
|
|
13
12
|
private dashboardStore;
|
|
@@ -22,126 +21,42 @@ export default class DashboardController {
|
|
|
22
21
|
private cachedJs;
|
|
23
22
|
private cachedTransmitClient;
|
|
24
23
|
constructor(dashboardStore: DashboardStore, debugStore: DebugStore, app: ApplicationService);
|
|
25
|
-
/**
|
|
26
|
-
* GET {dashboardPath} — Render the dashboard Edge template.
|
|
27
|
-
*
|
|
28
|
-
* Reads the dashboard CSS/JS assets and passes them as template state
|
|
29
|
-
* along with configuration for tracing and custom panes.
|
|
30
|
-
*/
|
|
31
24
|
page(ctx: HttpContext): Promise<any>;
|
|
32
|
-
/**
|
|
33
|
-
* GET {dashboardPath}/api/overview — Overview metrics cards.
|
|
34
|
-
*/
|
|
35
25
|
overview({ request, response }: HttpContext): Promise<void>;
|
|
36
|
-
/**
|
|
37
|
-
* GET {dashboardPath}/api/overview/chart — Chart data with time range.
|
|
38
|
-
*/
|
|
39
26
|
overviewChart({ request, response }: HttpContext): Promise<void>;
|
|
40
|
-
/**
|
|
41
|
-
* GET {dashboardPath}/api/requests — Paginated request history.
|
|
42
|
-
*/
|
|
43
27
|
requests({ request, response }: HttpContext): Promise<void>;
|
|
44
|
-
/**
|
|
45
|
-
* GET {dashboardPath}/api/requests/:id — Single request with trace.
|
|
46
|
-
*/
|
|
47
28
|
requestDetail({ params, response }: HttpContext): Promise<void>;
|
|
48
|
-
/**
|
|
49
|
-
* GET {dashboardPath}/api/queries — Paginated query history.
|
|
50
|
-
*/
|
|
51
29
|
queries({ request, response }: HttpContext): Promise<void>;
|
|
52
|
-
/**
|
|
53
|
-
* GET {dashboardPath}/api/queries/grouped — Grouped by normalized SQL.
|
|
54
|
-
*/
|
|
55
30
|
queriesGrouped({ request, response }: HttpContext): Promise<void>;
|
|
56
|
-
/**
|
|
57
|
-
* GET {dashboardPath}/api/queries/:id/explain — Run EXPLAIN on a query.
|
|
58
|
-
*/
|
|
59
31
|
queryExplain({ params, response }: HttpContext): Promise<void>;
|
|
60
|
-
/**
|
|
61
|
-
* GET {dashboardPath}/api/events — Paginated event history.
|
|
62
|
-
*/
|
|
63
32
|
events({ request, response }: HttpContext): Promise<void>;
|
|
64
|
-
/**
|
|
65
|
-
* GET {dashboardPath}/api/routes — Route table (delegates to DebugStore).
|
|
66
|
-
*/
|
|
67
33
|
routes({ response }: HttpContext): Promise<void>;
|
|
68
|
-
/**
|
|
69
|
-
* GET {dashboardPath}/api/logs — Paginated logs with structured search.
|
|
70
|
-
*/
|
|
71
34
|
logs({ request, response }: HttpContext): Promise<void>;
|
|
72
|
-
/**
|
|
73
|
-
* GET {dashboardPath}/api/emails — Paginated email history.
|
|
74
|
-
*/
|
|
75
35
|
emails({ request, response }: HttpContext): Promise<void>;
|
|
76
|
-
/**
|
|
77
|
-
* GET {dashboardPath}/api/emails/:id/preview — Email HTML preview.
|
|
78
|
-
*/
|
|
79
36
|
emailPreview({ params, response }: HttpContext): Promise<void>;
|
|
80
|
-
/**
|
|
81
|
-
* GET {dashboardPath}/api/traces — Paginated trace list (lightweight).
|
|
82
|
-
*/
|
|
83
37
|
traces({ request, response }: HttpContext): Promise<void>;
|
|
84
|
-
/**
|
|
85
|
-
* GET {dashboardPath}/api/traces/:id — Single trace with full spans.
|
|
86
|
-
*/
|
|
87
38
|
traceDetail({ params, response }: HttpContext): Promise<void>;
|
|
88
|
-
/**
|
|
89
|
-
* GET {dashboardPath}/api/cache — Cache stats and key list.
|
|
90
|
-
*/
|
|
91
39
|
cacheStats({ request, response }: HttpContext): Promise<void>;
|
|
92
|
-
/**
|
|
93
|
-
* GET {dashboardPath}/api/cache/:key — Single cache key detail.
|
|
94
|
-
*/
|
|
95
40
|
cacheKey({ params, response }: HttpContext): Promise<void>;
|
|
96
|
-
/**
|
|
97
|
-
* GET {dashboardPath}/api/jobs — Job list with status filter.
|
|
98
|
-
*/
|
|
99
41
|
jobs({ request, response }: HttpContext): Promise<void>;
|
|
100
|
-
/**
|
|
101
|
-
* GET {dashboardPath}/api/jobs/:id — Single job detail.
|
|
102
|
-
*/
|
|
103
42
|
jobDetail({ params, response }: HttpContext): Promise<void>;
|
|
104
|
-
/**
|
|
105
|
-
* POST {dashboardPath}/api/jobs/:id/retry — Retry a failed job.
|
|
106
|
-
*/
|
|
107
43
|
jobRetry({ params, response }: HttpContext): Promise<void>;
|
|
108
|
-
/**
|
|
109
|
-
* GET {dashboardPath}/api/config — Sanitized app config and env vars.
|
|
110
|
-
*/
|
|
111
44
|
config({ response }: HttpContext): Promise<void>;
|
|
112
|
-
/**
|
|
113
|
-
* GET {dashboardPath}/api/filters — List saved filter presets.
|
|
114
|
-
*/
|
|
115
45
|
savedFilters({ response }: HttpContext): Promise<void>;
|
|
116
|
-
/**
|
|
117
|
-
* POST {dashboardPath}/api/filters — Create a saved filter preset.
|
|
118
|
-
*/
|
|
119
46
|
createSavedFilter({ request, response }: HttpContext): Promise<void>;
|
|
120
|
-
/**
|
|
121
|
-
* DELETE {dashboardPath}/api/filters/:id — Delete a saved filter preset.
|
|
122
|
-
*/
|
|
123
47
|
deleteSavedFilter({ params, response }: HttpContext): Promise<void>;
|
|
124
48
|
/**
|
|
125
|
-
*
|
|
49
|
+
* Wraps a store call with null-guard + try/catch boilerplate.
|
|
50
|
+
* Returns emptyValue if the store is not ready or the fn throws.
|
|
126
51
|
*/
|
|
52
|
+
private withDb;
|
|
127
53
|
private checkAccess;
|
|
128
|
-
/**
|
|
129
|
-
* Get the configured dashboard path.
|
|
130
|
-
*/
|
|
131
54
|
private getDashboardPath;
|
|
132
|
-
/**
|
|
133
|
-
|
|
134
|
-
|
|
135
|
-
|
|
136
|
-
|
|
137
|
-
private
|
|
138
|
-
/**
|
|
139
|
-
* Lazily initialize and return the CacheInspector (if Redis is available).
|
|
140
|
-
*/
|
|
141
|
-
private getCacheInspector;
|
|
142
|
-
/**
|
|
143
|
-
* Lazily initialize and return the QueueInspector (if Bull Queue is available).
|
|
144
|
-
*/
|
|
145
|
-
private getQueueInspector;
|
|
55
|
+
/** Lazy-init inspector pattern for cache and queue. */
|
|
56
|
+
private getInspector;
|
|
57
|
+
/** Fetch cache overview stats for the overview page. */
|
|
58
|
+
private fetchCacheOverview;
|
|
59
|
+
/** Fetch queue overview stats for the overview page. */
|
|
60
|
+
private fetchQueueOverview;
|
|
146
61
|
}
|
|
147
62
|
//# sourceMappingURL=dashboard_controller.d.ts.map
|