@tangle-network/traces 0.10.3 → 0.11.2
This diff represents the content of publicly available package versions that have been released to one of the supported registries. The information contained in this diff is provided for informational purposes only and reflects changes between package versions as they appear in their respective public registries.
- package/README.md +220 -15
- package/dist/{chunk-LC66I5TE.js → chunk-UY3M7XUF.js} +3350 -689
- package/dist/cli.js +278 -30
- package/dist/index.d.ts +1217 -9
- package/dist/index.js +129 -3
- package/docs/replay-verify.md +55 -0
- package/package.json +6 -2
- package/skills/inspect-agent-traces/SKILL.md +31 -2
package/README.md
CHANGED
|
@@ -1,6 +1,6 @@
|
|
|
1
1
|
# traces
|
|
2
2
|
|
|
3
|
-
> Point `traces` at
|
|
3
|
+
> Point `traces` at any agent trace — OTLP spans your own system emits, or the session logs Claude Code, Codex, OpenCode and Gemini already write to disk. Get failure-mode and efficiency findings, plus a straight answer about what the trace cannot tell you. A CLI *and* an SDK.
|
|
4
4
|
|
|
5
5
|
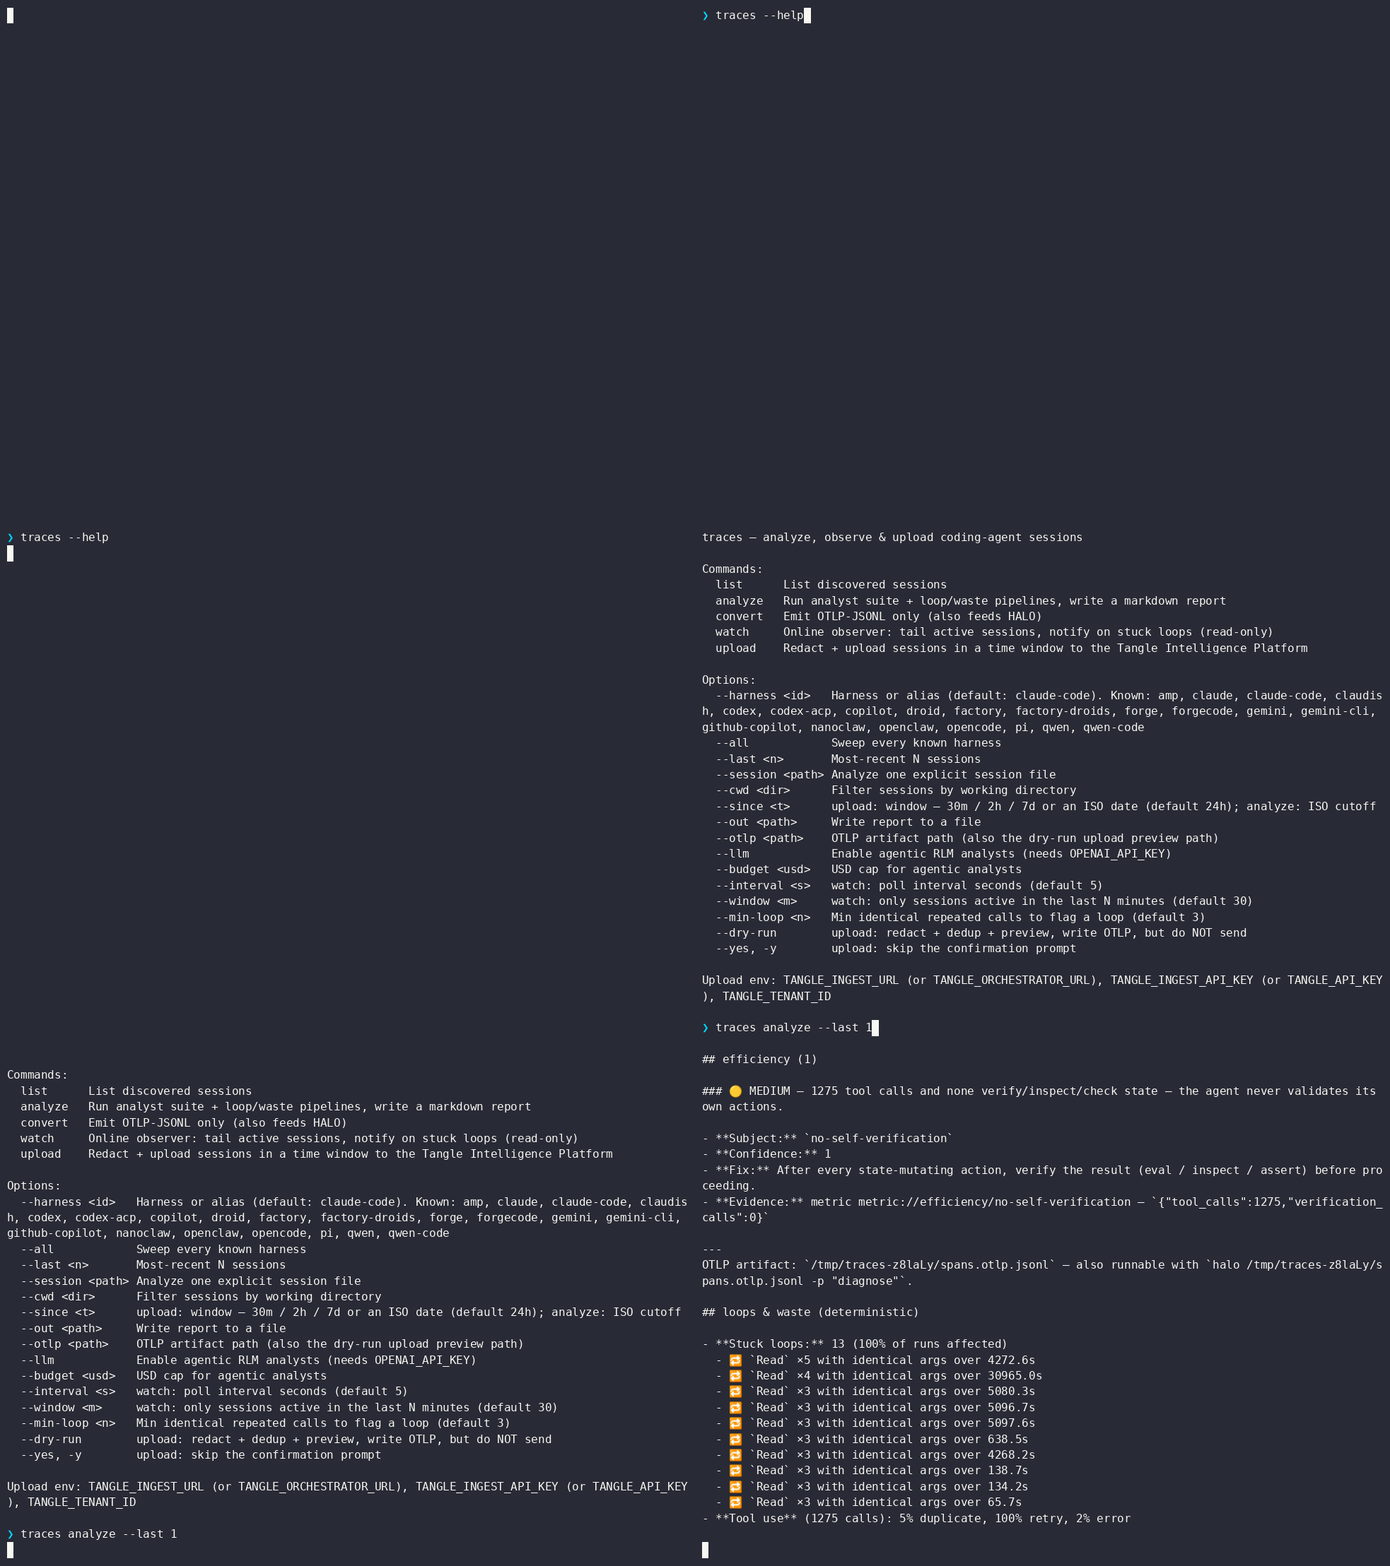
|
|
6
6
|
|
|
@@ -8,16 +8,27 @@
|
|
|
8
8
|
[](./LICENSE)
|
|
9
9
|
[](https://nodejs.org)
|
|
10
10
|
|
|
11
|
-
It reads
|
|
11
|
+
It reads a run as spans and reports where the agent got stuck, burned tokens, or stopped checking its own work. The deterministic pass runs locally, with no API key and no cost.
|
|
12
|
+
|
|
13
|
+
There are two ways in, and they are not equal:
|
|
14
|
+
|
|
15
|
+
| | Use when | How |
|
|
16
|
+
|---|---|---|
|
|
17
|
+
| **Emit the contract** | You control the system | Emit [`@tangle-network/agent-trace-contract`](https://github.com/tangle-network/agent-sdk/tree/main/packages/agent-trace-contract) spans, then `traces analyze --otlp <file\|dir>` |
|
|
18
|
+
| **Adapters** | You do *not* control the format | `traces analyze --harness claude-code` reads a proprietary session store and translates it |
|
|
19
|
+
|
|
20
|
+
Emitting the contract is the supported way to integrate a new system. The adapters are the legacy edge — they exist because the coding agents write formats nobody standardised, and each one is a translation somebody has to maintain. If you can choose, choose `--otlp`.
|
|
12
21
|
|
|
13
22
|
## Contents
|
|
14
23
|
|
|
15
24
|
- [Install](#install)
|
|
16
25
|
- [Quick start](#quick-start)
|
|
26
|
+
- [Integrate your own system](#integrate-your-own-system)
|
|
17
27
|
- [What it finds](#what-it-finds)
|
|
18
28
|
- [Supported harnesses](#supported-harnesses)
|
|
19
29
|
- [CLI reference](#cli-reference)
|
|
20
30
|
- [Live stream](#live-stream)
|
|
31
|
+
- [Watch a run tree](#watch-a-run-tree)
|
|
21
32
|
- [Improvement engine](#improvement-engine)
|
|
22
33
|
- [Session index](#session-index)
|
|
23
34
|
- [Policy-mining evidence](#policy-mining-evidence)
|
|
@@ -44,7 +55,9 @@ Requires Node ≥ 22.
|
|
|
44
55
|
## Quick start
|
|
45
56
|
|
|
46
57
|
```bash
|
|
47
|
-
traces
|
|
58
|
+
traces validate spans.otlp.jsonl # what can this trace answer?
|
|
59
|
+
traces analyze --otlp spans.otlp.jsonl # analyse it, no adapter involved
|
|
60
|
+
traces analyze --harness claude-code --last 1 # or read a coding agent's own log
|
|
48
61
|
traces improve --harness claude-code --last 5 --dir .traces/improvement
|
|
49
62
|
traces watch --all
|
|
50
63
|
traces stream --all --mode findings
|
|
@@ -65,6 +78,110 @@ See [Trace analysts](#trace-analysts).
|
|
|
65
78
|
It writes one typed result, one report, flattened evidence rows, and the canonical OTLP trace.
|
|
66
79
|
Each finding already contains the claim, evidence, recommended action, confidence, and validation plan.
|
|
67
80
|
|
|
81
|
+
## Integrate your own system
|
|
82
|
+
|
|
83
|
+
No adapter, no plugin. Emit the span contract and point `--otlp` at the file.
|
|
84
|
+
|
|
85
|
+
```bash
|
|
86
|
+
npm i @tangle-network/agent-trace-contract # zero runtime dependencies
|
|
87
|
+
```
|
|
88
|
+
|
|
89
|
+
You install it to PRODUCE spans. This package already depends on it to read
|
|
90
|
+
them, so `npx @tangle-network/traces@latest` arrives with the contract-backed
|
|
91
|
+
analyses working: trace conformance, `traces validate`, `--otlp` inbound
|
|
92
|
+
reading, round-over-round convergence and the steering chain, and OpenInference
|
|
93
|
+
/ intelligence-spans conversion.
|
|
94
|
+
|
|
95
|
+
```ts
|
|
96
|
+
import { llmSpan, loopSpan, steeredBy, toolSpan } from '@tangle-network/agent-trace-contract'
|
|
97
|
+
|
|
98
|
+
// One round of a loop, the model call and tool call inside it, then the next
|
|
99
|
+
// round — linked to the verdict that CAUSED it, not parented to it.
|
|
100
|
+
const round1 = loopSpan({ traceId, spanId: 'round-1', parentSpanId: null, name: 'round 1',
|
|
101
|
+
loopId: 'fix-loop', iteration: 1, startTime, endTime })
|
|
102
|
+
const call = llmSpan({ traceId, spanId: 'llm-1', parentSpanId: 'round-1', name: 'coder turn',
|
|
103
|
+
model: 'glm-5.2', inputTokens: 1200, outputTokens: 340, costUsd: 0.0042, startTime, endTime })
|
|
104
|
+
const tool = toolSpan({ traceId, spanId: 'tool-1', parentSpanId: 'round-1', name: 'bash',
|
|
105
|
+
toolName: 'bash', startTime, endTime })
|
|
106
|
+
const round2 = loopSpan({ traceId, spanId: 'round-2', parentSpanId: null, name: 'round 2',
|
|
107
|
+
loopId: 'fix-loop', iteration: 2, resumed: true, startTime, endTime,
|
|
108
|
+
links: [steeredBy('llm-1', traceId)] })
|
|
109
|
+
```
|
|
110
|
+
|
|
111
|
+
Write one span per line to a `.jsonl` file, then:
|
|
112
|
+
|
|
113
|
+
```bash
|
|
114
|
+
traces validate spans.otlp.jsonl # exit 1 only when the file is not a trace
|
|
115
|
+
traces analyze --otlp spans.otlp.jsonl # a directory reads the OTLP files under it
|
|
116
|
+
```
|
|
117
|
+
|
|
118
|
+
A directory is a run directory, not a span directory: it holds the span export
|
|
119
|
+
next to raw event, stream and SDK logs that are also `*.jsonl`. Only the OTLP
|
|
120
|
+
files are read — every other JSONL is listed in the report with what it actually
|
|
121
|
+
holds, rather than counted as several hundred broken spans. Put the exports in an
|
|
122
|
+
`otlp/` subdirectory and that decides it outright.
|
|
123
|
+
|
|
124
|
+
On a writing command (`convert`, `export`, `evidence`, `upload`), `--otlp` is the
|
|
125
|
+
DEPRECATED spelling of `--otlp-out`. It still works, with a warning, and is
|
|
126
|
+
removed in 0.12.
|
|
127
|
+
|
|
128
|
+
`parent_span_id` is CONTAINMENT — this span happened inside that one. `links` is
|
|
129
|
+
CAUSALITY — that verdict caused this retry. Encoding causality as a parent claims
|
|
130
|
+
a nesting that never existed, so the two edges stay separate and both survive a
|
|
131
|
+
round-trip through `traces`.
|
|
132
|
+
|
|
133
|
+
### What a trace cannot tell you, said out loud
|
|
134
|
+
|
|
135
|
+
`validate` reports the conformance of any OTLP file, conforming or not — it never
|
|
136
|
+
throws on a foreign trace, it reports it:
|
|
137
|
+
|
|
138
|
+
- **findings** by severity, each naming the *consequence* of the defect and the capabilities it blocks
|
|
139
|
+
- **the capability table** — `token-accounting`, `cost-attribution`, `tool-usage`, `loop-convergence`, `tree-comparison`, `steering-chain`, `latency-analysis` — available or not, with the trace's own reason
|
|
140
|
+
- **span structure** — how much of the tree actually attaches, and how many rows could not be read at all
|
|
141
|
+
|
|
142
|
+
Exit code is 1 on exactly one condition: not one entry could be read as a span,
|
|
143
|
+
so the file is not a trace. Severity says what a finding claims about the INPUT,
|
|
144
|
+
not how loud it is — `error` is "nothing readable", `warn` is "readable but
|
|
145
|
+
degraded", `info` is "nothing measurable lost" — so a `warn` exits 0 and the
|
|
146
|
+
capability table, not the exit code, says what the degradation cost.
|
|
147
|
+
|
|
148
|
+
#### A re-export never validates cleaner than its source
|
|
149
|
+
|
|
150
|
+
`--otlp-out` writes the spans that were analysed. Anywhere this package
|
|
151
|
+
normalized a field to analyse it — an `end_time` that precedes its `start_time`,
|
|
152
|
+
a status code the contract does not recognise — the export writes what the
|
|
153
|
+
PRODUCER wrote and keeps the normalized value in an attribute beside it, so
|
|
154
|
+
`negative-duration` and `invalid-status` are still findings against the copy.
|
|
155
|
+
|
|
156
|
+
A row that never became a span is the one thing that cannot be re-emitted: the
|
|
157
|
+
artifact is also the file the analysts read, so a non-span line in it is garbage
|
|
158
|
+
fed to the analysis and a repaired one is invented work. The export refuses the
|
|
159
|
+
equivalence instead — it carries `traces.source.unreadable_rows` and the kinds
|
|
160
|
+
behind it, accumulating across every hop, and `validate` on a re-export leads
|
|
161
|
+
with how much of the original is missing from it. Round-tripping a defective
|
|
162
|
+
trace through `traces` cannot produce a clean bill of health.
|
|
163
|
+
|
|
164
|
+
`analyze` prints the same section, plus an **analyses skipped, and why** list —
|
|
165
|
+
and, crucially, carries that verdict INTO the report. A section whose inputs are
|
|
166
|
+
incomplete says so in its own heading and again directly above its table, so a
|
|
167
|
+
number and the reason it is wrong can never end up forty lines apart. A capability
|
|
168
|
+
the trace supports that this package has no analysis for yet is listed as
|
|
169
|
+
`⚠️ available, unused` rather than quietly dropped.
|
|
170
|
+
|
|
171
|
+
Two of those analyses are why the loop shape exists at all:
|
|
172
|
+
|
|
173
|
+
- **round-over-round convergence** — per `agent.loop.id`, the per-round outcome
|
|
174
|
+
and score series, and whether it improved, plateaued, regressed, or peaked and
|
|
175
|
+
fell back. The verdict is read from the round's own `agent.outcome` or from the
|
|
176
|
+
shallowest EVALUATOR span under it.
|
|
177
|
+
- **steering chain** — follows `links` (`agent.link.kind`) to report which verdict
|
|
178
|
+
caused which subsequent round. A link whose target is missing is kept and marked,
|
|
179
|
+
because a shorter chain than the producer recorded is the opposite of the truth.
|
|
180
|
+
|
|
181
|
+
Nothing is repaired on the way in. A span with an unreadable timestamp is
|
|
182
|
+
reported and excluded, because a synthesized value would put invented work into a
|
|
183
|
+
total.
|
|
184
|
+
|
|
68
185
|
## What it finds
|
|
69
186
|
|
|
70
187
|
The deterministic pass (free, no key) surfaces:
|
|
@@ -81,6 +198,10 @@ The deterministic pass (free, no key) surfaces:
|
|
|
81
198
|
|
|
82
199
|
## Supported harnesses
|
|
83
200
|
|
|
201
|
+
Adapters are the **legacy edge**: they exist for coding agents whose on-disk format we do not
|
|
202
|
+
control, and each is a translation from a proprietary session store onto the span model. They are
|
|
203
|
+
not the way to integrate a system you own — for that, [emit the contract](#integrate-your-own-system).
|
|
204
|
+
|
|
84
205
|
"Verified" = tested against real sessions; "fixture" = tested against schema-accurate fixtures (no real sessions available).
|
|
85
206
|
|
|
86
207
|
| Harness (aliases) | Reads from | Status |
|
|
@@ -116,7 +237,11 @@ traces analyze --harness claude-code --session <path> --latest-turn # latest tas
|
|
|
116
237
|
traces investigate --all --last 10 --out report.md # explicit investigation alias
|
|
117
238
|
traces improve --all --last 10 --dir .traces/improvement
|
|
118
239
|
traces analyze --all --since 2026-06-18 --out report.md
|
|
119
|
-
traces
|
|
240
|
+
traces validate spans.otlp.jsonl # conformance; exit 1 only when it is not a trace
|
|
241
|
+
traces validate results/sessions --out conformance.md # a whole directory of exports
|
|
242
|
+
traces analyze --otlp spans.otlp.jsonl # analyse foreign OTLP, no adapter
|
|
243
|
+
traces analyze --otlp results/sessions --out report.md
|
|
244
|
+
traces convert --harness claude-code --last 1 --otlp-out spans.jsonl # OTLP only
|
|
120
245
|
traces index --all --since 24h --out session-index.json
|
|
121
246
|
traces inspect session-index.json --out inspection-report.md
|
|
122
247
|
traces evidence --harness codex --last 20 --out policy-evidence.jsonl
|
|
@@ -124,13 +249,22 @@ traces evidence --harness codex-exec --session /tmp/codex.jsonl --cwd "$PWD" --o
|
|
|
124
249
|
traces export policy-evidence.jsonl --out spans.openinference.jsonl
|
|
125
250
|
traces import-codetracebench verified.jsonl --trajectory-dir normalized --out traces --revision <40-or-64-character-hex>
|
|
126
251
|
traces watch --all # live observer; loops + semantic findings
|
|
252
|
+
traces watch runs/my-run # live run tree: status, budget, driver vs child spend
|
|
253
|
+
traces watch runs/my-run --once # one snapshot, then exit
|
|
254
|
+
traces watch traces.otlp.jsonl # any OTLP span file, any emitter
|
|
255
|
+
traces analyze --supervisor-run-dir runs/my-run # the full tree report
|
|
127
256
|
traces stream --all --mode findings # low-volume semantic feed
|
|
128
257
|
traces stream --all --mode agent # findings + deterministic report events
|
|
129
258
|
traces stream spans.openinference.jsonl --format openinference --no-spans
|
|
130
259
|
traces upload --since 1h --dry-run # redact + dedup + preview, no network
|
|
131
260
|
traces upload --since 24h # upload last day to the Intelligence Platform
|
|
261
|
+
traces replay-verify --steps steps.json --image <docker-image> --at 37 --cwd /home --out ./replay-out \
|
|
262
|
+
--fix-command "<corrected step>" # executed proof: replay prefix, reproduce failure, show fix
|
|
132
263
|
```
|
|
133
264
|
|
|
265
|
+
`replay-verify` replays a CodeTraceBench-style trajectory prefix in a real sandbox and executes step k twice — recorded (does the failure reproduce?) and corrected (does it vanish?).
|
|
266
|
+
See [Replay verification](./docs/replay-verify.md) for setup, semantics, and honest limits (SWE-style trajectories with a docker image only; commands run as the non-root sandbox user).
|
|
267
|
+
|
|
134
268
|
| Flag | Meaning |
|
|
135
269
|
|---|---|
|
|
136
270
|
| `--harness <id>` | Harness or alias (default: `claude-code`) |
|
|
@@ -145,14 +279,17 @@ traces upload --since 24h # upload last day to the Inte
|
|
|
145
279
|
| `--since <t>` | `upload`: window, `30m`/`2h`/`7d` or ISO (default 24h); `analyze`: ISO cutoff |
|
|
146
280
|
| `--out <path>` | Write the report to a file |
|
|
147
281
|
| `--dir <path>` | `improve`: write the full artifact pack to this directory |
|
|
148
|
-
| `--otlp <
|
|
282
|
+
| `--otlp <file\|dir>` | **READ** OTLP-JSONL from any system, skipping the adapters; a directory reads the OTLP files under it (only `otlp/` when the producer made one) and names the JSONL that is not OTLP. `validate`, `analyze`, `investigate`, `improve`, `stream` |
|
|
283
|
+
| `--otlp-out <path>` | **WRITE** the OTLP artifact here (also evidence provenance / dry-run upload preview) |
|
|
149
284
|
| `--format <kind>` | File `analyze`, `export`, or `stream`: `auto`, `policy-evidence`, `sandbox-events`, `openinference`, `intelligence-spans`, or `chat-trajectory` |
|
|
150
285
|
| `--llm` / `--budget <usd>` | Enable agentic analysts (needs `TANGLE_API_KEY` + Python with `agent-eval-rpc[dspy]`) / cap their spend |
|
|
151
286
|
| `--config <path>` | `analyze` / `investigate` / `improve` / `stream`: load BYO analysts, live analysts, and external analyzers |
|
|
152
|
-
| `--interval <s>` / `--window <m>` | `watch` / live `stream`: poll seconds (
|
|
287
|
+
| `--interval <s>` / `--window <m>` | `watch` / live `stream`: poll seconds (sessions 5, run tree 2) / active-session window minutes (default 30) |
|
|
153
288
|
| `--min-loop <n>` | Identical repeated calls before flagging a loop (default 3) |
|
|
154
289
|
| `--mode <kind>` | `stream`: `visualizer` (spans + findings), `findings` (low-volume), or `agent` (findings + reports) |
|
|
155
|
-
| `--
|
|
290
|
+
| `--supervisor-run-dir <dir>` | `analyze`: report one run tree; `watch`: tail it live |
|
|
291
|
+
| `--replay` | `stream`: scan once, then exit |
|
|
292
|
+
| `--once` | `stream`: scan once; `watch <target>`: print ONE snapshot and exit |
|
|
156
293
|
| `--no-spans` / `--no-findings` | `stream`: suppress raw span rows / finding rows |
|
|
157
294
|
| `--no-content` | `upload`: send metadata only; strip all prompt/response text |
|
|
158
295
|
| `--dry-run` / `--yes` | `upload`: preview without sending / skip the confirm prompt |
|
|
@@ -207,6 +344,56 @@ export default {
|
|
|
207
344
|
}
|
|
208
345
|
```
|
|
209
346
|
|
|
347
|
+
## Watch a run tree
|
|
348
|
+
|
|
349
|
+
`traces watch <target>` tails ONE run that fans work out to other agents, instead of one harness session.
|
|
350
|
+
It prints the tree at any depth: per node the status, the runtime, the authored budget, and the actual spend.
|
|
351
|
+
Plain stdout, no cursor control, no extra dependency — it works over SSH, in a CI log, and through a pipe.
|
|
352
|
+
|
|
353
|
+
```bash
|
|
354
|
+
traces watch runs/my-run # live: reprints only when something changed
|
|
355
|
+
traces watch runs/my-run --once # one snapshot, for a script or an agent
|
|
356
|
+
traces watch traces.otlp.jsonl # spans only, for any emitter
|
|
357
|
+
```
|
|
358
|
+
|
|
359
|
+
Two sources sit behind the one verb, and the output always names which number came from which:
|
|
360
|
+
|
|
361
|
+
| Source | Reads | Gives you | Cannot give you |
|
|
362
|
+
|---|---|---|---|
|
|
363
|
+
| **General** — OTLP spans | `trace_id` / `span_id` / `parent_span_id` in any `*.otlp.jsonl`, `*.spans.jsonl`, `*.traces.jsonl` | tree shape, wall time, per-turn tokens, cost when the emitter priced it | the authored budget — no span vocabulary carries one |
|
|
364
|
+
| **Specific** — the spawn journal | `spawn-journal.jsonl` written by agent-runtime's `createFileRunContext` | authored budget, settled spend, settlement status, blocking questions, steers, the typed result | per-turn detail the journal does not tap |
|
|
365
|
+
|
|
366
|
+
The general source is the one that matters for a system nobody has written yet: anything that emits a parent span pointer gets a tree, whether it is a supervisor, a pi session, a Claude subagent fan-out, or a custom fanout.
|
|
367
|
+
Attributes are read through `@tangle-network/agent-eval/trace-attributes` alias lists, so both live vocabularies — OpenInference's `llm.token_count.*` and GenAI semconv's `gen_ai.usage.*` — already work, and no key is invented here.
|
|
368
|
+
|
|
369
|
+
Two rules the view will not bend on:
|
|
370
|
+
|
|
371
|
+
- **Driver inference and child work never merge.** A node that drove and the work it delegated are separate lines, because one total cannot answer "which half spent the budget" — the decisive question in three real runs.
|
|
372
|
+
- **Unknown is never rendered as zero.** A turn the harness did not price reads `cost unknown (n unpriced)`, never `$0.0000`. A recorded `$0` paid on real tokens is printed AND flagged, because "free" and "unmetered" are different facts.
|
|
373
|
+
|
|
374
|
+
```
|
|
375
|
+
run proof-harness-mcp-20260731i
|
|
376
|
+
2 node(s) · depth 1 · elapsed 9m59s
|
|
377
|
+
driver total in 639,632 · out 35,077 · $0.0000 (zero across 58 priced)
|
|
378
|
+
worker total in 47,965 · out 515 · cost unknown (1 unpriced)
|
|
379
|
+
|
|
380
|
+
● · root [pending] supervisor inline budget 12it/400,000tok/$2.00/15m00s
|
|
381
|
+
driver 58 turn(s) · in 639,632 · out 35,077 · $0.0000 (zero across 58 priced) · 169% tok of budget
|
|
382
|
+
children 1 settled · in 47,965 · out 515 · cost unknown (1 unpriced)
|
|
383
|
+
└─ ✗ artifact-writer-s0 [failed] worker pi budget 6it/80,000tok wall 20.8s
|
|
384
|
+
settled 3it · in 47,965 · out 515 · cost unknown (1 unpriced) · 50% it, 61% tok of budget
|
|
385
|
+
|
|
386
|
+
! spend recorded $0 with tokens spent: usdKnown was never set false, so this reads as FREE rather
|
|
387
|
+
than unmetered. A harness-billed brain (a CLI on a subscription) looks exactly like this.
|
|
388
|
+
|
|
389
|
+
RESULT no-winner · budget-exhausted
|
|
390
|
+
```
|
|
391
|
+
|
|
392
|
+
`traces analyze --supervisor-run-dir <dir>` writes the full report for the same run.
|
|
393
|
+
Every metric there comes from `@tangle-network/agent-eval/supervisor-run`; this package contributes a reader, never an analysis.
|
|
394
|
+
|
|
395
|
+
Replay and resume are a separate concern: they belong to the durable spawn journal, and nothing here routes them through telemetry.
|
|
396
|
+
|
|
210
397
|
## Improvement engine
|
|
211
398
|
|
|
212
399
|
`traces improve` turns observed sessions into a portable improvement packet:
|
|
@@ -266,7 +453,7 @@ It is intentionally read-only: it points to repeated-call loops, high tool-error
|
|
|
266
453
|
`traces` does **not** emit benchmark campaign cells. It emits normalized coding-agent session evidence that another system can mine.
|
|
267
454
|
|
|
268
455
|
```bash
|
|
269
|
-
traces evidence --all --since 24h --out policy-evidence.jsonl --otlp spans.otlp.jsonl
|
|
456
|
+
traces evidence --all --since 24h --out policy-evidence.jsonl --otlp-out spans.otlp.jsonl
|
|
270
457
|
```
|
|
271
458
|
|
|
272
459
|
`--last` follows recent file activity and may select a child session in multi-agent work.
|
|
@@ -408,15 +595,15 @@ const profile = { name: 'trace-reviewer', resources: { skills } }
|
|
|
408
595
|
|
|
409
596
|
## Release automation
|
|
410
597
|
|
|
411
|
-
|
|
598
|
+
Releases use a reviewed version commit because `main` is protected:
|
|
412
599
|
|
|
413
|
-
1.
|
|
414
|
-
2.
|
|
415
|
-
3.
|
|
416
|
-
4. The
|
|
600
|
+
1. Update `package.json` and `pnpm-lock.yaml` to the intended version on a branch.
|
|
601
|
+
2. Merge that change through a pull request.
|
|
602
|
+
3. Tag the exact merge commit as `vX.Y.Z` and push the tag.
|
|
603
|
+
4. The Publish workflow verifies that the tag is merged into `main` and matches `package.json`, then builds, publishes to npm, and creates a GitHub release.
|
|
417
604
|
5. `pnpm check:package` proves the npm tarball contains the `traces` binary before release.
|
|
418
605
|
|
|
419
|
-
|
|
606
|
+
To retry a failed publish without changing source or version, manually run the Publish workflow with the existing tag.
|
|
420
607
|
|
|
421
608
|
## Library (SDK)
|
|
422
609
|
|
|
@@ -424,6 +611,16 @@ The CLI is a thin consumer of these exports.
|
|
|
424
611
|
|
|
425
612
|
| Export | Signature | Use |
|
|
426
613
|
|---|---|---|
|
|
614
|
+
| `readOtlpInput` | `(file\|dir) → { files, skipped, rows, spans, validation, issues }` | ingest OTLP from **any** system — no adapter; never throws on a foreign trace |
|
|
615
|
+
| `validateTraceSpans` | `(spans) → { ok, findings, capabilities }` | the contract's conformance check, re-exported |
|
|
616
|
+
| `conformanceOfSpans` | `(spans) → TraceValidation` | grade spans this package produced, on the artifact a consumer receives |
|
|
617
|
+
| `renderValidation` / `renderConformance` | `(validation, opts) → string` | the `validate` report / the section embedded in an analysis report |
|
|
618
|
+
| `skippedAnalyses` | `(validation) → SkippedAnalysis[]` | which analyses a missing capability empties, and why |
|
|
619
|
+
| `unavailableCapabilities` / `incompleteInputsNote` | `(validation) → Map` / `(map, name) → string` | the gate: what the trace cannot support, and the marker each affected section carries |
|
|
620
|
+
| `summarizeSpanStructure` | `(spans) → SpanStructure` | how much of the tree attaches: rootless, orphans, links |
|
|
621
|
+
| `analyzeLoopConvergence` | `(spans) → LoopConvergenceReport` | per loop, the per-round outcome/score series and whether it improved, plateaued, regressed or fell back |
|
|
622
|
+
| `analyzeSteeringChain` | `(spans) → SteeringChainReport` | which verdict span caused which subsequent round, following `links` |
|
|
623
|
+
| `llmSpan` / `toolSpan` / `loopSpan` / `branchSpan` / `steeredBy` | contract builders, re-exported | emit conforming spans from your own system |
|
|
427
624
|
| `analyzeSpans` | `(spans, { registry?, ai?, budgetUsd? }) → AnalyzeResult` | run built-in analysts, or **your own** via `registry` |
|
|
428
625
|
| `runTraceInvestigation` | `(TraceInvestigationOptions) → TraceInvestigationResult` | typed findings with actions/checks, execution facts, external analyzer output, and report |
|
|
429
626
|
| `runTraceImprovement` | `(TraceImprovementOptions) → TraceImprovementResult` | writes the full findings, evidence, report, and trace artifact pack |
|
|
@@ -452,7 +649,15 @@ The CLI is a thin consumer of these exports.
|
|
|
452
649
|
| `ExternalAnalyzer` / `Redactor` | `haloAnalyzer` / `hodoscopeAnalyzer` / `commandAnalyzer` / `commandRedactor` | drive engines/models you install |
|
|
453
650
|
|
|
454
651
|
```ts
|
|
455
|
-
import {
|
|
652
|
+
import {
|
|
653
|
+
AnalystRegistry, analyzeSpans, makeFinding, readOtlpInput, renderValidation,
|
|
654
|
+
streamSessions, watchSessions,
|
|
655
|
+
} from '@tangle-network/traces'
|
|
656
|
+
|
|
657
|
+
// Read OTLP any system emitted, and find out what it can answer before analysing:
|
|
658
|
+
const input = await readOtlpInput('spans.otlp.jsonl') // or a directory
|
|
659
|
+
console.log(renderValidation(input.validation, { subject: 'spans.otlp.jsonl', spans: input.spans }))
|
|
660
|
+
if (input.validation.ok) await analyzeSpans(input.spans)
|
|
456
661
|
|
|
457
662
|
// Observe live sessions, feed findings anywhere (read-only, cancellable):
|
|
458
663
|
const c = new AbortController()
|