@qe-mcp/ena 0.0.0-stage → 0.1.17
This diff represents the content of publicly available package versions that have been released to one of the supported registries. The information contained in this diff is provided for informational purposes only and reflects changes between package versions as they appear in their respective public registries.
- package/README.md +612 -2
- package/fonts/Inter-Bold.ttf +0 -0
- package/fonts/Inter-Regular.ttf +0 -0
- package/fonts/OFL.txt +93 -0
- package/fonts/README.md +4 -0
- package/hooks/ena-privacy-gate.mjs +31 -0
- package/lines.js +349 -0
- package/manifest.json +120 -0
- package/package.json +42 -4
- package/server.js +3449 -0
- package/skill/ena-analysis/SKILL.md +348 -0
- package/webena.js +651 -0
- package/xlsx.js +130 -0
package/README.md
CHANGED
|
@@ -1,3 +1,613 @@
|
|
|
1
|
-
#
|
|
1
|
+
# @qe-mcp/ena
|
|
2
2
|
|
|
3
|
-
|
|
3
|
+
An MCP server that lets Claude and other AI assistants run
|
|
4
|
+
[Epistemic Network Analysis (ENA)](https://www.epistemicnetwork.org/), ordered
|
|
5
|
+
network analysis (ONA) and transmodal analysis (TMA) on your coded data. The
|
|
6
|
+
analysis runs **on your machine** — no R or Python — and only results go to
|
|
7
|
+
the assistant.
|
|
8
|
+
|
|
9
|
+
## Get started
|
|
10
|
+
|
|
11
|
+
In Claude Desktop, open the **Code** tab (or Claude Code in a terminal) and
|
|
12
|
+
send:
|
|
13
|
+
|
|
14
|
+
```
|
|
15
|
+
Install ENA from https://qe-libs.org/mcp/qe-mcp-ena/
|
|
16
|
+
```
|
|
17
|
+
|
|
18
|
+
It downloads the bundle and opens the install dialog; click **Install**, then
|
|
19
|
+
restart Claude Desktop. In a new chat, ask *"What ENA tools do you have?"* —
|
|
20
|
+
it should list 14 — and then ask about your data, by file path: *"Is
|
|
21
|
+
/Users/me/data/coded.csv suitable for ENA?"*
|
|
22
|
+
|
|
23
|
+
**By hand** (no Claude Code): download
|
|
24
|
+
[`qe-mcp-ena.mcpb`](https://qe-libs.org/mcp/qe-mcp-ena/qe-mcp-ena.mcpb),
|
|
25
|
+
double-click it (or drag it into **Settings → Extensions**), click
|
|
26
|
+
**Install**, and restart Claude Desktop.
|
|
27
|
+
|
|
28
|
+
Using another app? See [Other apps](#other-apps).
|
|
29
|
+
|
|
30
|
+
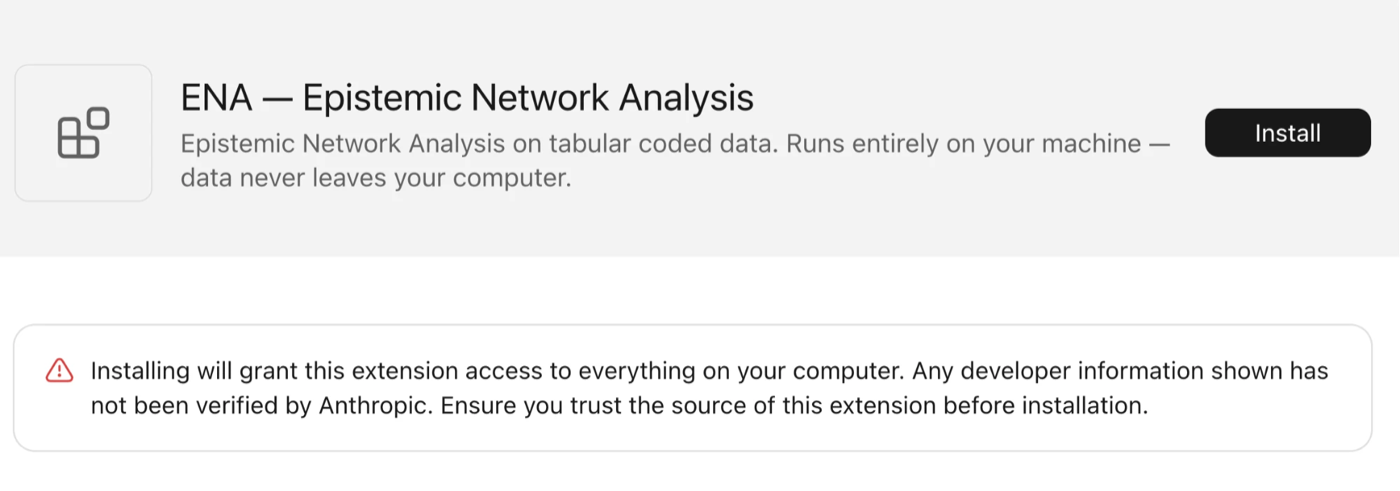
### The install warning
|
|
31
|
+
|
|
32
|
+
|
|
33
|
+
|
|
34
|
+
Claude Desktop shows this for every extension outside Anthropic's reviewed
|
|
35
|
+
directory. An extension is a program that runs under your account, so you are
|
|
36
|
+
trusting its source — as with an R package from GitHub. This one reads the data
|
|
37
|
+
files you name, writes files only when you ask for an export, makes no network
|
|
38
|
+
connections and starts no other programs. Its code is on
|
|
39
|
+
[npm](https://www.npmjs.com/package/@qe-mcp/ena).
|
|
40
|
+
|
|
41
|
+
### Working with it
|
|
42
|
+
|
|
43
|
+
- **Give a file path, not pasted data.** The server reads the file itself; the
|
|
44
|
+
rows stay on your machine. See [Privacy](#privacy).
|
|
45
|
+
- **Describe the analysis in words.** No tool or parameter names needed — see
|
|
46
|
+
[Prompts](#prompts).
|
|
47
|
+
- **The analysis guide is built in.** The assistant reads it (`ena_guide`)
|
|
48
|
+
before the first analysis. Apps with MCP prompts (Claude Desktop's **+**
|
|
49
|
+
menu, `/` in Claude Code) also offer `analyze_data`, `compare_groups` and
|
|
50
|
+
`order_and_sequence` as starting points.
|
|
51
|
+
- **Optional skill.** The same guide as a Claude skill, `ena-analysis.zip`, is
|
|
52
|
+
on the ENA page. It lets Claude pick up the workflow from the first
|
|
53
|
+
mention of coded data, before any tool is called: upload it under
|
|
54
|
+
**Customize → Skills**, or unzip it into `~/.claude/skills/` for Claude Code.
|
|
55
|
+
It doesn't update itself, so download it again when you upgrade.
|
|
56
|
+
|
|
57
|
+
## Other apps
|
|
58
|
+
|
|
59
|
+
Every app except the Claude Desktop extension runs
|
|
60
|
+
`npx --yes @qe-mcp/ena` and needs **Node.js 18 or later**. Name the
|
|
61
|
+
server `ena`. Afterwards, open a new conversation and ask *"What ENA tools do
|
|
62
|
+
you have?"* (in VS Code and Cursor, in agent mode).
|
|
63
|
+
|
|
64
|
+
### Claude Code
|
|
65
|
+
|
|
66
|
+
```bash
|
|
67
|
+
claude mcp add --scope user ena -- npx --yes @qe-mcp/ena
|
|
68
|
+
```
|
|
69
|
+
|
|
70
|
+
`--scope user` makes it available in every project; leave it out for the
|
|
71
|
+
current project only. Check with `claude mcp list`.
|
|
72
|
+
|
|
73
|
+
### Claude Desktop, without the extension
|
|
74
|
+
|
|
75
|
+
**Settings → Developer → Edit Config**, or edit the file directly — macOS:
|
|
76
|
+
`~/Library/Application Support/Claude/claude_desktop_config.json`; Windows:
|
|
77
|
+
`%APPDATA%\Claude\claude_desktop_config.json`:
|
|
78
|
+
|
|
79
|
+
```json
|
|
80
|
+
{
|
|
81
|
+
"mcpServers": {
|
|
82
|
+
"ena": {
|
|
83
|
+
"command": "npx",
|
|
84
|
+
"args": ["--yes", "@qe-mcp/ena"]
|
|
85
|
+
}
|
|
86
|
+
}
|
|
87
|
+
}
|
|
88
|
+
```
|
|
89
|
+
|
|
90
|
+
Quit Claude Desktop completely (on Windows, from the system tray too) and
|
|
91
|
+
reopen it. If Windows can't find `npx`, use `"command": "cmd"` and
|
|
92
|
+
`"args": ["/c", "npx", "--yes", "@qe-mcp/ena"]`.
|
|
93
|
+
|
|
94
|
+
### Cursor and Windsurf
|
|
95
|
+
|
|
96
|
+
The same `mcpServers` block, in `~/.cursor/mcp.json` (or `.cursor/mcp.json`
|
|
97
|
+
for one project) or `~/.codeium/windsurf/mcp_config.json`. Then enable `ena`
|
|
98
|
+
in the app's MCP settings.
|
|
99
|
+
|
|
100
|
+
### VS Code
|
|
101
|
+
|
|
102
|
+
For GitHub Copilot in agent mode: `.vscode/mcp.json`, or **MCP: Add Server**
|
|
103
|
+
from the Command Palette. The top-level key is `servers`:
|
|
104
|
+
|
|
105
|
+
```json
|
|
106
|
+
{
|
|
107
|
+
"servers": {
|
|
108
|
+
"ena": {
|
|
109
|
+
"type": "stdio",
|
|
110
|
+
"command": "npx",
|
|
111
|
+
"args": ["--yes", "@qe-mcp/ena"]
|
|
112
|
+
}
|
|
113
|
+
}
|
|
114
|
+
}
|
|
115
|
+
```
|
|
116
|
+
|
|
117
|
+
### Anything else
|
|
118
|
+
|
|
119
|
+
Any client that runs local (stdio) MCP servers: command `npx`, arguments
|
|
120
|
+
`--yes @qe-mcp/ena`. Where a client doesn't show images, plots come back
|
|
121
|
+
as file paths. The guide and the privacy instructions reach every client; only
|
|
122
|
+
the privacy hook is Claude-specific.
|
|
123
|
+
|
|
124
|
+
### Dev builds and local installs
|
|
125
|
+
|
|
126
|
+
Dev builds are on the QE GitLab registry under the `dev` tag:
|
|
127
|
+
|
|
128
|
+
```bash
|
|
129
|
+
echo "@qe-mcp:registry=https://gitlab.com/api/v4/projects/22522458/packages/npm/" >> ~/.npmrc
|
|
130
|
+
echo "@qe-libs:registry=https://gitlab.com/api/v4/projects/22522458/packages/npm/" >> ~/.npmrc
|
|
131
|
+
npx --yes @qe-mcp/ena@dev
|
|
132
|
+
```
|
|
133
|
+
|
|
134
|
+
Pinned: `npm install -g @qe-mcp/ena`, then command `qe-mcp-ena`. From
|
|
135
|
+
a clone: `npm install`, then command `node` with
|
|
136
|
+
`/absolute/path/to/qe-mcp-ena/server.js`.
|
|
137
|
+
|
|
138
|
+
### Installing with an assistant
|
|
139
|
+
|
|
140
|
+
If you've been asked to install this from the page: in Claude Code, run the
|
|
141
|
+
`claude mcp add` command under [Claude Code](#claude-code). For Claude
|
|
142
|
+
Desktop, download the current bundle and open it — the install dialog
|
|
143
|
+
appears, and the user clicks **Install**:
|
|
144
|
+
|
|
145
|
+
```bash
|
|
146
|
+
curl -L -o ~/Downloads/qe-mcp-ena.mcpb https://qe-libs.org/mcp/qe-mcp-ena/qe-mcp-ena.mcpb && open ~/Downloads/qe-mcp-ena.mcpb
|
|
147
|
+
```
|
|
148
|
+
|
|
149
|
+
```powershell
|
|
150
|
+
Invoke-WebRequest https://qe-libs.org/mcp/qe-mcp-ena/qe-mcp-ena.mcpb -OutFile "$HOME\Downloads\qe-mcp-ena.mcpb"; Start-Process "$HOME\Downloads\qe-mcp-ena.mcpb"
|
|
151
|
+
```
|
|
152
|
+
|
|
153
|
+
Then have the user restart Claude Desktop and ask *"What ENA tools do you
|
|
154
|
+
have?"* — 14 tools means it worked. Without a shell, walk them through the
|
|
155
|
+
manual install under [Get started](#get-started). Don't edit
|
|
156
|
+
`claude_desktop_config.json` for the extension, and never ask for the data to
|
|
157
|
+
be pasted. A plain-text copy of this page is at
|
|
158
|
+
[llms.txt](https://qe-libs.org/mcp/qe-mcp-ena/llms.txt).
|
|
159
|
+
|
|
160
|
+
## Prompts
|
|
161
|
+
|
|
162
|
+
Describe what you want; the assistant picks the tools. These use the columns
|
|
163
|
+
of rENA's `RS.data` sample — units `Condition` and `UserName`, conversations
|
|
164
|
+
`Condition` and `GroupName`, codes such as `Data` and `Design Reasoning`, and
|
|
165
|
+
the unit-level variable `CONFIDENCE.Change`.
|
|
166
|
+
|
|
167
|
+
### Getting started
|
|
168
|
+
|
|
169
|
+
```
|
|
170
|
+
I have coded discourse data at /path/to/data.csv. Is it suitable for ENA?
|
|
171
|
+
```
|
|
172
|
+
|
|
173
|
+
```
|
|
174
|
+
What columns are in /path/to/data.csv? It's confidential — don't read the rows.
|
|
175
|
+
```
|
|
176
|
+
|
|
177
|
+
```
|
|
178
|
+
Analyze /path/to/data.csv with ENA.
|
|
179
|
+
```
|
|
180
|
+
|
|
181
|
+
### Fitting a model
|
|
182
|
+
|
|
183
|
+
```
|
|
184
|
+
Fit ENA with units Condition and UserName, conversations Condition and GroupName, and codes Data, Technical Constraints and Design Reasoning.
|
|
185
|
+
```
|
|
186
|
+
|
|
187
|
+
```
|
|
188
|
+
What window size does this data support?
|
|
189
|
+
```
|
|
190
|
+
|
|
191
|
+
```
|
|
192
|
+
Refit with a window of 6.
|
|
193
|
+
```
|
|
194
|
+
|
|
195
|
+
```
|
|
196
|
+
Model only the students, but keep the mentors' lines as context.
|
|
197
|
+
```
|
|
198
|
+
|
|
199
|
+
```
|
|
200
|
+
Leave out the Data & Technical Constraints connection — it's an artifact of the task.
|
|
201
|
+
```
|
|
202
|
+
|
|
203
|
+
```
|
|
204
|
+
Can this model be simplified? Drop the codes it doesn't need.
|
|
205
|
+
```
|
|
206
|
+
|
|
207
|
+
```
|
|
208
|
+
Fit the post-test data in the same space as the pre-test model.
|
|
209
|
+
```
|
|
210
|
+
|
|
211
|
+
### Comparing groups
|
|
212
|
+
|
|
213
|
+
```
|
|
214
|
+
Compare FirstGame and SecondGame.
|
|
215
|
+
```
|
|
216
|
+
|
|
217
|
+
```
|
|
218
|
+
Is the difference on dimension 1 significant?
|
|
219
|
+
```
|
|
220
|
+
|
|
221
|
+
```
|
|
222
|
+
Show me the subtraction network.
|
|
223
|
+
```
|
|
224
|
+
|
|
225
|
+
### Rotating by a variable
|
|
226
|
+
|
|
227
|
+
```
|
|
228
|
+
Fit ENA with dimension 1 representing CONFIDENCE.Change.
|
|
229
|
+
```
|
|
230
|
+
|
|
231
|
+
```
|
|
232
|
+
Put CONFIDENCE.Change on the x-axis, controlling for Condition.
|
|
233
|
+
```
|
|
234
|
+
|
|
235
|
+
### Order and sequence
|
|
236
|
+
|
|
237
|
+
```
|
|
238
|
+
Fit an ordered network model — which codes tend to follow which?
|
|
239
|
+
```
|
|
240
|
+
|
|
241
|
+
```
|
|
242
|
+
Fit TMA with Modality as the mode column: chat lines look back 4 lines, tool actions only 1.
|
|
243
|
+
```
|
|
244
|
+
|
|
245
|
+
```
|
|
246
|
+
Measure the window in time: 2 minutes, using the Timestamp column.
|
|
247
|
+
```
|
|
248
|
+
|
|
249
|
+
### Plots and files
|
|
250
|
+
|
|
251
|
+
```
|
|
252
|
+
Show unit FirstGame__steven z.
|
|
253
|
+
```
|
|
254
|
+
|
|
255
|
+
```
|
|
256
|
+
Hide the weak connections and make the labels bigger — it's for a slide.
|
|
257
|
+
```
|
|
258
|
+
|
|
259
|
+
```
|
|
260
|
+
Save the points and line weights as CSV so I can load them in R.
|
|
261
|
+
```
|
|
262
|
+
|
|
263
|
+
```
|
|
264
|
+
Export this model so I can open it in the ENA Web Tool.
|
|
265
|
+
```
|
|
266
|
+
|
|
267
|
+
### Back to the data
|
|
268
|
+
|
|
269
|
+
```
|
|
270
|
+
Show me the lines behind Data & Design Reasoning for FirstGame, with the text column.
|
|
271
|
+
```
|
|
272
|
+
|
|
273
|
+
## Privacy
|
|
274
|
+
|
|
275
|
+
The analysis runs in the server, on your machine. What reaches the AI model —
|
|
276
|
+
and the provider behind your app — depends on how the data gets there:
|
|
277
|
+
|
|
278
|
+
| How the data gets there | What the model sees |
|
|
279
|
+
|---|---|
|
|
280
|
+
| A file path (`data_path`) | No raw rows — only results |
|
|
281
|
+
| Inline CSV (`data_csv`) | The whole CSV. For small demo data only |
|
|
282
|
+
| Pasted into the chat, or opened with the app's own file tools | Everything pasted or read |
|
|
283
|
+
|
|
284
|
+
**Results still contain** the unit labels (the values of your unit columns —
|
|
285
|
+
pseudonymize the file first if they identify people), the group values you
|
|
286
|
+
name, `ena_profile`'s values for columns with 10 or fewer distinct values, and
|
|
287
|
+
derived statistics. Errors never quote the data file. Two tools write files
|
|
288
|
+
that do contain your data — `ena_export` (a ZIP with the data file, for the ENA
|
|
289
|
+
Web Tool) and `ena_lines` (a viewer with rows of it) — so treat those like the
|
|
290
|
+
data file.
|
|
291
|
+
|
|
292
|
+
**The server tells the model** to use file paths, never to open the data file
|
|
293
|
+
with other tools, and to ask for a path instead of pasted data: in its
|
|
294
|
+
instructions to every MCP client, in the tool descriptions and in the guide.
|
|
295
|
+
These are instructions, not enforcement. To enforce them, keep the assistant
|
|
296
|
+
out of your data folder with the app's permissions — in Claude Code, a deny
|
|
297
|
+
rule such as `Read(./data/**)` in `.claude/settings.json`, plus the hook below.
|
|
298
|
+
|
|
299
|
+
**Results come only from the server.** Every number and plot should come from
|
|
300
|
+
this server, never from code the assistant writes; the server and every tool
|
|
301
|
+
error say so. Each result carries `provenance` (e.g.
|
|
302
|
+
`@qe-mcp/ena 0.1.17 (rena-wasm 0.1.14)`), the interactive plot names it
|
|
303
|
+
in its footer and the SVG in its `<desc>`. A plot or table without it didn't
|
|
304
|
+
come from this server.
|
|
305
|
+
|
|
306
|
+
### Privacy gate hook (Claude Code)
|
|
307
|
+
|
|
308
|
+
The hook blocks any `data_csv` payload over 50 rows. Copy the script (it ships
|
|
309
|
+
in the npm package and the repository):
|
|
310
|
+
|
|
311
|
+
```bash
|
|
312
|
+
mkdir -p ~/.claude/hooks
|
|
313
|
+
cp hooks/ena-privacy-gate.mjs ~/.claude/hooks/
|
|
314
|
+
```
|
|
315
|
+
|
|
316
|
+
Then add to `~/.claude/settings.json`, replacing `YOUR_USERNAME` (if you
|
|
317
|
+
already have a `PreToolUse` list, add the entry to it):
|
|
318
|
+
|
|
319
|
+
```json
|
|
320
|
+
{
|
|
321
|
+
"hooks": {
|
|
322
|
+
"PreToolUse": [
|
|
323
|
+
{
|
|
324
|
+
"matcher": "mcp__ena__.*",
|
|
325
|
+
"hooks": [
|
|
326
|
+
{
|
|
327
|
+
"type": "command",
|
|
328
|
+
"command": "node /Users/YOUR_USERNAME/.claude/hooks/ena-privacy-gate.mjs"
|
|
329
|
+
}
|
|
330
|
+
]
|
|
331
|
+
}
|
|
332
|
+
]
|
|
333
|
+
}
|
|
334
|
+
}
|
|
335
|
+
```
|
|
336
|
+
|
|
337
|
+
The matcher covers every tool of a server named `ena`. It takes effect without
|
|
338
|
+
a restart. If you installed the hook before 0.1.12, copy it again: earlier
|
|
339
|
+
versions only warned instead of blocking.
|
|
340
|
+
|
|
341
|
+
## Reference
|
|
342
|
+
|
|
343
|
+
### Tools
|
|
344
|
+
|
|
345
|
+
| Tool | What it does |
|
|
346
|
+
|---|---|
|
|
347
|
+
| `ena_guide` | The analysis guide — workflow, rotations, ONA/TMA, reading results. Called before the first analysis |
|
|
348
|
+
| `ena_profile` | Column names, counts and binary detection for a local CSV — no row data |
|
|
349
|
+
| `ena_inspect` | Is the data ENA-shaped? Suggests codes, units and conversations |
|
|
350
|
+
| `ena_window` | Estimates the window size from the data (Cross-Covariance Decay, = rENA `ena.ccd`) |
|
|
351
|
+
| `ena_fit` | Fits an ENA model and plots it; returns a `model_id` |
|
|
352
|
+
| `ena_compare_groups` | Two-group model, rotated through the groups as the ENA Web Tool does, with per-dimension tests |
|
|
353
|
+
| `tma_fit` | Fits a directed ONA or TMA model and plots it |
|
|
354
|
+
| `ena_plot` | Another view of a fitted model: all units, a group, two groups overlaid, subtraction, one unit |
|
|
355
|
+
| `ena_accumulate` / `tma_accumulate` | The accumulation step only: raw per-unit networks |
|
|
356
|
+
| `ena_export` | Writes a fitted model as an ENA Web Tool project ZIP, to open there as the same model and plot |
|
|
357
|
+
| `ena_simplify` | Simplifies a model with PRIA, the web tool's Simplify Model: removes the codes it can do without, and refits |
|
|
358
|
+
| `ena_lines` | Shows the lines behind a connection in a local viewer — the web tool's Data View — with every window the model counted |
|
|
359
|
+
| `ena_tables` | Writes a fitted model's points, node positions, line weights and connection counts as CSV files |
|
|
360
|
+
|
|
361
|
+
### Fit options
|
|
362
|
+
|
|
363
|
+
All fit and accumulate tools take `data_path` — a `.csv` or `.xlsx` file (the
|
|
364
|
+
first worksheet, as in the ENA Web Tool) — or `data_csv`, with `units`,
|
|
365
|
+
`conversations` and `codes`. Options:
|
|
366
|
+
|
|
367
|
+
| Option | Meaning |
|
|
368
|
+
|---|---|
|
|
369
|
+
| `window_size` | Lines to look back, or `"Inf"` for every earlier line in the conversation. Omitted: the `ena_window` estimate (as a new set in the ENA Web Tool takes), or 4 when the data is too sparse for one. |
|
|
370
|
+
| `binary` | Count each line's co-occurrences as present/absent (default `true`). |
|
|
371
|
+
| `weight_model` | Weight each line's counts before summing per unit: `product` (raw), `sqrt`, `log` (= rENA `weight.by`). Overrides `binary`. |
|
|
372
|
+
| `units_used` | Model only these units (labels as in the results); other units' lines still count as context (= rENA `units.used`). |
|
|
373
|
+
| `mask_connections` | Connections to switch off, e.g. `["Data & Technical Constraints"]` — the ENA Web Tool's Code Masking Matrix. They count as 0 for every unit before normalization and rotation; for ordered models, `A & B` masks A → B only. Exported with `ena_export`. |
|
|
374
|
+
| `exclude_conversations` | Conversations to leave out, named by their conversation values joined by `::` (e.g. `FirstGame::Electric`). Their lines are removed before anything else — not modeled, not context — as the web tool's former R backend did for excluded horizons. |
|
|
375
|
+
| `order_by` | Order the lines by a column before windowing (the web tool's *Order*): ascending and stable, numeric when every value is a number. Row numbers in results still refer to the file. |
|
|
376
|
+
| `sphere_norm` | Normalize each unit network to length 1 (default `true`); `false` scales all by the longest, so network size counts. |
|
|
377
|
+
| `center_align_to_origin` | Keep units with empty networks at the origin and out of the centering (default `true`). Unordered models only. |
|
|
378
|
+
| `dims` | Dimensions to return (default 2). |
|
|
379
|
+
| `group_col`, `group1_value`, `group2_value` | Colour the plot by group, and test two groups on each dimension. `group_col` defaults to the first unit column when there are two or more. |
|
|
380
|
+
|
|
381
|
+
Repeated `ena_fit` / `ena_compare_groups` calls with the same options return
|
|
382
|
+
the cached model. `ena_plot` draws more views of a model by `model_id` without
|
|
383
|
+
refitting; `x_dim` / `y_dim` put any of the model's dimensions on the axes
|
|
384
|
+
(fits keep up to 6, as the ENA Web Tool does), and `flip_x` / `flip_y` mirror
|
|
385
|
+
them.
|
|
386
|
+
|
|
387
|
+
### Simplifying a model
|
|
388
|
+
|
|
389
|
+
`ena_simplify` runs PRIA — the ENA Web Tool's Simplify Model, the same
|
|
390
|
+
search as R's `PRIA::pria` — on a fitted model. It finds the largest set of
|
|
391
|
+
codes, up to `remove_num` (default 3) and never leaving fewer than 3, whose
|
|
392
|
+
removal keeps the model within `threshold` (default 0.95; 0.80–0.99) of the
|
|
393
|
+
full one. If codes can go, it refits without them, with the window and every
|
|
394
|
+
other setting unchanged, and returns the new model with `removed_codes`.
|
|
395
|
+
|
|
396
|
+
### Rotations
|
|
397
|
+
|
|
398
|
+
| `rotation` | Axes |
|
|
399
|
+
|---|---|
|
|
400
|
+
| *(omitted)* | As the ENA Web Tool rotates: with two or more unit columns and two or more values in the first (e.g. `Condition` in `["Condition", "UserName"]`), a GMR through that column's first two groups in data order — or `group1_value` / `group2_value` when `group_col` is that column — and the group tests on them; otherwise `svd`. `ena_compare_groups` always rotates this way through its two groups. |
|
|
401
|
+
| `svd` | The directions of most variance — exploratory. |
|
|
402
|
+
| `mean` | Dimension 1 runs through two group means (`group_col`, `group1_value`, `group2_value`). |
|
|
403
|
+
| `generalized` | Dimension 1 represents a unit-level variable (= rENA `ena.rotate.by.generalized`). |
|
|
404
|
+
| `rotation_from: <model_id>` | Project into another fitted model's space — the web tool's *Use Rotation Matrix From* (= rENA `rotation.set`). Same codes and network type required. |
|
|
405
|
+
|
|
406
|
+
With one categorical target and two groups, the web tool's GMR gives the same
|
|
407
|
+
axes as a means rotation.
|
|
408
|
+
|
|
409
|
+
**Projecting into another model** (`ena_fit`, `tma_fit`): `rotation_from`
|
|
410
|
+
takes a fitted model's `model_id`. The new model's units are centred and
|
|
411
|
+
rotated with the source's rotation and drawn with its node positions, so
|
|
412
|
+
the two share one space — a second cohort, a post-test, a held-out sample.
|
|
413
|
+
Points match rENA's `ena.make.set(..., rotation.set = source$rotation)`.
|
|
414
|
+
Exporting a projected model is refused: in the web tool the rotation comes
|
|
415
|
+
from another set in the same project.
|
|
416
|
+
|
|
417
|
+
**Generalized rotation** (`ena_fit`, `tma_fit`):
|
|
418
|
+
|
|
419
|
+
- `x_var` — the target column, then optional covariates, which are controlled
|
|
420
|
+
for by Lasso (with pairwise `interactions` unless set to `false`).
|
|
421
|
+
A categorical target puts dimension 1 (GMR1) through the group means; a
|
|
422
|
+
numeric one puts it along the variable.
|
|
423
|
+
- `y_var` — optional second target, for dimension 2 (GMR2).
|
|
424
|
+
- `select_2_groups` — fit GMR1 on two values of a categorical target; the plot
|
|
425
|
+
and group tests then use those two groups.
|
|
426
|
+
|
|
427
|
+
`x_var` and `y_var` must be unit-level — one value per unit, none missing. A
|
|
428
|
+
unit with a missing value is rejected (rENA errors there too); leave it out
|
|
429
|
+
with `units_used`. Results match rENA's to six decimal places, up to the sign
|
|
430
|
+
of each axis. GMR1 explains no more variance than the first SVD dimension
|
|
431
|
+
would: it's chosen for meaning, not variance.
|
|
432
|
+
|
|
433
|
+
### ONA and TMA
|
|
434
|
+
|
|
435
|
+
`tma_fit` builds **directed** networks: a connection A → B means code A was in
|
|
436
|
+
the window — the *ground* — when code B appeared — the *response*.
|
|
437
|
+
|
|
438
|
+
| Use | When |
|
|
439
|
+
|---|---|
|
|
440
|
+
| **ONA** (= R's `ona`) | Order matters: responses, sequences, what leads to what. Just units, conversations, codes and `window_size`. |
|
|
441
|
+
| **TMA** (= R's `tma`) | Lines differ in kind — chat vs logged actions, mentor vs student — and each kind should look back a different distance or count with a different weight. |
|
|
442
|
+
| `ena_fit` | Neither: undirected models are simpler to explain. |
|
|
443
|
+
|
|
444
|
+
| Option | Meaning |
|
|
445
|
+
|---|---|
|
|
446
|
+
| `ordered` | Directed networks (default `true`); `false` gives undirected networks from the same windows. |
|
|
447
|
+
| `stanza_modality` | Column whose value is the line's mode (e.g. `chat`, `log`). |
|
|
448
|
+
| `stanza_ground` | Column(s) whose value on the *ground* (earlier) line selects the window — e.g. who said it. |
|
|
449
|
+
| `stanza_response` | Column(s) whose value on the *responding* line selects the window. |
|
|
450
|
+
| `stanza_overrides` | Per-combination `{ path, window, weight }`; others use `window_size` and weight 1. |
|
|
451
|
+
| `window_type`, `time_column`, `time_unit` | `"time"` measures windows in time from `time_column`, in `secs` (default), `mins`, `hours`, `days` or `weeks`. Times can be numbers, `MM:SS`, `HH:MM:SS` or date-times. |
|
|
452
|
+
| `horizons` | `{ by, rules }`: each unit gets its own horizon of observation instead of the conversations (tma's HOO rules). |
|
|
453
|
+
|
|
454
|
+
**Override paths** list one value per factor: modality columns, then ground,
|
|
455
|
+
then response. With `stanza_modality: "Modality"` and `stanza_ground: ["Role"]`:
|
|
456
|
+
|
|
457
|
+
```json
|
|
458
|
+
"stanza_overrides": [
|
|
459
|
+
{ "path": ["log", "Student"], "window": 1 },
|
|
460
|
+
{ "path": ["chat", "Mentor"], "window": 6, "weight": 2 }
|
|
461
|
+
]
|
|
462
|
+
```
|
|
463
|
+
|
|
464
|
+
A path with the wrong number of values, or a value not in its column, is an
|
|
465
|
+
error naming the expected order.
|
|
466
|
+
|
|
467
|
+
**Horizons** — `{ "by": "Modality", "rules": { "chat": ["GroupName"], "log":
|
|
468
|
+
["UserName"] } }` puts a chat line in the horizon of every unit in the same
|
|
469
|
+
group, and a logged action only in its author's. Rows whose `by` value has no
|
|
470
|
+
rule are left out.
|
|
471
|
+
|
|
472
|
+
The rotations, group tests, `weight_model`, `units_used` and `sphere_norm` work
|
|
473
|
+
as in `ena_fit`. To compare two groups with ordered networks, use `tma_fit`
|
|
474
|
+
with `rotation: "mean"` — `ena_compare_groups` is undirected only.
|
|
475
|
+
|
|
476
|
+
**Reading directed results:** n codes give n² connections, named `"A & B"` for
|
|
477
|
+
A → B, including self-connections (A → A). Plots draw directed edges as tapered
|
|
478
|
+
shapes with direction marks, each direction weighted separately; read exact
|
|
479
|
+
weights from the results. In subtraction plots, an edge's colour shows which
|
|
480
|
+
group has more of that direction.
|
|
481
|
+
|
|
482
|
+
### Output
|
|
483
|
+
|
|
484
|
+
Every fit and plot returns:
|
|
485
|
+
|
|
486
|
+
- **`svg_plot`** — the network plot as SVG.
|
|
487
|
+
- **`interactive_plot`** — a self-contained interactive HTML version, with
|
|
488
|
+
live controls for the web tool's Plot Settings: minimum edge weight, edge
|
|
489
|
+
scale, text size, unconnected codes, code / unit / group labels, unit
|
|
490
|
+
points, and confidence and outlier boxes. Open it in a browser to fine-tune
|
|
491
|
+
a plot without going back through the assistant.
|
|
492
|
+
- **`png_plot`** and an **inline image**, shown in the chat by apps that
|
|
493
|
+
display tool images. PNGs come from the native `@resvg/resvg-js` where
|
|
494
|
+
`npm install` provides it, and otherwise — as in the Claude Desktop
|
|
495
|
+
extension — from `@resvg/resvg-wasm`, drawing labels with the bundled Inter
|
|
496
|
+
font.
|
|
497
|
+
|
|
498
|
+
Files go to the system temp folder under `ena-viz/<process id>/` and last until
|
|
499
|
+
the next restart.
|
|
500
|
+
|
|
501
|
+
`ena_plot` takes the same settings, for plots that come back in the chat or
|
|
502
|
+
go into a paper: `min_edge_weight` (the result reports `max_edge_weight` to
|
|
503
|
+
scale it by), `hide_unconnected_codes`, `text_size`, `colors`
|
|
504
|
+
(`{ "<group>": "<colour>" }`), `confidence_intervals` and `outlier_intervals`.
|
|
505
|
+
They change only the drawing, never the model.
|
|
506
|
+
|
|
507
|
+
Every fit also reports, per dimension, the **variance explained** and the
|
|
508
|
+
**goodness of fit**: Pearson and Spearman correlations between the distances of
|
|
509
|
+
the unit points and the distances of their network centroids (= rENA
|
|
510
|
+
`ena.correlations`, the ENA Web Tool's Goodness of Fit). Below 0.9, the plotted
|
|
511
|
+
points and the networks don't line up well enough to interpret the positions
|
|
512
|
+
of points by the nodes near them; the summary flags it.
|
|
513
|
+
|
|
514
|
+
### Lines behind a connection
|
|
515
|
+
|
|
516
|
+
`ena_lines` writes a local HTML viewer of the lines that produced a connection
|
|
517
|
+
for the units or group you choose, like the ENA Web Tool's Data View. Each line
|
|
518
|
+
that contributed is shown with the window of lines it was connected to, grouped
|
|
519
|
+
by conversation. The connection's codes are highlighted, and ground and
|
|
520
|
+
response roles are marked for ordered models. Lines outside any window collapse
|
|
521
|
+
into "… N lines …", which you can expand.
|
|
522
|
+
|
|
523
|
+
- **Exact.** The lines come from the model's own per-line counts, and the
|
|
524
|
+
windows follow libtma's window rule, for ENA, ONA and TMA (modes, overrides,
|
|
525
|
+
time windows, horizons). Every line of the selection is re-checked against
|
|
526
|
+
the model, and the result reports the check.
|
|
527
|
+
- **Columns.** By default the viewer shows what the web tool's Data View shows:
|
|
528
|
+
unit, conversation and code columns. Add others, such as the text, with
|
|
529
|
+
`columns`; any column can be switched on in the viewer.
|
|
530
|
+
- **Private.** The tool returns counts and data-row numbers (`window_rows`;
|
|
531
|
+
add 1 for the spreadsheet row) — never text. The viewer contains rows of your
|
|
532
|
+
data file, so treat it like the data file. The assistant is told not to open
|
|
533
|
+
it.
|
|
534
|
+
|
|
535
|
+
### Data tables
|
|
536
|
+
|
|
537
|
+
`ena_tables` writes a model's tables as CSV, as the ENA Web Tool's Download
|
|
538
|
+
Model does, into a new folder (by default next to the data file):
|
|
539
|
+
|
|
540
|
+
| File | Rows | Columns |
|
|
541
|
+
|---|---|---|
|
|
542
|
+
| `nodes.csv` | codes | `code`, then one column per dimension (`SVD1`, `GMR1`, ...) |
|
|
543
|
+
| `points.csv` | units | `ENA_UNIT`, then one column per dimension |
|
|
544
|
+
| `line-weights.csv` | units | `ENA_UNIT`, the unit columns, then one `A & B` column per connection (normalized) |
|
|
545
|
+
| `connection-counts.csv` | units | the same, with the raw accumulated counts |
|
|
546
|
+
|
|
547
|
+
They hold up to 6 dimensions, unscaled, with the same values as rENA's
|
|
548
|
+
`set$points`, `set$rotation$nodes`, `set$line.weights` and
|
|
549
|
+
`set$connection.counts`. For ordered models, `A & B` is A → B.
|
|
550
|
+
|
|
551
|
+
### Matching the ENA Web Tool
|
|
552
|
+
|
|
553
|
+
Defaults, plots and exports follow the ENA Web Tool, so a model fit here is
|
|
554
|
+
the same model, drawn the same way, once it is opened there. The conventions
|
|
555
|
+
are copied from the web tool into `webena.js` and kept in step with it.
|
|
556
|
+
|
|
557
|
+
- **Defaults**: the window (Cross-Covariance Decay) and the rotation (by the
|
|
558
|
+
first unit column's groups) above; units are grouped by the first unit
|
|
559
|
+
column, in the order the web tool lists them (integer-like values first,
|
|
560
|
+
then order of appearance); a single unit column makes one group of every
|
|
561
|
+
unit, named after it.
|
|
562
|
+
- **Plots** are the web tool's comparison plot: unit points scaled to the
|
|
563
|
+
network as its *Scale Units* does, group means with 95% confidence boxes,
|
|
564
|
+
group colours `#cc423a`, `#218ebf`, `#9d5dbb`, … in group order, axes
|
|
565
|
+
labelled with their variance (`GMR1 (30.91%)`), and the network of one
|
|
566
|
+
group, one unit, or group 1 − group 2. Group networks are the mean line
|
|
567
|
+
weights rescaled to 0.1–1, as the web tool draws them, so a subtraction is
|
|
568
|
+
the difference of those; the numbers in the results (`group1_networks`,
|
|
569
|
+
`subtraction_network`, `top_differential`) are the plain means. A
|
|
570
|
+
subtraction's strongest edge is drawn 4 px wide; `magnify` is the web tool's
|
|
571
|
+
*Scale edge weights* (default 1).
|
|
572
|
+
- **Export**: `ena_export` writes a project ZIP with the data file and a set
|
|
573
|
+
holding the units, conversations, codes, window, rotation, weight model,
|
|
574
|
+
sphere normalization, group colours and the plot to open with. In the web
|
|
575
|
+
tool, start a local session (*Run Offline*), click **Import** in the Sets
|
|
576
|
+
panel and open *Folder › <set name>*. Units left out with `units_used`
|
|
577
|
+
arrive excluded in the web tool's Units tab, `exclude_conversations` as
|
|
578
|
+
excluded horizons and `order_by` as the window Order; the web tool applies
|
|
579
|
+
them the same way.
|
|
580
|
+
A model the web tool has no setting for — transmodal or time windows, a GMR
|
|
581
|
+
on `x_var`, a rotation by a column other than the first unit column,
|
|
582
|
+
`center_align_to_origin: false` — is refused with the reason. The ZIP goes
|
|
583
|
+
next to the data file by default and never overwrites one.
|
|
584
|
+
|
|
585
|
+
### Group statistics
|
|
586
|
+
|
|
587
|
+
When two groups are named, results include a `stats` block for each dimension:
|
|
588
|
+
group n, mean, SD and median; a Welch t-test with Cohen's d; and a
|
|
589
|
+
Mann-Whitney U test with rank-biserial r — computed by libqe, the same code as
|
|
590
|
+
rENA's group tests.
|
|
591
|
+
|
|
592
|
+
- The Mann-Whitney p uses the normal approximation with continuity correction;
|
|
593
|
+
R's `wilcox.test()` is exact for small samples without ties, so it can differ
|
|
594
|
+
slightly.
|
|
595
|
+
- `effect_r = 1 − 2U/(n1·n2)`: negative when group 1 tends higher.
|
|
596
|
+
- Under a rotation through the groups (the default for grouped units, means
|
|
597
|
+
or GMR), dimension 1 is built to separate them, so its test confirms the
|
|
598
|
+
separation rather than testing it independently, and dimension 2's test is
|
|
599
|
+
always t = 0, p = 1.
|
|
600
|
+
|
|
601
|
+
### Developing
|
|
602
|
+
|
|
603
|
+
Tests drive the server over stdio, as an MCP client does:
|
|
604
|
+
|
|
605
|
+
```bash
|
|
606
|
+
node test-mcp.mjs /path/to/data.csv UnitColumn ConversationColumn Code1 Code2 Code3
|
|
607
|
+
node test-tma.mjs
|
|
608
|
+
node test-render.mjs
|
|
609
|
+
```
|
|
610
|
+
|
|
611
|
+
`bash scripts/build-mcpb.sh` builds `dist/qe-mcp-ena.mcpb`;
|
|
612
|
+
`cd skill && zip -r ena-analysis.zip ena-analysis -x '*.DS_Store'` builds the
|
|
613
|
+
skill. Releases build both automatically.
|
|
Binary file
|
|
Binary file
|