@playwright-opentelemetry/trace-viewer 0.12.1 → 0.13.0
This diff represents the content of publicly available package versions that have been released to one of the supported registries. The information contained in this diff is provided for informational purposes only and reflects changes between package versions as they appear in their respective public registries.
- package/README.md +13 -2
- package/dist/assets/index-BskbJ2by.js +13 -0
- package/dist/index.html +1 -1
- package/dist/sw.js +1 -1
- package/package.json +4 -3
- package/dist/assets/index-Dmcb_LVM.js +0 -13
package/README.md
CHANGED
|
@@ -1,10 +1,21 @@
|
|
|
1
1
|
# Playwright OpenTelemetry Trace Viewer
|
|
2
2
|
|
|
3
|
-
|
|
3
|
+
[](https://www.npmjs.com/package/@playwright-opentelemetry/trace-viewer)
|
|
4
|
+
[](https://github.com/endformdev/playwright-opentelemetry/blob/main/LICENSE)
|
|
5
|
+
|
|
6
|
+
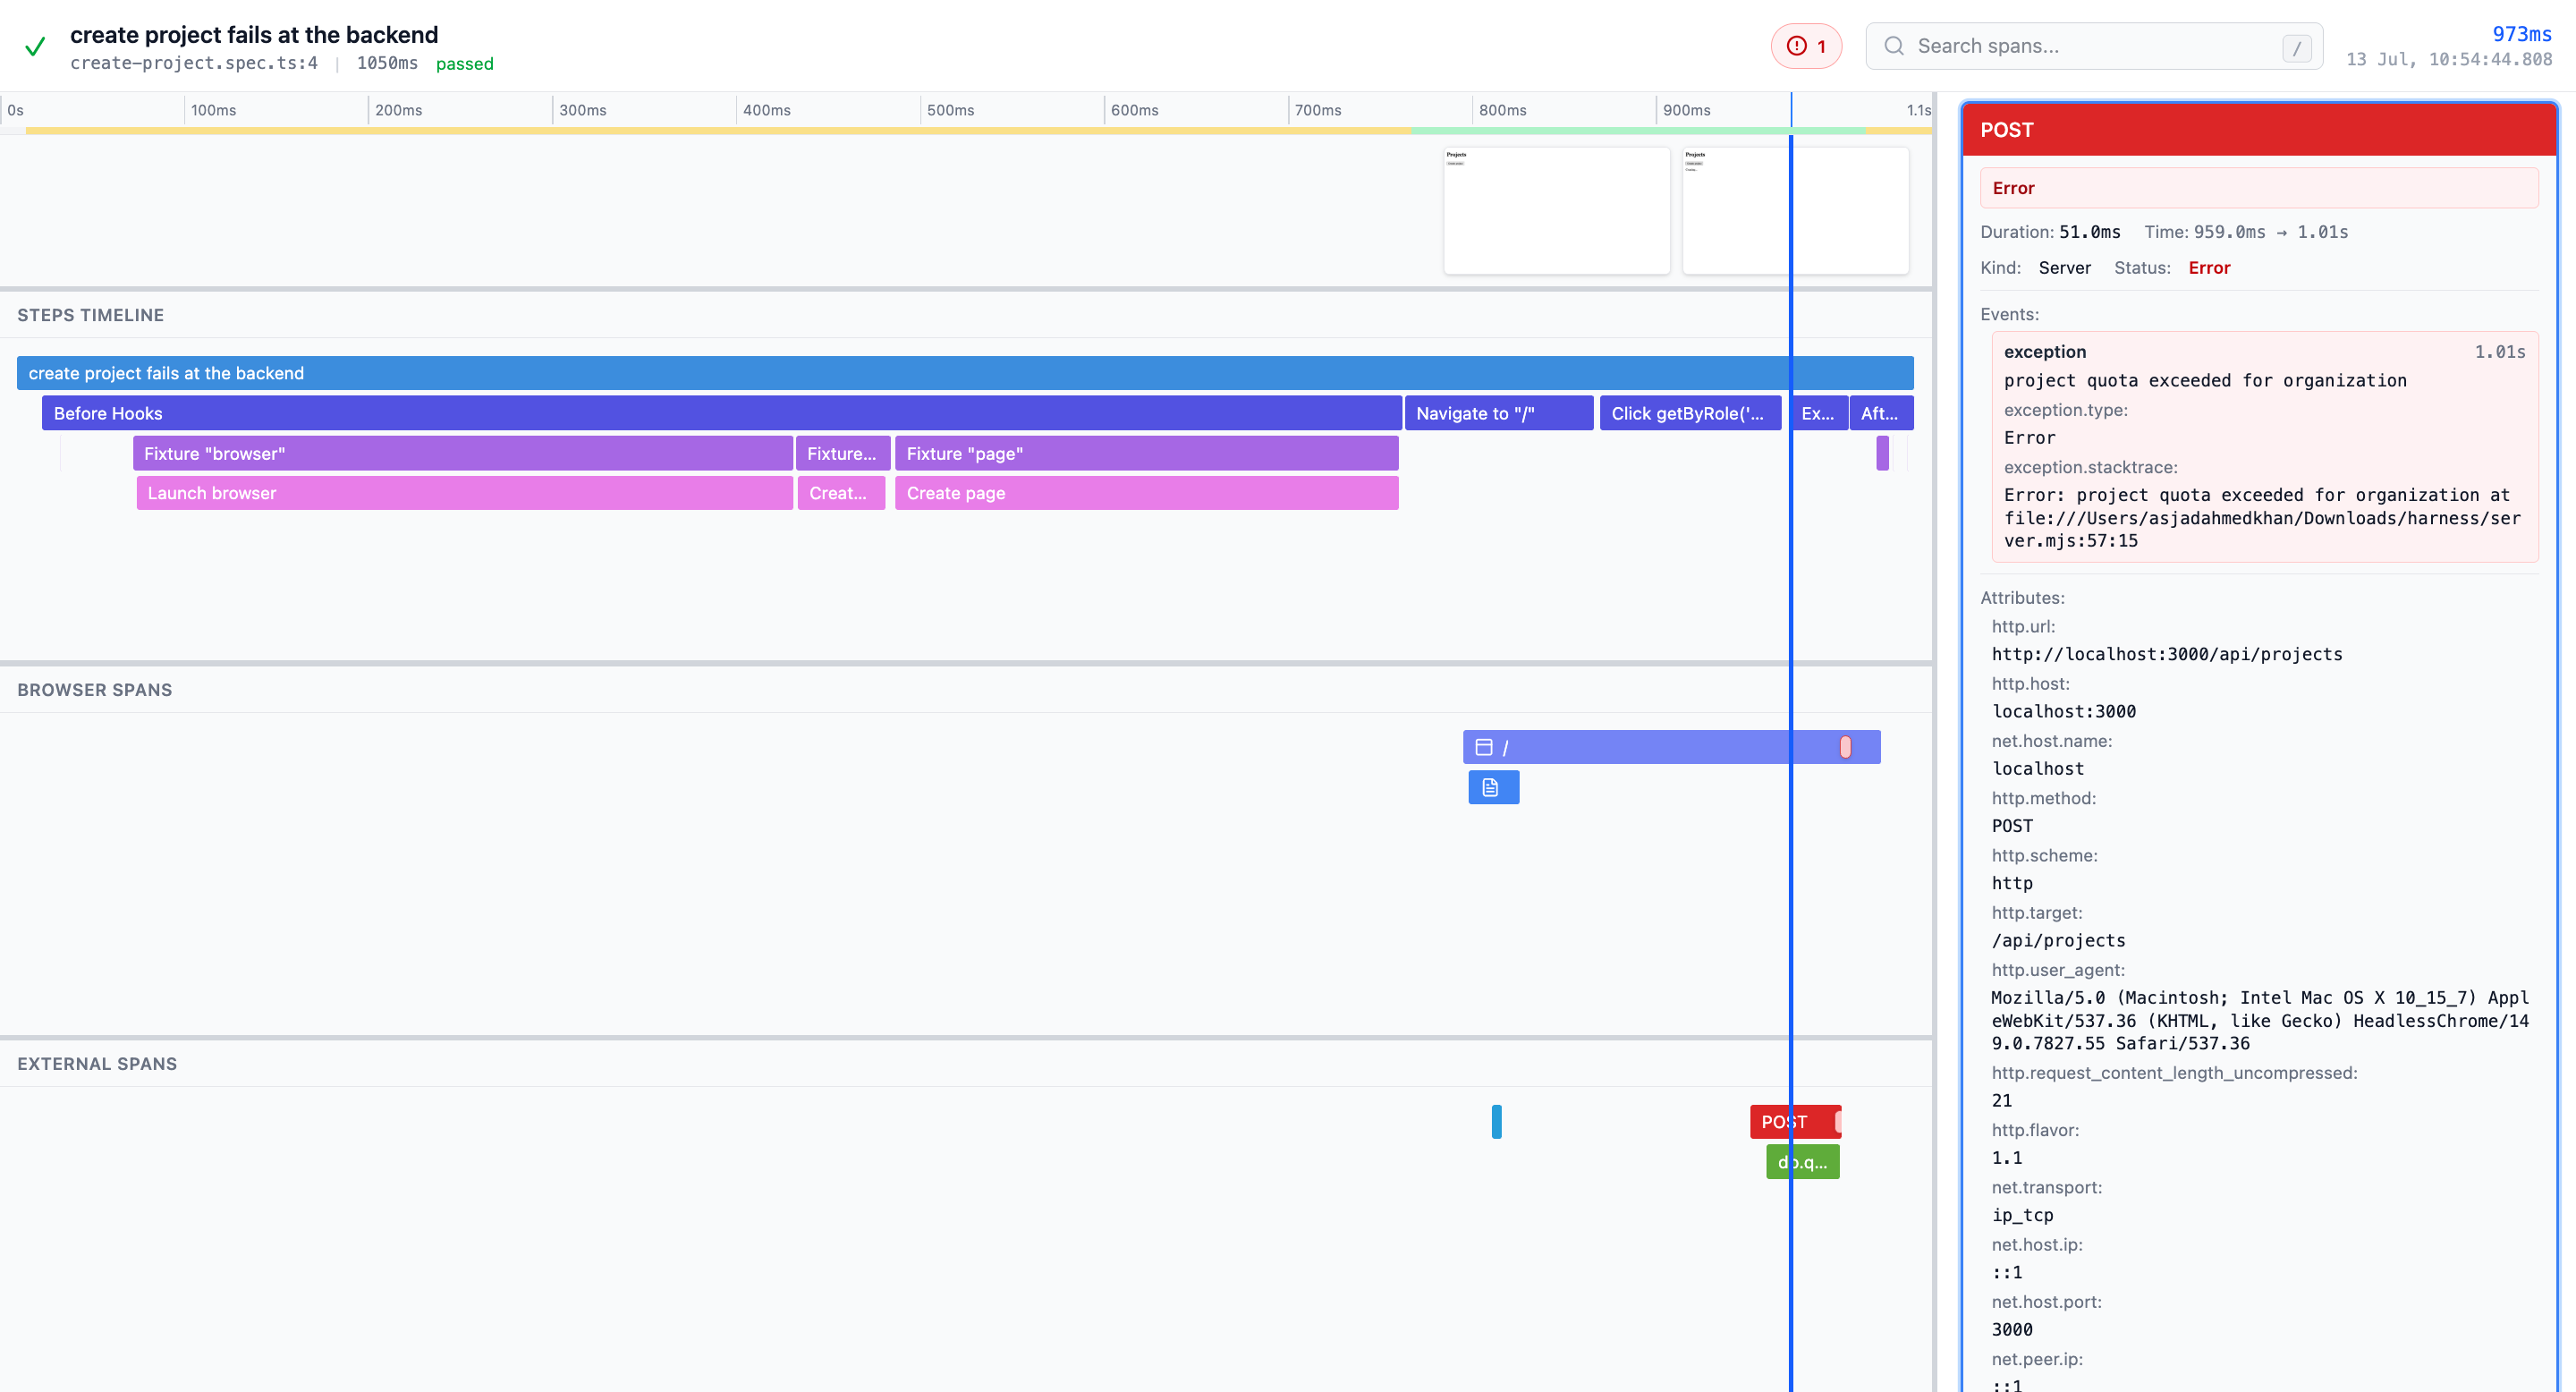
A trace viewer designed around tests, part of [Playwright OpenTelemetry](https://github.com/endformdev/playwright-opentelemetry). A hosted copy runs at [trace.endform.dev](https://trace.endform.dev).
|
|
7
|
+
|
|
8
|
+
|
|
4
9
|
|
|
5
10
|
## Overview
|
|
6
11
|
|
|
7
|
-
|
|
12
|
+
The viewer reads OpenTelemetry trace data directly rather than a proprietary test-result format. The layout uses a time-aligned flame graph with a screenshot filmstrip above it, separated into three views that match how you investigate a failure:
|
|
13
|
+
|
|
14
|
+
- **Test steps** for the Playwright test, hooks, fixtures, and actions
|
|
15
|
+
- **Browser spans** for navigation, routes, JavaScript, fonts, images, fetches, and other requests
|
|
16
|
+
- **External spans** for your instrumented application and backend services
|
|
17
|
+
|
|
18
|
+
Console messages and uncaught browser errors appear as span events on the timeline. You can search span names and attributes, inspect span details and events, jump between errors, and zoom into a time range, while the screenshots stay synchronized with the timeline and grouped by browser context and page.
|
|
8
19
|
|
|
9
20
|
## Run the trace viewer
|
|
10
21
|
|