@pioneer-code/pioneer-charts 22.2.26 → 22.2.28
This diff represents the content of publicly available package versions that have been released to one of the supported registries. The information contained in this diff is provided for informational purposes only and reflects changes between package versions as they appear in their respective public registries.
package/README.md
CHANGED
|
@@ -1,5 +1,7 @@
|
|
|
1
1
|
# Pioneer Charts
|
|
2
2
|
|
|
3
|
+
[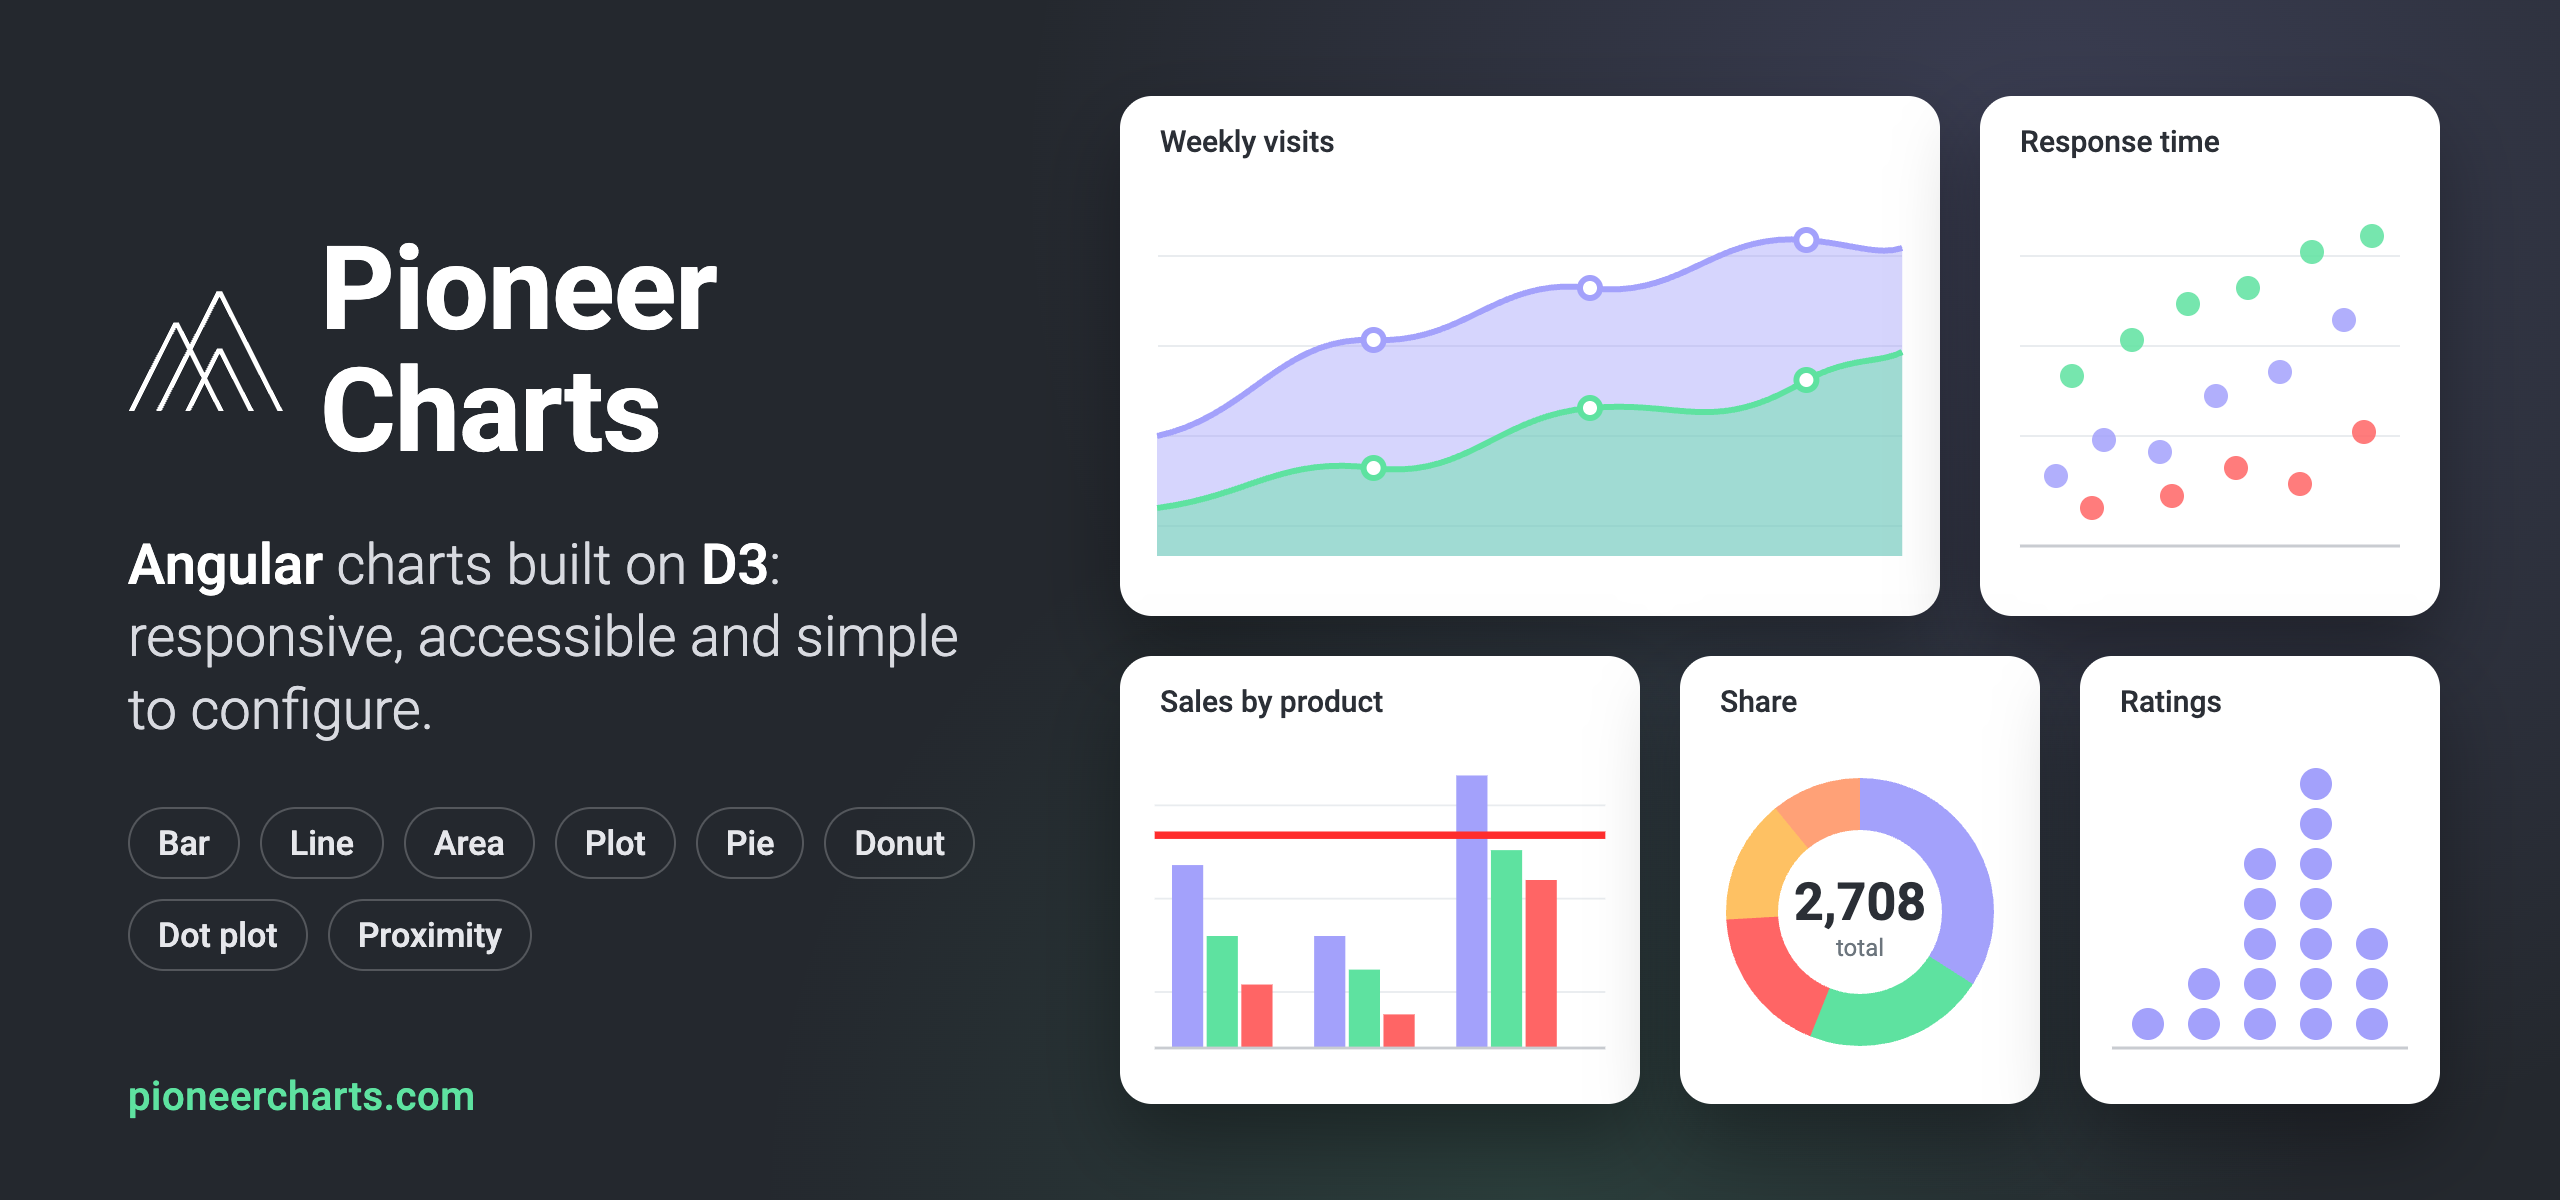](https://pioneercharts.com)
|
|
4
|
+
|
|
3
5
|
[](https://github.com/PioneerCode/pioneer-charts/actions/workflows/ci.yml)
|
|
4
6
|
[](https://www.npmjs.com/package/@pioneer-code/pioneer-charts)
|
|
5
7
|
[](LICENSE)
|
|
@@ -24,6 +26,7 @@ Each chart has its own page with live examples, markup and its full configuratio
|
|
|
24
26
|
- [Angular Donut Chart](https://pioneercharts.com/docs/components/charts/donut-chart) - with a total or any label in its center
|
|
25
27
|
- [Angular Dot Plot Chart](https://pioneercharts.com/docs/components/charts/dot-plot-chart) - values stacked into columns along one axis
|
|
26
28
|
- [Angular Proximity Chart](https://pioneercharts.com/docs/components/charts/proximity-chart) - one item in the middle, its closest matches around it
|
|
29
|
+
- [Angular Sparklines](https://pioneercharts.com/docs/components/charts/sparkline) - small, axis-free trend lines for tables and dashboard tiles
|
|
27
30
|
- [Legend](https://pioneercharts.com/docs/components/charts/legend) - a chart's series, with click events
|
|
28
31
|
|
|
29
32
|
Or see them all together on the [chart examples](https://pioneercharts.com/charts) page.
|