@orchidsoftware/charts 0.0.1 → 0.0.2
This diff represents the content of publicly available package versions that have been released to one of the supported registries. The information contained in this diff is provided for informational purposes only and reflects changes between package versions as they appear in their respective public registries.
- package/CHANGELOG.md +12 -1
- package/README.md +7 -7
- package/docs/api-reference.md +2 -2
- package/docs/chart-types.md +1 -1
- package/docs/customization.md +2 -2
- package/docs/exporting.md +3 -3
- package/docs/frameworks.md +3 -3
- package/docs/getting-started.md +6 -6
- package/docs/heatmap.md +1 -1
- package/docs/percentage.md +1 -1
- package/docs/pie.md +1 -1
- package/docs/readme.md +2 -2
- package/docs/timesheet.md +1 -1
- package/package.json +1 -1
package/CHANGELOG.md
CHANGED
|
@@ -1,11 +1,22 @@
|
|
|
1
1
|
# Changelog
|
|
2
2
|
|
|
3
|
-
All notable changes to
|
|
3
|
+
All notable changes to Orchid Charts are documented in this file. The format follows
|
|
4
4
|
[Keep a Changelog](https://keepachangelog.com/en/1.1.0/), and releases follow
|
|
5
5
|
[Semantic Versioning](https://semver.org/spec/v2.0.0.html).
|
|
6
6
|
|
|
7
7
|
## Unreleased
|
|
8
8
|
|
|
9
|
+
## 0.0.2 - 2026-09-04
|
|
10
|
+
|
|
11
|
+
### Changed
|
|
12
|
+
|
|
13
|
+
- Renamed the public product from Charts2 to Orchid Charts across the demo,
|
|
14
|
+
documentation, repository templates, and release presentation.
|
|
15
|
+
- Refreshed the README hero and visual regression references with the Orchid
|
|
16
|
+
logo, permanent card-header copy actions, and Linux Chromium baselines.
|
|
17
|
+
- Made CI diagnostics include hidden Vitest attachments and audit only the
|
|
18
|
+
dependency graph shipped to package consumers.
|
|
19
|
+
|
|
9
20
|
## 0.0.1 - 2026-09-04
|
|
10
21
|
|
|
11
22
|
### Added
|
package/README.md
CHANGED
|
@@ -1,14 +1,14 @@
|
|
|
1
|
-
#
|
|
1
|
+
# Orchid Charts
|
|
2
2
|
|
|
3
3
|
**Charts that belong in your product.**
|
|
4
4
|
|
|
5
|
-
|
|
5
|
+
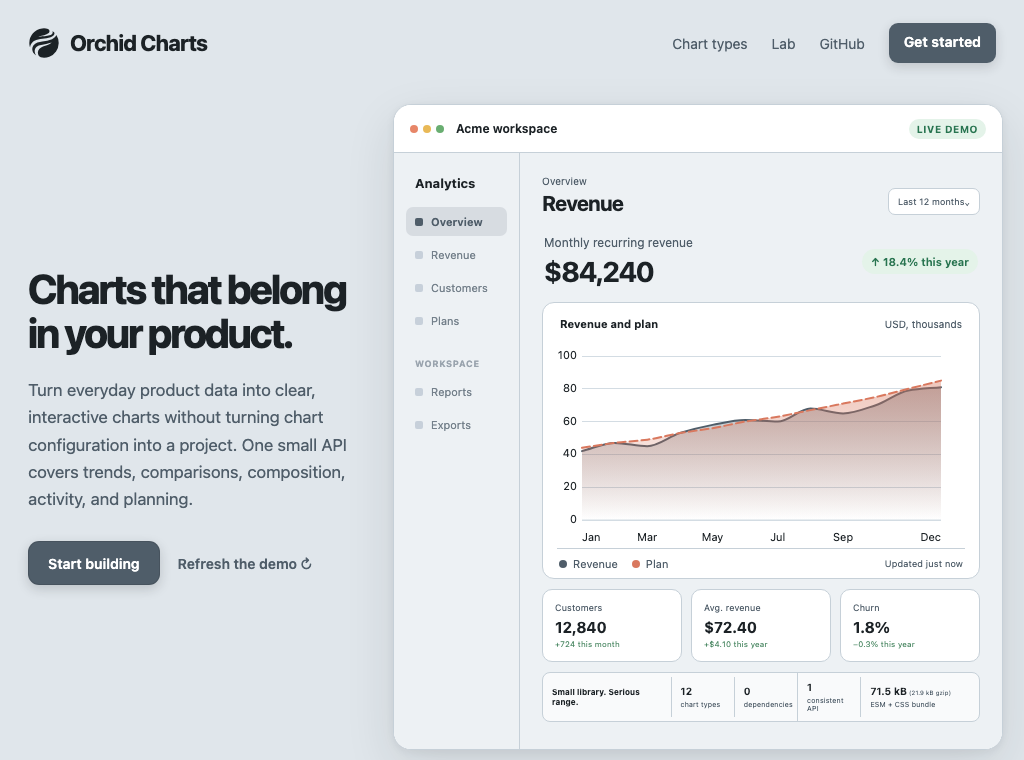
Orchid Charts turns everyday product data into clear, responsive SVG charts. One
|
|
6
6
|
small JavaScript API covers dashboards, reports, activity views, and release
|
|
7
7
|
plans—without turning chart configuration into a project.
|
|
8
8
|
|
|
9
9
|
**[Explore the live demo →](https://charts.orchid.software)**
|
|
10
10
|
|
|
11
|
-
|
|
12
12
|
|
|
13
13
|
```bash
|
|
14
14
|
npm install @orchidsoftware/charts
|
|
@@ -46,7 +46,7 @@ keyboard navigation, and accessible SVG text.
|
|
|
46
46
|
and planning use named definitions instead of a generic configuration maze.
|
|
47
47
|
- **Made for interfaces.** Responsive SVG, tooltips, keyboard navigation,
|
|
48
48
|
reduced motion, and dark product surfaces work together.
|
|
49
|
-
- **Small and typed.**
|
|
49
|
+
- **Small and typed.** Orchid Charts has zero runtime dependencies, tree-shakeable
|
|
50
50
|
ESM, explicit CSS, source maps, and TypeScript declarations.
|
|
51
51
|
|
|
52
52
|
## Shape the result
|
|
@@ -76,7 +76,7 @@ Choose a chart → make(parent) → add data → shape it → render()
|
|
|
76
76
|
|
|
77
77
|
## Choose a chart
|
|
78
78
|
|
|
79
|
-
|
|
80
80
|
|
|
81
81
|
| If you want to show… | Start with… |
|
|
82
82
|
| --------------------------------- | ---------------------------------------------- |
|
|
@@ -108,7 +108,7 @@ its view is removed.
|
|
|
108
108
|
|
|
109
109
|
## Documentation
|
|
110
110
|
|
|
111
|
-
- [Getting started](./docs/getting-started.md) — install
|
|
111
|
+
- [Getting started](./docs/getting-started.md) — install Orchid Charts and render your first chart.
|
|
112
112
|
- [Chart types](./docs/chart-types.md) — choose the chart that answers your question.
|
|
113
113
|
- [Customization](./docs/customization.md) — change color, layout, labels, and presentation.
|
|
114
114
|
- [Updates and interaction](./docs/updates-and-interaction.md) — connect charts to live product state.
|
|
@@ -116,7 +116,7 @@ its view is removed.
|
|
|
116
116
|
- [React, Vue, and Hotwire](./docs/frameworks.md) — mount, update, and clean up charts in components.
|
|
117
117
|
- [API reference](./docs/api-reference.md) — scan the complete public vocabulary.
|
|
118
118
|
|
|
119
|
-
|
|
119
|
+
Orchid Charts has zero runtime dependencies, includes TypeScript declarations, and
|
|
120
120
|
targets current evergreen browsers. It is part of
|
|
121
121
|
[Orchid Software](https://orchid.software), maintained by
|
|
122
122
|
[@tabuna](https://github.com/tabuna), and released under the [MIT License](./LICENSE).
|
package/docs/api-reference.md
CHANGED
|
@@ -1,6 +1,6 @@
|
|
|
1
1
|
# API reference
|
|
2
2
|
|
|
3
|
-
This page is a compact map of the public
|
|
3
|
+
This page is a compact map of the public Orchid Charts API. Begin with
|
|
4
4
|
[Getting started](./getting-started.md) if you have not rendered a chart yet.
|
|
5
5
|
|
|
6
6
|
## Imports
|
|
@@ -82,7 +82,7 @@ A numeric dataset input has this shape:
|
|
|
82
82
|
}
|
|
83
83
|
```
|
|
84
84
|
|
|
85
|
-
`labels()` is optional. When omitted,
|
|
85
|
+
`labels()` is optional. When omitted, Orchid Charts generates positional labels.
|
|
86
86
|
Named datasets are recommended when a legend or tooltip compares series.
|
|
87
87
|
|
|
88
88
|
## Cartesian methods
|
package/docs/chart-types.md
CHANGED
|
@@ -1,6 +1,6 @@
|
|
|
1
1
|
# Chart types
|
|
2
2
|
|
|
3
|
-
|
|
3
|
+
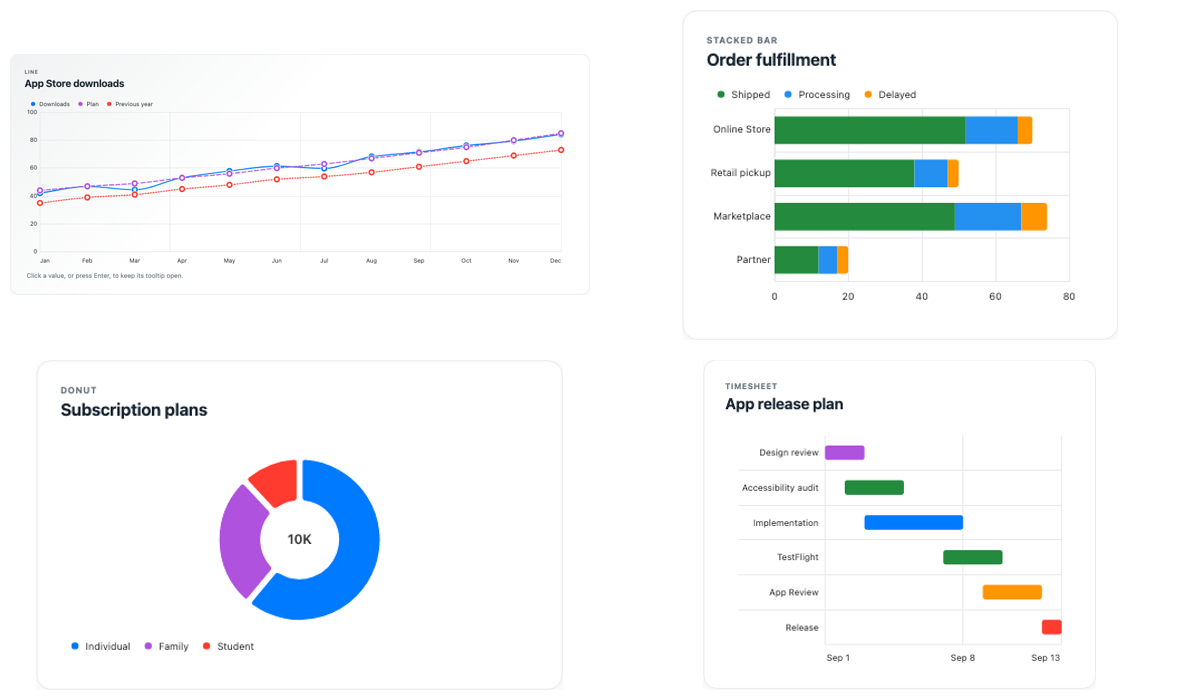
Orchid Charts includes twelve chart types for common product questions. Choose the
|
|
4
4
|
question you need to answer, then open the corresponding guide.
|
|
5
5
|
|
|
6
6
|
## Change and comparison
|
package/docs/customization.md
CHANGED
|
@@ -1,6 +1,6 @@
|
|
|
1
1
|
# Customization
|
|
2
2
|
|
|
3
|
-
|
|
3
|
+
Orchid Charts starts with product-ready defaults. Add only the methods that change
|
|
4
4
|
the result you need.
|
|
5
5
|
|
|
6
6
|
## Set the size
|
|
@@ -57,7 +57,7 @@ LineChart.make("#revenue")
|
|
|
57
57
|
|
|
58
58
|
## Match the surrounding interface
|
|
59
59
|
|
|
60
|
-
|
|
60
|
+
Orchid Charts uses CSS variables for shared surface colors. Override them on a page,
|
|
61
61
|
card, or chart host:
|
|
62
62
|
|
|
63
63
|
```css
|
package/docs/exporting.md
CHANGED
|
@@ -2,7 +2,7 @@
|
|
|
2
2
|
|
|
3
3
|
## Introduction
|
|
4
4
|
|
|
5
|
-
Every
|
|
5
|
+
Every Orchid Charts chart is rendered as SVG. The runtime API can return that SVG as
|
|
6
6
|
a string or download it as a file. Export always uses the chart's current data
|
|
7
7
|
and presentation.
|
|
8
8
|
|
|
@@ -22,7 +22,7 @@ const chart = LineChart.make("#revenue")
|
|
|
22
22
|
const source = chart.toSvg();
|
|
23
23
|
```
|
|
24
24
|
|
|
25
|
-
|
|
25
|
+
Orchid Charts copies the computed presentation styles into the exported SVG. This
|
|
26
26
|
makes the result self-contained when it is opened outside the current page.
|
|
27
27
|
|
|
28
28
|
You may send the string to your own storage or download service:
|
|
@@ -51,7 +51,7 @@ const chart = BarChart.make("#orders")
|
|
|
51
51
|
chart.download("orders-by-channel");
|
|
52
52
|
```
|
|
53
53
|
|
|
54
|
-
|
|
54
|
+
Orchid Charts adds the `.svg` extension when it is not supplied. If the filename is
|
|
55
55
|
omitted, the chart title is used; a chart without a title downloads as
|
|
56
56
|
`Chart.svg`.
|
|
57
57
|
|
package/docs/frameworks.md
CHANGED
|
@@ -2,7 +2,7 @@
|
|
|
2
2
|
|
|
3
3
|
## Introduction
|
|
4
4
|
|
|
5
|
-
|
|
5
|
+
Orchid Charts does not require a framework wrapper. A chart owns one host element and
|
|
6
6
|
returns a small lifecycle that maps directly to component mounting, updates,
|
|
7
7
|
and cleanup.
|
|
8
8
|
|
|
@@ -105,7 +105,7 @@ Let a Stimulus controller own the chart element. Values keep server-rendered
|
|
|
105
105
|
data in the HTML, value callbacks update a controller preserved by a Turbo
|
|
106
106
|
morph, and `disconnect()` handles frame or page replacement.
|
|
107
107
|
|
|
108
|
-
Import the
|
|
108
|
+
Import the Orchid Charts stylesheet once from your JavaScript entry point:
|
|
109
109
|
|
|
110
110
|
```js
|
|
111
111
|
// app/javascript/application.js
|
|
@@ -188,7 +188,7 @@ needed.
|
|
|
188
188
|
|
|
189
189
|
## Resizing
|
|
190
190
|
|
|
191
|
-
Do not calculate the component width for
|
|
191
|
+
Do not calculate the component width for Orchid Charts. Unless `width()` is set, the
|
|
192
192
|
chart follows its host element and observes width changes automatically. Use
|
|
193
193
|
ordinary CSS to size the host:
|
|
194
194
|
|
package/docs/getting-started.md
CHANGED
|
@@ -2,7 +2,7 @@
|
|
|
2
2
|
|
|
3
3
|
This page takes you from an empty element to a responsive product chart.
|
|
4
4
|
|
|
5
|
-
## Install
|
|
5
|
+
## Install Orchid Charts
|
|
6
6
|
|
|
7
7
|
Install the package with npm:
|
|
8
8
|
|
|
@@ -10,7 +10,7 @@ Install the package with npm:
|
|
|
10
10
|
npm install @orchidsoftware/charts
|
|
11
11
|
```
|
|
12
12
|
|
|
13
|
-
|
|
13
|
+
Orchid Charts ships as an ES module. Import the chart you need and its stylesheet:
|
|
14
14
|
|
|
15
15
|
```js
|
|
16
16
|
import { LineChart } from "@orchidsoftware/charts";
|
|
@@ -37,7 +37,7 @@ const revenue = LineChart.make("#revenue")
|
|
|
37
37
|
.render();
|
|
38
38
|
```
|
|
39
39
|
|
|
40
|
-
|
|
40
|
+
Orchid Charts uses the width of the host element and redraws when that width changes.
|
|
41
41
|
The default height, palette, axes, legend, labels, and tooltip are ready to use.
|
|
42
42
|
|
|
43
43
|
## Understand the chain
|
|
@@ -86,7 +86,7 @@ const revenue = LineChart.make("#revenue")
|
|
|
86
86
|
|
|
87
87
|
Each dataset must contain one value for every label.
|
|
88
88
|
|
|
89
|
-
## Use
|
|
89
|
+
## Use Orchid Charts without a build step
|
|
90
90
|
|
|
91
91
|
For a plain HTML page, use an import map and load the stylesheet with a
|
|
92
92
|
`<link>`. Pin an exact version in production.
|
|
@@ -94,12 +94,12 @@ For a plain HTML page, use an import map and load the stylesheet with a
|
|
|
94
94
|
```html
|
|
95
95
|
<div id="chart"></div>
|
|
96
96
|
|
|
97
|
-
<link rel="stylesheet" href="https://cdn.jsdelivr.net/npm/@orchidsoftware/charts@0.0.
|
|
97
|
+
<link rel="stylesheet" href="https://cdn.jsdelivr.net/npm/@orchidsoftware/charts@0.0.2/src/styles.css" />
|
|
98
98
|
|
|
99
99
|
<script type="importmap">
|
|
100
100
|
{
|
|
101
101
|
"imports": {
|
|
102
|
-
"@orchidsoftware/charts": "https://cdn.jsdelivr.net/npm/@orchidsoftware/charts@0.0.
|
|
102
|
+
"@orchidsoftware/charts": "https://cdn.jsdelivr.net/npm/@orchidsoftware/charts@0.0.2/dist/index.js"
|
|
103
103
|
}
|
|
104
104
|
}
|
|
105
105
|
</script>
|
package/docs/heatmap.md
CHANGED
|
@@ -28,7 +28,7 @@ day.
|
|
|
28
28
|
|
|
29
29
|
## Displaying a fixed range
|
|
30
30
|
|
|
31
|
-
Without `range()`,
|
|
31
|
+
Without `range()`, Orchid Charts derives the calendar range from the first and last
|
|
32
32
|
point. Use `range(start, end)` when the chart should also show inactive days
|
|
33
33
|
outside that interval:
|
|
34
34
|
|
package/docs/percentage.md
CHANGED
|
@@ -19,7 +19,7 @@ const chart = PercentageChart.make("#storage")
|
|
|
19
19
|
.render();
|
|
20
20
|
```
|
|
21
21
|
|
|
22
|
-
Values must be non-negative and at least one value must be positive.
|
|
22
|
+
Values must be non-negative and at least one value must be positive. Orchid Charts
|
|
23
23
|
calculates each category's share from the supplied values; they do not need to
|
|
24
24
|
sum to 100.
|
|
25
25
|
|
package/docs/pie.md
CHANGED
|
@@ -24,7 +24,7 @@ Pie values must be non-negative and at least one value must be positive.
|
|
|
24
24
|
## Limiting slices
|
|
25
25
|
|
|
26
26
|
Use `maxSlices()` when incoming data may contain more categories than the chart
|
|
27
|
-
can communicate clearly.
|
|
27
|
+
can communicate clearly. Orchid Charts keeps the largest slices and combines the
|
|
28
28
|
remainder:
|
|
29
29
|
|
|
30
30
|
```js
|
package/docs/readme.md
CHANGED
|
@@ -1,6 +1,6 @@
|
|
|
1
|
-
#
|
|
1
|
+
# Orchid Charts documentation
|
|
2
2
|
|
|
3
|
-
|
|
3
|
+
Orchid Charts helps you turn product data into responsive SVG charts with a small,
|
|
4
4
|
consistent JavaScript API. It is part of [Orchid Software](https://orchid.software).
|
|
5
5
|
|
|
6
6
|
If this is your first chart, begin with [Getting started](./getting-started.md).
|
package/docs/timesheet.md
CHANGED
|
@@ -48,7 +48,7 @@ TimesheetChart.make("#release-plan")
|
|
|
48
48
|
|
|
49
49
|
## Displaying a fixed range
|
|
50
50
|
|
|
51
|
-
Without `range()`,
|
|
51
|
+
Without `range()`, Orchid Charts derives the timeline from the earliest start and
|
|
52
52
|
latest end. Use `range()` when the view should include additional time:
|
|
53
53
|
|
|
54
54
|
```js
|