@openhistoricalmap/map-styles 0.9.2 → 0.9.3
This diff represents the content of publicly available package versions that have been released to one of the supported registries. The information contained in this diff is provided for informational purposes only and reflects changes between package versions as they appear in their respective public registries.
- package/.nvmrc +1 -0
- package/LICENSE.md +121 -0
- package/README.md +23 -5
- package/dist/ohm.styles.js +193 -106
- package/favicon.ico +0 -0
- package/historical/Historical-Style-Documentation.md +34 -0
- package/historical/historical.json +117 -67
- package/index.html +50 -0
- package/japanese_scroll/Japanese_Scroll-Style-Documentation.md +40 -0
- package/japanese_scroll/japanese_scroll.json +2 -2
- package/package.json +8 -5
- package/railway/Railway-Style-Documentation.md +60 -0
- package/railway/railway.json +2 -2
- package/scripts/prepare.js +8 -1
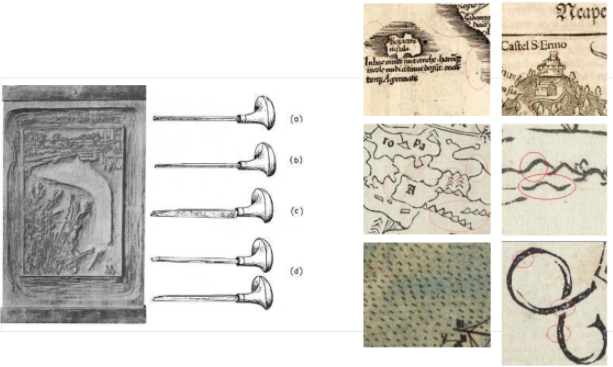
- package/woodblock/Woodblock-Style-Documentation.md +29 -0
- package/woodblock/woodblock.json +2 -2
- package/LICENSE +0 -339
|
@@ -0,0 +1,34 @@
|
|
|
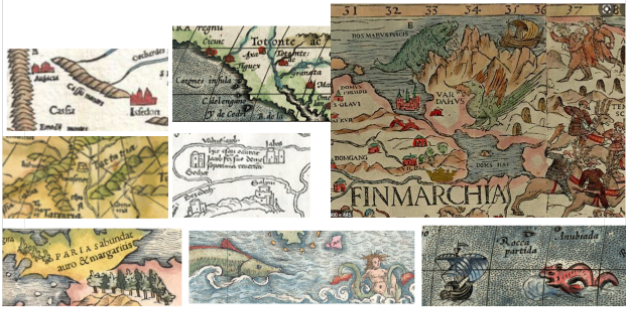
1
|
+
# Documentation of Cartography of Historical Style
|
|
2
|
+
## OpenHistoricalMap Design Principles
|
|
3
|
+
GreenInfo Network and OpenHistoricalMap's cartographic journey for the main historical style began many years ago with cataloging, reviewing, and analyzing some historical styles as inspiration. There were many considerations when reviewing old maps and how they could and would be applied to a brand new style for an OHM base map. In particular, we considered the below heavily:<br>
|
|
4
|
+
|
|
5
|
+
**1. Design for time, geography, and zoom level:** First and foremost, we needed to consider that the OpenHistoricalMap's main style would require a well thought out design that worked across all of time, and all geographies, across history. The cartographic choices would not simply be an attempt to style 1930’s America or 1700’s Japan, for example. While the map would be depicting history, the map style ultimately needed to work as a modern interactive map that had to _globally_ have a style that also worked across all zoom levels. From city streets to states to continents, a basic style would need to work for all of these scenarios <br><Br>
|
|
6
|
+
**2. An ever-expanding data landscape:** Similar to OpenStreetMap, the amount and variety of types of data is _massive_. the cartographic choices made for the main style would also need to coherently work across different types of data (... across time, across geographies, across zoom levels). Most maps - historical or modern - have a single purpose and are designed thoughtfully to support that particular purpose. With OpenHistorical map's purpose effectively being "design for all-things", it also meant that limiting the amount of data - the number of types of information displayed - would also need to be a consistent conversation in the beginning of the design work for the style, but also alongside the growth of the main style, as ever changing data additions would mean that OHM would need to have some kind of flexibility as well as rigidity to not have TOO many data layers shown in the single main style. <br>
|
|
7
|
+
<br>
|
|
8
|
+
## OHM Historical Style History and Context
|
|
9
|
+
After some time, we settled on an aesthetic inspiration coming from Alexander Gross's 1950 Highway Map.<br>
|
|
10
|
+
<br>
|
|
11
|
+
|
|
12
|
+
<img src="https://github.com/user-attachments/assets/ccae22bd-2da9-487f-b8fd-2b7cd64b1bce" alt="1950 highway map of United States, by Alexander Gross. Zoomed in to area near the Great Lakes to showcase the aesthetic. Blue lakes, white-ish land color" width="900">
|
|
13
|
+
<img src="https://github.com/user-attachments/assets/00fbb9d8-e3e7-44b0-a0b7-bb13eccb7003" alt="1950 highway map of United States, by Alexander Gross. Zoomed in to area near San Francisco, highlighting the roadways and rail in black and red lines" width="900">
|
|
14
|
+
<br><br>
|
|
15
|
+
This seemed like a great inspiration for initial cartography. While Gross' map of course focused on highlighting highways, for the OHM style, we were inspired by the overall map, and liked how Gross used a handful of bright colors alongside a minimal amount of basic layers. Of particular inspirational was the dusty, dusky, blue-gray water; the warm off-white land color; and the bright colors and stark contrast of the highways against the light background. <br>
|
|
16
|
+
<br>
|
|
17
|
+
<img src="https://github.com/user-attachments/assets/5e4a891c-fbea-4c8b-9978-97120eceeeb4" alt="first draft of OHM style, bringing in some colors similar to Gross map.">
|
|
18
|
+
<br>
|
|
19
|
+
This first iterations of the OHM style brought in the inspiration from Boss' map into all data elements globally, at every zoom level. Highways, for example, were given a rust red color to make them stand out, as was very typical with vintage maps of this era. We pulled the water color almost directly from the 1950 Alexander Gross map posted above. This was a great starting point to get the OHM cartography ball rolling.
|
|
20
|
+
|
|
21
|
+
Using Maputnik, we applied this style to OHM data and began to test the cartography across different locations, zoom levels, and times throughout history. As the style was reviewed, it became clear that the strong focus on highways and car-centric roads was _not_ great for all locations across all times. We toned down the saturation of water and shifted all roads to white. Roads were still differentiated by width, cases, and shield symbols and labels. This gave us more of a basic cartographic palette to work with, and allowed us to emphasize a variety of types of data, not simply transportation layers.
|
|
22
|
+
|
|
23
|
+
After some time with this new iteration of the style, some OHM users and contributors expressed how they were missing the color differences for road types, and thought these differences had done a nice job of differentiating the types of roadways in the application. We created a few new options, returning to applying color to roads, but desaturated from our original designs - and settled on this symbology:
|
|
24
|
+
<img src="https://github.com/user-attachments/assets/057e258f-cf55-4332-92b4-0f69150013cc" alt="Map showing the aforementioned design changes.">
|
|
25
|
+
|
|
26
|
+
Interestingly, and maybe not surprisingly, the evolution of the OHM style started to pull away from the 1950s historical map style aesthetically, and more towards a modern interactive map style: this is largely because modern mapping simply requires us to consider a lot more data when doing so in an interactive map. We have to be able to find the right way to balance all of our layers’ symbologies more equally, which is where we are in our current approach. The below shows the style today:
|
|
27
|
+
<img src="https://github.com/user-attachments/assets/a94fe3ba-7266-4ecb-b27f-1781491bfa69" alt="OHM map today, showing the UK. The water color is brighter, the land color is a little lighter in color. Rail lines cross the map.">
|
|
28
|
+
<img src="https://github.com/user-attachments/assets/26cf161d-4a6c-4383-88c1-4355c015187d" alt="The map is zoomed into london, showcasing a lot of data at the ground level, such as shops and parks. Orange highways and white roads criss cross the map. The water color is brighter, the land color is a little lighter in color. Rail lines cross the map.">
|
|
29
|
+
|
|
30
|
+
## OHM Cartography Today, and in the Future
|
|
31
|
+
The current map's design still is inspired by and pulls from the original inspiration from Boss, and it also has gone through design choices in order to ensure new data or increases in data still showcase a balanced design. The data balancing is always the crux of shifting cartographic choices, and this is always where design shifts will lie in the future of OHM's cartography. Looking ahead, there also will always be new opportunities to bring in design influence from historical maps, **and** we must continue to balance the main style's data needs.
|
|
32
|
+
|
|
33
|
+
For more vintage inspired styles, check out OHM's other styles. These allow for much more "historical style inspiration" in their aesthetics, largely _because_ there is far less data shown on the map. If those maps had to have the same amount of data as OHM's main style, the aesthetics would not remain the same.
|
|
34
|
+
|
|
@@ -21,10 +21,19 @@
|
|
|
21
21
|
"tiles": [
|
|
22
22
|
"https://vtiles.staging.openhistoricalmap.org/maps/ne/{z}/{x}/{y}.pbf"
|
|
23
23
|
]
|
|
24
|
+
},
|
|
25
|
+
"osm_land": {
|
|
26
|
+
"type": "vector",
|
|
27
|
+
"tiles": [
|
|
28
|
+
"https://vtiles.openhistoricalmap.org/maps/osm_land/{z}/{x}/{y}.pbf"
|
|
29
|
+
],
|
|
30
|
+
"minzoom": 0,
|
|
31
|
+
"maxzoom": 22,
|
|
32
|
+
"scheme": "xyz"
|
|
24
33
|
}
|
|
25
34
|
},
|
|
26
|
-
"sprite": "
|
|
27
|
-
"glyphs": "
|
|
35
|
+
"sprite": "http://localhost:8888/historical/historical_spritesheet",
|
|
36
|
+
"glyphs": "http://localhost:8888/fonts/{fontstack}/{range}.pbf",
|
|
28
37
|
"layers": [
|
|
29
38
|
{
|
|
30
39
|
"id": "background",
|
|
@@ -48,7 +57,7 @@
|
|
|
48
57
|
{
|
|
49
58
|
"id": "land",
|
|
50
59
|
"type": "fill",
|
|
51
|
-
"source": "
|
|
60
|
+
"source": "osm_land",
|
|
52
61
|
"source-layer": "land",
|
|
53
62
|
"minzoom": 0,
|
|
54
63
|
"maxzoom": 24,
|
|
@@ -304,8 +313,6 @@
|
|
|
304
313
|
"rgba(238, 229, 178, 1)",
|
|
305
314
|
"basin",
|
|
306
315
|
"rgba(144, 204, 203, 1)",
|
|
307
|
-
"wetland",
|
|
308
|
-
"rgba(227, 233, 226, 1)",
|
|
309
316
|
"salt_pond",
|
|
310
317
|
"rgba(236, 240, 241, 1)",
|
|
311
318
|
"mud",
|
|
@@ -358,21 +365,6 @@
|
|
|
358
365
|
]
|
|
359
366
|
}
|
|
360
367
|
},
|
|
361
|
-
{
|
|
362
|
-
"id": "landuse_areas_z12_glacier-outline",
|
|
363
|
-
"type": "line",
|
|
364
|
-
"source": "osm",
|
|
365
|
-
"source-layer": "landuse_areas",
|
|
366
|
-
"minzoom": 9,
|
|
367
|
-
"maxzoom": 24,
|
|
368
|
-
"filter": ["==", ["get", "type"], "glacier"],
|
|
369
|
-
"layout": {"visibility": "visible"},
|
|
370
|
-
"paint": {
|
|
371
|
-
"line-color": "rgba(180, 211, 218, 1)",
|
|
372
|
-
"line-dasharray": [2, 2],
|
|
373
|
-
"line-width": ["interpolate", ["linear"], ["zoom"], 9, 1, 14, 1.5]
|
|
374
|
-
}
|
|
375
|
-
},
|
|
376
368
|
{
|
|
377
369
|
"id": "landuse_areas_z12_food_and_farming",
|
|
378
370
|
"type": "fill",
|
|
@@ -559,7 +551,7 @@
|
|
|
559
551
|
"type": "fill",
|
|
560
552
|
"source": "osm",
|
|
561
553
|
"source-layer": "water_areas",
|
|
562
|
-
"minzoom":
|
|
554
|
+
"minzoom": 0,
|
|
563
555
|
"maxzoom": 24,
|
|
564
556
|
"layout": {"visibility": "visible"},
|
|
565
557
|
"paint": {
|
|
@@ -574,6 +566,26 @@
|
|
|
574
566
|
]
|
|
575
567
|
}
|
|
576
568
|
},
|
|
569
|
+
{
|
|
570
|
+
"id": "water_areas-ne",
|
|
571
|
+
"type": "fill",
|
|
572
|
+
"source": "ne",
|
|
573
|
+
"source-layer": "water_areas",
|
|
574
|
+
"minzoom": 0,
|
|
575
|
+
"maxzoom": 8,
|
|
576
|
+
"layout": {"visibility": "visible"},
|
|
577
|
+
"paint": {
|
|
578
|
+
"fill-color": [
|
|
579
|
+
"interpolate",
|
|
580
|
+
["linear"],
|
|
581
|
+
["zoom"],
|
|
582
|
+
0,
|
|
583
|
+
"rgba(185, 228, 228, 1)",
|
|
584
|
+
10,
|
|
585
|
+
"rgba(126, 218, 218, 1)"
|
|
586
|
+
]
|
|
587
|
+
}
|
|
588
|
+
},
|
|
577
589
|
{
|
|
578
590
|
"id": "landuse_areas_z12_watercover",
|
|
579
591
|
"type": "fill",
|
|
@@ -599,40 +611,42 @@
|
|
|
599
611
|
"rgba(144, 204, 203, 1)",
|
|
600
612
|
"swimming_pool",
|
|
601
613
|
"rgba(144, 204, 203, 1)",
|
|
614
|
+
"wetland",
|
|
615
|
+
"rgba(228, 242, 227, 1)",
|
|
602
616
|
"transparent"
|
|
603
617
|
]
|
|
604
618
|
]
|
|
605
619
|
}
|
|
606
620
|
},
|
|
607
621
|
{
|
|
608
|
-
"id": "
|
|
622
|
+
"id": "wetlands_z11-pattern",
|
|
609
623
|
"type": "fill",
|
|
610
624
|
"source": "osm",
|
|
611
625
|
"source-layer": "landuse_areas",
|
|
612
626
|
"minzoom": 11,
|
|
613
627
|
"maxzoom": 24,
|
|
614
|
-
"filter": ["
|
|
628
|
+
"filter": ["==", ["get", "type"], "wetland"],
|
|
615
629
|
"layout": {"visibility": "visible"},
|
|
616
|
-
"paint": {
|
|
630
|
+
"paint": {
|
|
631
|
+
"fill-color": "rgba(255, 255, 255, 1)",
|
|
632
|
+
"fill-pattern": {
|
|
633
|
+
"stops": [[12, "cattails_space_60px"], [14, "cattails_space_70px"]]
|
|
634
|
+
}
|
|
635
|
+
}
|
|
617
636
|
},
|
|
618
637
|
{
|
|
619
|
-
"id": "
|
|
620
|
-
"type": "
|
|
621
|
-
"source": "
|
|
622
|
-
"source-layer": "
|
|
623
|
-
"minzoom":
|
|
624
|
-
"maxzoom":
|
|
638
|
+
"id": "landuse_areas_z12_glacier-outline",
|
|
639
|
+
"type": "line",
|
|
640
|
+
"source": "osm",
|
|
641
|
+
"source-layer": "landuse_areas",
|
|
642
|
+
"minzoom": 9,
|
|
643
|
+
"maxzoom": 24,
|
|
644
|
+
"filter": ["==", ["get", "type"], "glacier"],
|
|
625
645
|
"layout": {"visibility": "visible"},
|
|
626
646
|
"paint": {
|
|
627
|
-
"
|
|
628
|
-
|
|
629
|
-
|
|
630
|
-
["zoom"],
|
|
631
|
-
0,
|
|
632
|
-
"rgba(185, 228, 228, 1)",
|
|
633
|
-
10,
|
|
634
|
-
"rgba(126, 218, 218, 1)"
|
|
635
|
-
]
|
|
647
|
+
"line-color": "rgba(180, 211, 218, 1)",
|
|
648
|
+
"line-dasharray": [2, 2],
|
|
649
|
+
"line-width": ["interpolate", ["linear"], ["zoom"], 9, 1, 14, 1.5]
|
|
636
650
|
}
|
|
637
651
|
},
|
|
638
652
|
{
|
|
@@ -671,22 +685,6 @@
|
|
|
671
685
|
"fill-outline-color": "rgba(226, 223, 215, 1)"
|
|
672
686
|
}
|
|
673
687
|
},
|
|
674
|
-
{
|
|
675
|
-
"id": "wetlands_z11-pattern",
|
|
676
|
-
"type": "fill",
|
|
677
|
-
"source": "osm",
|
|
678
|
-
"source-layer": "landuse_areas",
|
|
679
|
-
"minzoom": 11,
|
|
680
|
-
"maxzoom": 24,
|
|
681
|
-
"filter": ["==", ["get", "type"], "wetland"],
|
|
682
|
-
"layout": {"visibility": "visible"},
|
|
683
|
-
"paint": {
|
|
684
|
-
"fill-color": "rgba(255, 255, 255, 1)",
|
|
685
|
-
"fill-pattern": {
|
|
686
|
-
"stops": [[12, "cattails_space_60px"], [14, "cattails_space_70px"]]
|
|
687
|
-
}
|
|
688
|
-
}
|
|
689
|
-
},
|
|
690
688
|
{
|
|
691
689
|
"id": "water_lines_stream_no_name",
|
|
692
690
|
"type": "line",
|
|
@@ -1064,7 +1062,7 @@
|
|
|
1064
1062
|
"type": "fill",
|
|
1065
1063
|
"source": "osm",
|
|
1066
1064
|
"source-layer": "transport_areas",
|
|
1067
|
-
"minzoom":
|
|
1065
|
+
"minzoom": 12,
|
|
1068
1066
|
"maxzoom": 24,
|
|
1069
1067
|
"filter": ["==", ["get", "type"], "aerodrome"],
|
|
1070
1068
|
"layout": {"visibility": "visible"},
|
|
@@ -1078,7 +1076,7 @@
|
|
|
1078
1076
|
"type": "fill",
|
|
1079
1077
|
"source": "osm",
|
|
1080
1078
|
"source-layer": "transport_areas",
|
|
1081
|
-
"minzoom":
|
|
1079
|
+
"minzoom": 12,
|
|
1082
1080
|
"maxzoom": 24,
|
|
1083
1081
|
"filter": ["==", ["get", "type"], "helipad"],
|
|
1084
1082
|
"layout": {"visibility": "visible"},
|
|
@@ -2691,7 +2689,7 @@
|
|
|
2691
2689
|
"type": "line",
|
|
2692
2690
|
"source": "osm",
|
|
2693
2691
|
"source-layer": "transport_lines",
|
|
2694
|
-
"minzoom":
|
|
2692
|
+
"minzoom": 12,
|
|
2695
2693
|
"filter": ["==", ["get", "type"], "subway"],
|
|
2696
2694
|
"layout": {"visibility": "visible"},
|
|
2697
2695
|
"paint": {
|
|
@@ -2701,7 +2699,7 @@
|
|
|
2701
2699
|
["linear"],
|
|
2702
2700
|
["zoom"],
|
|
2703
2701
|
12,
|
|
2704
|
-
|
|
2702
|
+
0.8,
|
|
2705
2703
|
13,
|
|
2706
2704
|
1,
|
|
2707
2705
|
14,
|
|
@@ -3147,6 +3145,36 @@
|
|
|
3147
3145
|
"line-dasharray": [0.1, 0.3]
|
|
3148
3146
|
}
|
|
3149
3147
|
},
|
|
3148
|
+
{
|
|
3149
|
+
"id": "roads_servicecase_z13",
|
|
3150
|
+
"type": "line",
|
|
3151
|
+
"source": "osm",
|
|
3152
|
+
"source-layer": "transport_lines",
|
|
3153
|
+
"minzoom": 13,
|
|
3154
|
+
"maxzoom": 24,
|
|
3155
|
+
"filter": [
|
|
3156
|
+
"all",
|
|
3157
|
+
["in", ["get", "type"], ["literal", ["service"]]],
|
|
3158
|
+
["!=", ["get", "bridge"], 1]
|
|
3159
|
+
],
|
|
3160
|
+
"layout": {
|
|
3161
|
+
"visibility": "visible",
|
|
3162
|
+
"line-cap": "round",
|
|
3163
|
+
"line-join": "round"
|
|
3164
|
+
},
|
|
3165
|
+
"paint": {
|
|
3166
|
+
"line-color": "#D2D2D5",
|
|
3167
|
+
"line-width": [
|
|
3168
|
+
"interpolate",
|
|
3169
|
+
["exponential", 1.5],
|
|
3170
|
+
["zoom"],
|
|
3171
|
+
13,
|
|
3172
|
+
2,
|
|
3173
|
+
18,
|
|
3174
|
+
12
|
|
3175
|
+
]
|
|
3176
|
+
}
|
|
3177
|
+
},
|
|
3150
3178
|
{
|
|
3151
3179
|
"id": "roads_residentialcase_z13",
|
|
3152
3180
|
"type": "line",
|
|
@@ -3156,11 +3184,7 @@
|
|
|
3156
3184
|
"maxzoom": 24,
|
|
3157
3185
|
"filter": [
|
|
3158
3186
|
"all",
|
|
3159
|
-
[
|
|
3160
|
-
"in",
|
|
3161
|
-
["get", "type"],
|
|
3162
|
-
["literal", ["residential", "service", "unclassified"]]
|
|
3163
|
-
],
|
|
3187
|
+
["in", ["get", "type"], ["literal", ["residential", "unclassified"]]],
|
|
3164
3188
|
["!=", ["get", "bridge"], 1]
|
|
3165
3189
|
],
|
|
3166
3190
|
"layout": {
|
|
@@ -3495,6 +3519,32 @@
|
|
|
3495
3519
|
"line-dasharray": [1, 2]
|
|
3496
3520
|
}
|
|
3497
3521
|
},
|
|
3522
|
+
{
|
|
3523
|
+
"id": "roads_service",
|
|
3524
|
+
"type": "line",
|
|
3525
|
+
"source": "osm",
|
|
3526
|
+
"source-layer": "transport_lines",
|
|
3527
|
+
"minzoom": 12,
|
|
3528
|
+
"maxzoom": 24,
|
|
3529
|
+
"filter": ["in", ["get", "type"], ["literal", ["service"]]],
|
|
3530
|
+
"layout": {
|
|
3531
|
+
"visibility": "visible",
|
|
3532
|
+
"line-cap": "round",
|
|
3533
|
+
"line-join": "round"
|
|
3534
|
+
},
|
|
3535
|
+
"paint": {
|
|
3536
|
+
"line-color": "#ffffff",
|
|
3537
|
+
"line-width": [
|
|
3538
|
+
"interpolate",
|
|
3539
|
+
["exponential", 1.5],
|
|
3540
|
+
["zoom"],
|
|
3541
|
+
12,
|
|
3542
|
+
1.6,
|
|
3543
|
+
18,
|
|
3544
|
+
7
|
|
3545
|
+
]
|
|
3546
|
+
}
|
|
3547
|
+
},
|
|
3498
3548
|
{
|
|
3499
3549
|
"id": "roads_residential",
|
|
3500
3550
|
"type": "line",
|
|
@@ -3505,7 +3555,7 @@
|
|
|
3505
3555
|
"filter": [
|
|
3506
3556
|
"in",
|
|
3507
3557
|
["get", "type"],
|
|
3508
|
-
["literal", ["residential", "
|
|
3558
|
+
["literal", ["residential", "unclassified"]]
|
|
3509
3559
|
],
|
|
3510
3560
|
"layout": {
|
|
3511
3561
|
"visibility": "visible",
|
|
@@ -5595,7 +5645,7 @@
|
|
|
5595
5645
|
"source": "osm",
|
|
5596
5646
|
"source-layer": "buildings_centroids",
|
|
5597
5647
|
"minzoom": 16,
|
|
5598
|
-
"filter": ["
|
|
5648
|
+
"filter": ["!=", ["get", "type"], "parking"],
|
|
5599
5649
|
"layout": {
|
|
5600
5650
|
"icon-image": "{tourism}-18",
|
|
5601
5651
|
"visibility": "visible",
|
|
@@ -5971,7 +6021,7 @@
|
|
|
5971
6021
|
"source": "osm",
|
|
5972
6022
|
"source-layer": "transport_areas",
|
|
5973
6023
|
"minzoom": 10,
|
|
5974
|
-
"maxzoom":
|
|
6024
|
+
"maxzoom": 14,
|
|
5975
6025
|
"filter": ["==", ["get", "type"], "aerodrome"],
|
|
5976
6026
|
"layout": {"icon-image": "airport-18", "text-font": ["OpenHistorical"]}
|
|
5977
6027
|
},
|
package/index.html
ADDED
|
@@ -0,0 +1,50 @@
|
|
|
1
|
+
<html>
|
|
2
|
+
<head>
|
|
3
|
+
<script src="./node_modules/maplibre-gl/dist/maplibre-gl.js"></script>
|
|
4
|
+
<link href="./node_modules/maplibre-gl/dist/maplibre-gl.css" rel="stylesheet" />
|
|
5
|
+
</head>
|
|
6
|
+
<body>
|
|
7
|
+
<div id="map" style="width:100%;height:100%"></div>
|
|
8
|
+
|
|
9
|
+
<script type="module">
|
|
10
|
+
import StyleFlipperControl from "./node_modules/maplibre-gl-style-flipper/index.js";
|
|
11
|
+
const mapStyles = {
|
|
12
|
+
"historical": {
|
|
13
|
+
code: "historical",
|
|
14
|
+
url: "./historical/historical.json"
|
|
15
|
+
},
|
|
16
|
+
"japanese_scroll": {
|
|
17
|
+
code: "japanese_scroll",
|
|
18
|
+
url: "./japanese_scroll/japanese_scroll.json"
|
|
19
|
+
},
|
|
20
|
+
"railway": {
|
|
21
|
+
code: "railway",
|
|
22
|
+
url: "./railway/railway.json"
|
|
23
|
+
},
|
|
24
|
+
"woodblock": {
|
|
25
|
+
code: "woodblock",
|
|
26
|
+
url: "./woodblock/woodblock.json"
|
|
27
|
+
},
|
|
28
|
+
};
|
|
29
|
+
|
|
30
|
+
var map = new maplibregl.Map({
|
|
31
|
+
container: 'map',
|
|
32
|
+
style: mapStyles["historical"].url,
|
|
33
|
+
center: [-74.033, 40.6259],
|
|
34
|
+
zoom: 11.73,
|
|
35
|
+
hash: true
|
|
36
|
+
})
|
|
37
|
+
|
|
38
|
+
// Create an instance of StyleFlipperControl
|
|
39
|
+
const styleFlipperControl = new StyleFlipperControl(mapStyles);
|
|
40
|
+
|
|
41
|
+
// Set the initial style code
|
|
42
|
+
styleFlipperControl.setCurrentStyleCode("historical");
|
|
43
|
+
|
|
44
|
+
// Add the control to the map
|
|
45
|
+
map.addControl(styleFlipperControl, "bottom-right");
|
|
46
|
+
|
|
47
|
+
</script>
|
|
48
|
+
|
|
49
|
+
</body>
|
|
50
|
+
</html>
|
|
@@ -0,0 +1,40 @@
|
|
|
1
|
+
# Documentation of Japanese Scrool Map Style
|
|
2
|
+
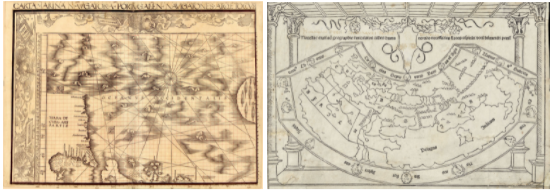
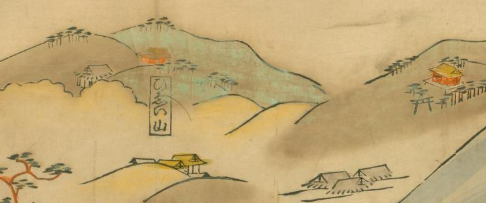
This style was created after the Woodblock style, and is inspired by the long-form Japanese scroll maps from ~1500/1600/1700s. In some ways, the longform map emulates the modern mapping scale so much more, because the scrolls gave so much more space for information and data. Of course, the amount of paper isn't the same as global or multiple zoom levels, but the premise of showing more information, and having a different visualization connection to what one sees in real life, on the ground, is why I wanted to make this style.
|
|
3
|
+
<br>
|
|
4
|
+
Obviously, the map style is limited to a rectangular screen size, and also doesn't have the same capacity to make you feel like you are strolling along a river, the coast, or a trail, but hopefully some of the core aesthetic elements bring this style into clearly being rooted in historical Japanese maps.
|
|
5
|
+
<br>
|
|
6
|
+
Below are the maps from which I pulled inspiration:
|
|
7
|
+
- [[Shandong, Zhili, Shengjing hai jiang tu]](https://www.loc.gov/resource/g7822cm.gct00259?r=0.375,0.043,0.25,0.154,0) Coastal map of Shandong, Zhili, and Shengjing
|
|
8
|
+
- [Map of the Sea and Land Routes from Edo to Nagasaki](https://www.loc.gov/resource/gdcwdl.wdl_14435_001/?sp=23&r=-0.08,-0.07,1.238,0.761,0), Kyoto : Nishida Shobee, 1672
|
|
9
|
+
- [Dai Nihon enkai yochi zenzu](https://www.loc.gov/resource/g7960m.gct00032/?sp=16&r=-0.192,0.859,0.973,0.598,0) [Japan, Hokkaido to Kyushu]
|
|
10
|
+
- [Song Xian he tu.](https://www.loc.gov/resource/g7823s.ct003375/?r=-0.218,-0.052,1.454,0.894,0) Map of the river systems in Song County
|
|
11
|
+
- [[Rehe xing gong quan tu]](https://www.loc.gov/resource/g7824c.ct001844/?r=0.789,0.26,0.25,0.154,0)
|
|
12
|
+
|
|
13
|
+
## Aesthetic Elements That Made the Map Look Old
|
|
14
|
+
### Background Layer (land)
|
|
15
|
+
 <br>
|
|
16
|
+
For this style, it made sense to emulate the texture of old, aged paper, as this aesthetic is something we are very used to seeing in old maps.
|
|
17
|
+
|
|
18
|
+
## Water (Ocean, lakes)
|
|
19
|
+
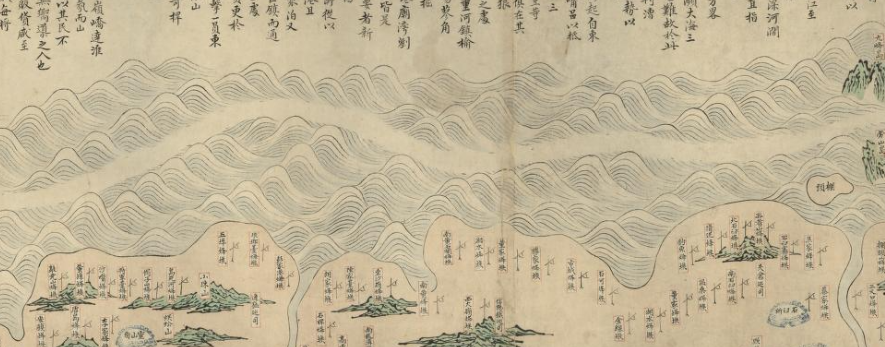<br>
|
|
20
|
+
I was inspired by the above, and created a pattern for water areas across the map that was similar to the above.
|
|
21
|
+
|
|
22
|
+
## Linework (admin, roads)
|
|
23
|
+
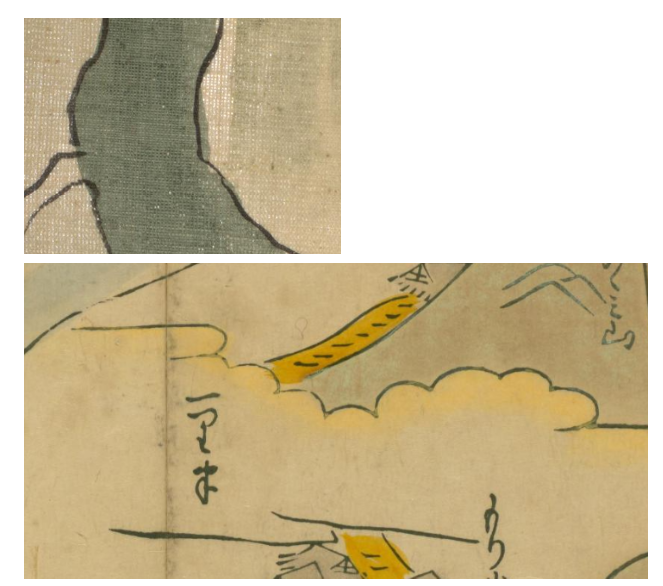 <br>
|
|
24
|
+
Similar to Woodblock, I used inconsistent/tapering lines to emulate the imperfections of old maps.
|
|
25
|
+
|
|
26
|
+
## Symbology (Mountains)
|
|
27
|
+
|
|
28
|
+
|
|
29
|
+
|
|
30
|
+
<br>
|
|
31
|
+
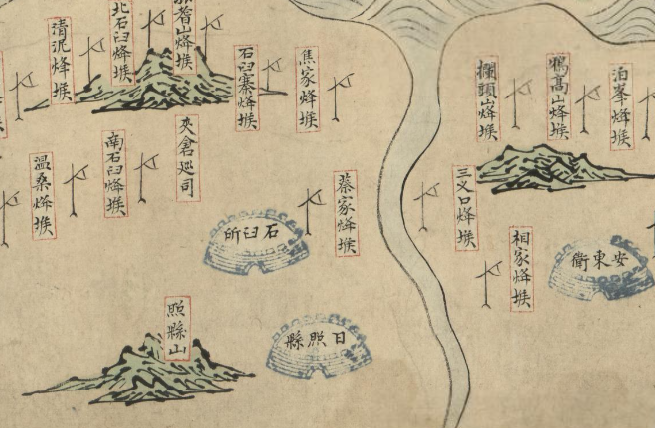
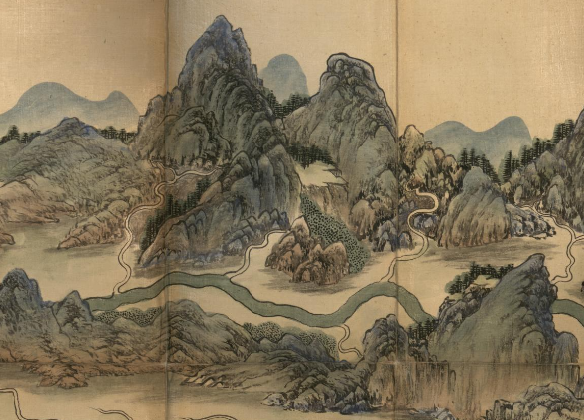
Symbology in old maps always a reason why they look old. Mountains were a consistent theme across japanese maps, so I created these symbols as well.
|
|
32
|
+
|
|
33
|
+
## Label Design
|
|
34
|
+
 <br>
|
|
35
|
+
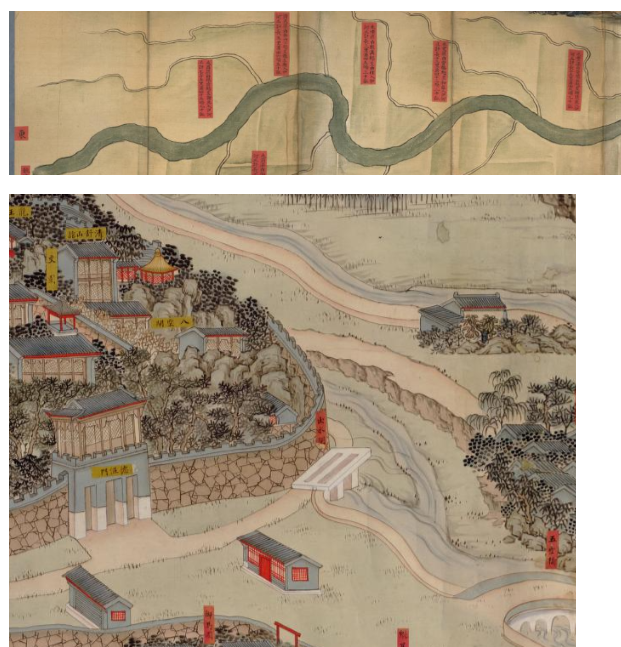
This felt really important as a few of the maps had this styling. I used block/square halos with red tones were common across various maps. Incorporated reds as well as mustard yellows, as this also was colors used across some of the inpsiration maps
|
|
36
|
+
|
|
37
|
+
## Data Choices
|
|
38
|
+
Like the Woodblock style, this map style intentionally removes quite a bit of OHM data from the map. Older maps had a lot less data in them. If this map were to grow over time and have more data added, there would need to be some consideration of how design elements change to ensure that there is an appropriate hierarchy and balance of contrast.
|
|
39
|
+
|
|
40
|
+
For now, this style serves to highlight an older map aesthetic, in modern mapping technologies, alongside showing data over time.
|
|
@@ -16,8 +16,8 @@
|
|
|
16
16
|
]
|
|
17
17
|
}
|
|
18
18
|
},
|
|
19
|
-
"sprite": "
|
|
20
|
-
"glyphs": "
|
|
19
|
+
"sprite": "http://localhost:8888/japanese_scroll/japanese_scroll_spritesheet_template",
|
|
20
|
+
"glyphs": "http://localhost:8888/fonts/{fontstack}/{range}.pbf",
|
|
21
21
|
"layers": [
|
|
22
22
|
{
|
|
23
23
|
"id": "background",
|
package/package.json
CHANGED
|
@@ -1,12 +1,12 @@
|
|
|
1
1
|
{
|
|
2
2
|
"name": "@openhistoricalmap/map-styles",
|
|
3
|
-
"version": "0.9.
|
|
3
|
+
"version": "0.9.3",
|
|
4
4
|
"description": "A collection of map styles for OpenHistoricalMap",
|
|
5
5
|
"main": "''",
|
|
6
6
|
"type": "module",
|
|
7
7
|
"scripts": {
|
|
8
8
|
"prepare": "scripts/prepare.js",
|
|
9
|
-
"test": "
|
|
9
|
+
"test": "http-server --port 8888 --cors -o '#7.33/40.487/-73.554'"
|
|
10
10
|
},
|
|
11
11
|
"repository": {
|
|
12
12
|
"type": "git",
|
|
@@ -17,12 +17,15 @@
|
|
|
17
17
|
"Vanessa Knoppke-Wetzel <run.for.funner@gmail.com>",
|
|
18
18
|
"Eric Theise <erictheise@gmail.com>"
|
|
19
19
|
],
|
|
20
|
-
"license": "",
|
|
20
|
+
"license": "CC0 1.0 Universal",
|
|
21
21
|
"bugs": {
|
|
22
|
-
"url": "https://github.com/OpenHistoricalMap/
|
|
22
|
+
"url": "https://github.com/OpenHistoricalMap/issues"
|
|
23
23
|
},
|
|
24
24
|
"homepage": "https://github.com/OpenHistoricalMap/map-styles#readme",
|
|
25
25
|
"dependencies": {
|
|
26
|
-
"camelcase": "^8.0.0"
|
|
26
|
+
"camelcase": "^8.0.0",
|
|
27
|
+
"http-server": "^14.1.1",
|
|
28
|
+
"maplibre-gl": "^5.1.0",
|
|
29
|
+
"maplibre-gl-style-flipper": "^1.0.7"
|
|
27
30
|
}
|
|
28
31
|
}
|
|
@@ -0,0 +1,60 @@
|
|
|
1
|
+
# Documentation of Railway Style: Where it is today
|
|
2
|
+
The below documents the original considerations for the rail style. This style, however, is one that requires some design updates, and I would say is not at all a "final design" because of the likelihood of more data attributes to exist in the future. This style is historical but also must be practical, and unlike the other two style variants, this style requires more data, and also has more need for multi-variant styling of some elements (specifically rail). <br>
|
|
3
|
+
<br>
|
|
4
|
+
|
|
5
|
+
## Original Railway Style Inspiration (And references for the future?)
|
|
6
|
+
|
|
7
|
+
### Main line routes
|
|
8
|
+

|
|
9
|
+

|
|
10
|
+

|
|
11
|
+

|
|
12
|
+

|
|
13
|
+

|
|
14
|
+
|
|
15
|
+
heavy black lines with white/clear circles (that represented towns) were common across many historical maps. This in itself isn't shocking: Make a clearly visible line, and showcase where the cities and towns are along the routes. The result is a visually distinct aesthetic, however. Given that this occurs often and also globally ( *historical research dependent on what I could find based on language I speak, so noting that I attempted to review globally but limits here). Given this, this aesthetic seems appropriate for "main" line routes.
|
|
16
|
+
<br>
|
|
17
|
+
<br>
|
|
18
|
+
While this is where the inspiration for the "main" rail lines came from, the OHM community has generally stated that it would be ideal to update this, so I anticipate when there are more data attributes, this styling will change in the future.
|
|
19
|
+
|
|
20
|
+
### "Other route" aesthetics
|
|
21
|
+
Obvious tracks, dashed lines, and other line aesthetics are ones we should use for the upcoming variety of rail that folx are considering adding as more distinguishable tags for a rail specific style, but I wanted to also review historically how some of these presented, as well as gather other options for inspiration.
|
|
22
|
+
<br>
|
|
23
|
+
The below lists and shows some examples
|
|
24
|
+
<br>
|
|
25
|
+
<br>
|
|
26
|
+
Thick, dense rail dashes (millipede-esque):
|
|
27
|
+

|
|
28
|
+

|
|
29
|
+

|
|
30
|
+
<br><Br>
|
|
31
|
+
classic dashed route:
|
|
32
|
+

|
|
33
|
+
<br><br>
|
|
34
|
+
mostly-one-sided dash (I think possible implentation via offset?):
|
|
35
|
+

|
|
36
|
+
<Br><br>
|
|
37
|
+
one-sided dash:
|
|
38
|
+

|
|
39
|
+

|
|
40
|
+
<Br><Br>
|
|
41
|
+
thicker wide dashes:
|
|
42
|
+

|
|
43
|
+
<Br><br>
|
|
44
|
+
Legend with line varieties (not just rail):
|
|
45
|
+

|
|
46
|
+
<br><br>
|
|
47
|
+
farther-apart track dashes:
|
|
48
|
+

|
|
49
|
+
<br><br>
|
|
50
|
+
"casing only" route (not the main routes that are bolder here):
|
|
51
|
+

|
|
52
|
+
<Br><br>
|
|
53
|
+
And of course, the above isn't including basic line representation, color variances, and normal dashing lines as well (also pictured in these map examples)
|
|
54
|
+
|
|
55
|
+
## Data and Design Today vs the Future
|
|
56
|
+

|
|
57
|
+
The above notes what the various rail styling looks like today. Updates have been made since the original style release based on community feedback, but as noted above, there will absolutely be more changes in the future.
|
|
58
|
+
<br><br>
|
|
59
|
+
Data-wise today, only some places across the globe have visible rail variance. When there are updates to the rail data, this is where there will be a need for more design changes and considerations to be made, especially because this is what the OHM rail community has identified as a space that they want updated (more data, and then updated designs for that new data).
|
|
60
|
+
|
package/railway/railway.json
CHANGED
|
@@ -25,8 +25,8 @@
|
|
|
25
25
|
]
|
|
26
26
|
}
|
|
27
27
|
},
|
|
28
|
-
"sprite": "
|
|
29
|
-
"glyphs": "
|
|
28
|
+
"sprite": "http://localhost:8888/railway/railway_spritesheet",
|
|
29
|
+
"glyphs": "http://localhost:8888/fonts/{fontstack}/{range}.pbf",
|
|
30
30
|
"layers": [
|
|
31
31
|
{
|
|
32
32
|
"id": "background",
|
package/scripts/prepare.js
CHANGED
|
@@ -18,8 +18,15 @@ if (!fs.existsSync(distDir)) {
|
|
|
18
18
|
}
|
|
19
19
|
|
|
20
20
|
try {
|
|
21
|
+
const assets = ['glyphs', 'sprite'];
|
|
21
22
|
styles.forEach((style) => {
|
|
22
|
-
|
|
23
|
+
// Load each development style from disk, replace the scheme/domain/port, & make it the value of an ohm-website key,
|
|
24
|
+
// e.g., japanese_scroll => ohmVectorStyles.JapaneseScroll
|
|
25
|
+
const ohmWebsiteKey = camelCase(style, { pascalCase: true });
|
|
26
|
+
ohmVectorStyles[ohmWebsiteKey] = JSON.parse(fs.readFileSync(path.join(baseDir.path, style, `${style}.json`)));
|
|
27
|
+
assets.forEach((asset) => {
|
|
28
|
+
ohmVectorStyles[ohmWebsiteKey][asset] = ohmVectorStyles[ohmWebsiteKey][asset].replace('http://localhost:8888', 'https://www.openhistoricalmap.org/map-styles')
|
|
29
|
+
})
|
|
23
30
|
})
|
|
24
31
|
fs.writeFileSync(
|
|
25
32
|
path.join(distDir, `ohm.styles.js`),
|
|
@@ -0,0 +1,29 @@
|
|
|
1
|
+
# Documentation of Woodblock Style
|
|
2
|
+
The woodblock style was directly informed by woodblock map styles in the history of cartography. Specific aesthetic elements that captured the imperfections and textures of these old maps - plus map monsters of course - helped to bring this style to life.
|
|
3
|
+
|
|
4
|
+
## Aesthetic Elements that Made the Map Look Old
|
|
5
|
+
|
|
6
|
+
### Background Layer (ocean)
|
|
7
|
+
 <br>
|
|
8
|
+
For this style, it made sense to emulate the texture of old, aged paper, as this aesthetic is something we are very used to seeing in old maps.
|
|
9
|
+
|
|
10
|
+
### Typeface and styling
|
|
11
|
+
<br>
|
|
12
|
+
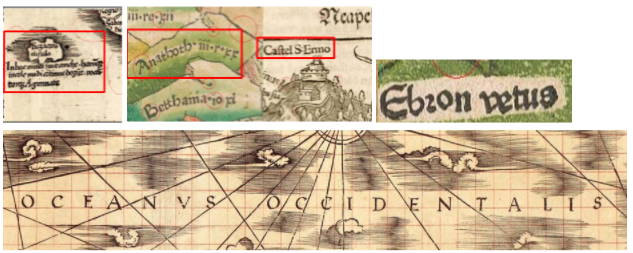
For the font choice, I chose the [Eadui](https://fontlibrary.org/en/font/eadui) (with [SIL Open Font License](https://scripts.sil.org/cms/scripts/page.php?site_id=nrsi&id=OFL)) because it was very close to a typeface style that was used often in woodblock maps, and also was easier to read on a screen than the bolder Blackletter options that also typical woodblock map fonts.I also made a thick halo in the labels, emulating the “halos” that were commonly seen in woodblock maps, due to map makers adding labels via slot cutting (read more about tools and media [here](https://vknoppkewetzel.github.io/VKW_MSthesis.pdf)), or leaving space to label by hand.
|
|
13
|
+
|
|
14
|
+
### Linework design (roads, country boundaries)
|
|
15
|
+
<br>
|
|
16
|
+
Both the tools used and the medium (wood) meant that everything carved into the wood was not perfectly linear, perfectly spaced, or perfectly circular. Additionally, using ink on the block and pressing down the block onto paper meant the ink sometimes squeezed to the side, or was patchy on the paper itself, providing even more textural elements. Essentially, the tools and mediums used mean that woodblock maps have “imperfections” as an enormous part of the aesthetic.
|
|
17
|
+
|
|
18
|
+
In order to mimic this, I created “splotchy” (ink squeezing/inconsistent) linework which is used in country boundaries and building linework, as well as “inconsistent tapering” linework for the roads.
|
|
19
|
+
|
|
20
|
+
Note, I intentionally used a light dashed-line for state boundaries rather than another textural line pattern, as it was a little too much texture to use another “imperfect” line pattern for states (alongside a more intricate font, country boundaries, paper texture, roads, and stylized icons).
|
|
21
|
+
|
|
22
|
+
### Symbology design
|
|
23
|
+
<br>
|
|
24
|
+
A huge part of old maps are the illustrative elements across the map, from icons used for cities to map monsters across the old map. I created two different sized building icons, two different map monsters, and a tree grouping to provide this final aesthetic element to this map to wrap up the “woodblock map feeling” of the style.
|
|
25
|
+
|
|
26
|
+
### Data Choices
|
|
27
|
+
Another important aspect of making this style work really well in emulating woodblock maps is that this map intentionally removes quite a bit of OHM data from the map. Older maps had a lot less data in them. If this map were to grow over time and have more data added, there would need to be some consideration of how design elements change to ensure that there is an appropriate hierarchy and balance of contrast.
|
|
28
|
+
<br><br>
|
|
29
|
+
For now, this style serves to highlight an older map aesthetic, in modern mapping technologies, alongside showing data over time.
|
package/woodblock/woodblock.json
CHANGED
|
@@ -16,8 +16,8 @@
|
|
|
16
16
|
]
|
|
17
17
|
}
|
|
18
18
|
},
|
|
19
|
-
"sprite": "
|
|
20
|
-
"glyphs": "
|
|
19
|
+
"sprite": "http://localhost:8888/woodblock/woodblock_spritesheet",
|
|
20
|
+
"glyphs": "http://localhost:8888/fonts/{fontstack}/{range}.pbf",
|
|
21
21
|
"layers": [
|
|
22
22
|
{
|
|
23
23
|
"id": "background-pattern",
|