@loreto-labs/skill-echarts 0.1.0
This diff represents the content of publicly available package versions that have been released to one of the supported registries. The information contained in this diff is provided for informational purposes only and reflects changes between package versions as they appear in their respective public registries.
- package/README.md +32 -0
- package/actions.mjs +112 -0
- package/bin/cli.mjs +3 -0
- package/bin/mcp.mjs +5 -0
- package/command.md +9 -0
- package/loreto.skill.json +16 -0
- package/package.json +41 -0
- package/runtime/actions-core.mjs +115 -0
- package/runtime/argparse.mjs +70 -0
- package/runtime/cli-runner.mjs +112 -0
- package/runtime/mcp-runner.mjs +96 -0
- package/skill/README.md +85 -0
- package/skill/SKILL.md +164 -0
- package/skill/brands/apricot.json +30 -0
- package/skill/brands/onyx.json +31 -0
- package/skill/examples/01_bar.json +12 -0
- package/skill/examples/02_grouped_bar.json +16 -0
- package/skill/examples/03_stacked_bar.json +16 -0
- package/skill/examples/04_hbar.json +12 -0
- package/skill/examples/05_line.json +16 -0
- package/skill/examples/06_area.json +15 -0
- package/skill/examples/07_pie.json +16 -0
- package/skill/examples/08_donut.json +17 -0
- package/skill/examples/09_scatter.json +15 -0
- package/skill/examples/10_kpi.json +15 -0
- package/skill/examples/11_heatmap.json +21 -0
- package/skill/examples/12_radar.json +21 -0
- package/skill/examples/13_treemap.json +20 -0
- package/skill/examples/14_dashboard.json +28 -0
- package/skill/references/brand-style-mapping.md +58 -0
- package/skill/references/chart-type-recipes.md +66 -0
- package/skill/references/echarts-theming-model.md +62 -0
- package/skill/references/fonts-and-svg-embedding.md +60 -0
- package/skill/scripts/lib/charts.mjs +298 -0
- package/skill/scripts/lib/fonts.mjs +66 -0
- package/skill/scripts/lib/palette.mjs +119 -0
- package/skill/scripts/lib/theme.mjs +92 -0
- package/skill/scripts/package-lock.json +240 -0
- package/skill/scripts/package.json +15 -0
- package/skill/scripts/render-all.mjs +97 -0
- package/skill/scripts/render.mjs +98 -0
- package/skill/tests/test_building_branded_echarts_visualizations.py +92 -0
package/skill/README.md
ADDED
|
@@ -0,0 +1,85 @@
|
|
|
1
|
+
# building-branded-echarts-visualizations
|
|
2
|
+
|
|
3
|
+
Turn a company's **brand styles (colors + fonts)** into polished, on-brand **Apache ECharts**
|
|
4
|
+
charts — rendered server-side to **SVG + PNG**, no browser. Capture the brand once as a small
|
|
5
|
+
JSON token file; 14 chart types render from it consistently, and re-skinning to a new brand is a
|
|
6
|
+
one-file change.
|
|
7
|
+
|
|
8
|
+
## Example output
|
|
9
|
+
|
|
10
|
+
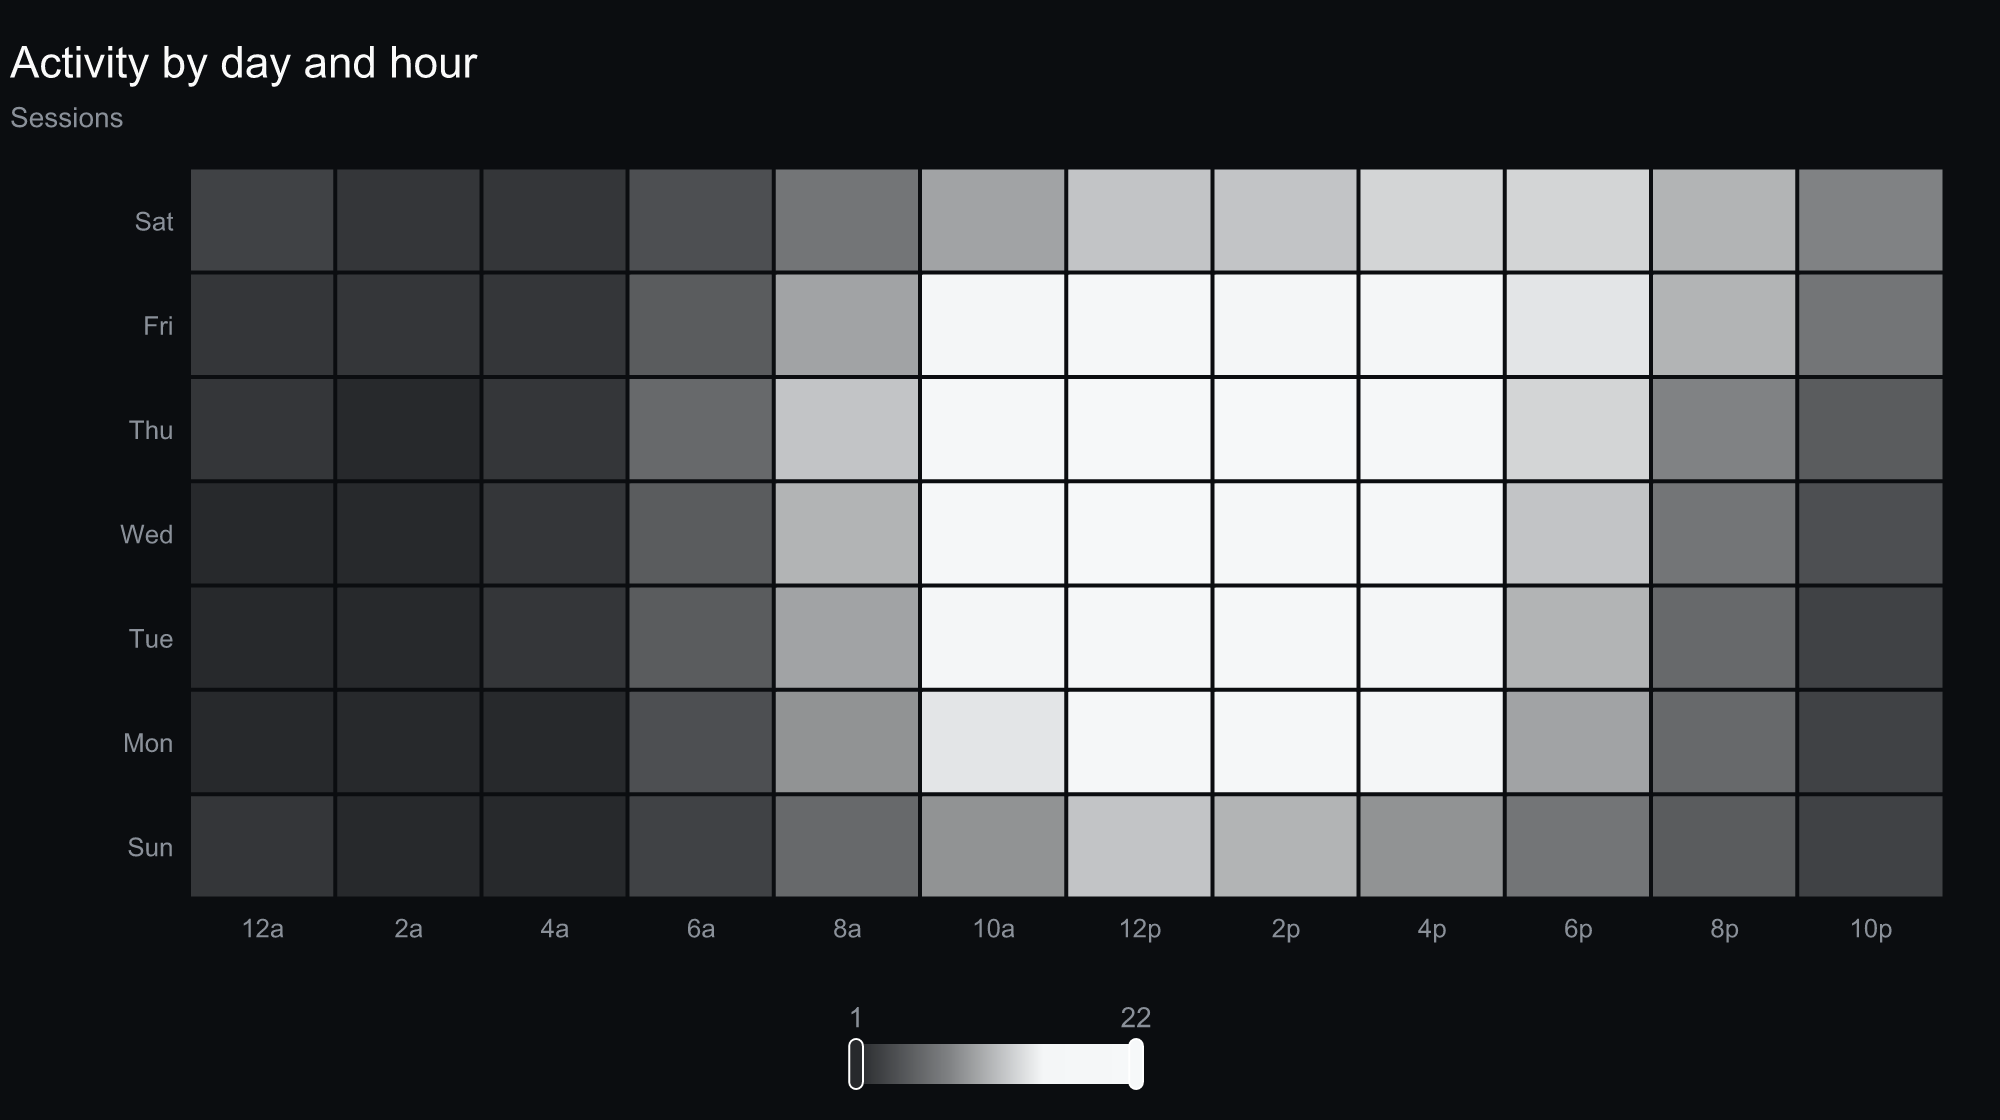
The same engine, styled entirely by one small brand file. Here's a monochrome theme across a
|
|
11
|
+
range of chart types — scatter, line, radar, KPI cards, and a heatmap:
|
|
12
|
+
|
|
13
|
+
|
|
14
|
+
|
|
15
|
+
|
|
16
|
+
|
|
17
|
+
|
|
18
|
+
|
|
19
|
+
|
|
20
|
+
|
|
21
|
+
|
|
22
|
+
|
|
23
|
+
## Quick start
|
|
24
|
+
|
|
25
|
+
```bash
|
|
26
|
+
cd scripts
|
|
27
|
+
npm install # echarts + @resvg/resvg-js
|
|
28
|
+
|
|
29
|
+
# Render every example chart for every brand → out/<brand>/*.svg + *.png + a gallery
|
|
30
|
+
node render-all.mjs
|
|
31
|
+
open ../out/index.html # or just open the SVGs/PNGs in out/<brand>/
|
|
32
|
+
|
|
33
|
+
# Render a single chart
|
|
34
|
+
node render.mjs --brand ../brands/onyx.json --chart ../examples/01_bar.json --out ../out/onyx/bar.svg
|
|
35
|
+
```
|
|
36
|
+
|
|
37
|
+
Ships with two **dark, monochrome demo brands** — `onyx` (sleek greyscale) and `apricot` (warm
|
|
38
|
+
peach pastel). Each is a near-black canvas with a single-hue palette stepped light→deep and crisp
|
|
39
|
+
typography. Add your own brand the same way (any hue — the palette derives + contrast-checks
|
|
40
|
+
automatically).
|
|
41
|
+
|
|
42
|
+
## How it works
|
|
43
|
+
|
|
44
|
+
A small pipeline turns your **brand tokens** + **chart data** into rendered charts:
|
|
45
|
+
|
|
46
|
+
1. **Brand** — `brands/<brand>.json` (colors + fonts) is read by `lib/palette.mjs`, which completes
|
|
47
|
+
and contrast-checks the palette, then `lib/theme.mjs` maps the tokens to an ECharts theme object.
|
|
48
|
+
2. **Data** — `examples/<chart>.json` (chart type + data) is turned into a per-type ECharts option
|
|
49
|
+
by `lib/charts.mjs`.
|
|
50
|
+
3. **Render** — ECharts server-side renders the option to an SVG (`renderToSVGString`), and
|
|
51
|
+
`lib/fonts.mjs` embeds the brand `@font-face` (and loads the font for the PNG via resvg).
|
|
52
|
+
4. **Output** — `out/<brand>/<chart>.svg` plus a 2× `.png`.
|
|
53
|
+
|
|
54
|
+
## Brand it for a company
|
|
55
|
+
|
|
56
|
+
1. Copy a brand (e.g. `brands/onyx.json`) to `brands/<company>.json`.
|
|
57
|
+
2. Replace `colors.categorical` + neutrals with the brand's hex codes; set `fonts.family` /
|
|
58
|
+
`titleFamily` and add `fonts.faces[]` webfont URLs (e.g. from fontsource / Google Fonts).
|
|
59
|
+
3. `node render-all.mjs` → review `out/<company>/`.
|
|
60
|
+
|
|
61
|
+
Fonts are **referenced** (family + webfont URL), never bundled as binaries. SVG output is
|
|
62
|
+
font-accurate via embedded `@font-face`; PNG uses a local font file (`faces[].file`) if given,
|
|
63
|
+
otherwise a system fallback (colors/layout stay correct).
|
|
64
|
+
|
|
65
|
+
## Chart types
|
|
66
|
+
|
|
67
|
+
`bar`, `groupedBar`, `stackedBar`, `hbar`, `line`, `area`, `pie`, `donut`, `scatter`, `kpi`,
|
|
68
|
+
`heatmap`, `radar`, `treemap`, `dashboard` — one `examples/*.json` per type shows the data shape.
|
|
69
|
+
|
|
70
|
+
## Files
|
|
71
|
+
|
|
72
|
+
- `SKILL.md` — the methodology (this is a Claude Code skill package).
|
|
73
|
+
- `references/` — ECharts theming model, brand→token mapping, chart recipes, font/SVG embedding.
|
|
74
|
+
- `scripts/` — the render pipeline (`render.mjs`, `render-all.mjs`, `lib/`).
|
|
75
|
+
- `brands/`, `examples/` — demo brands and chart specs.
|
|
76
|
+
- `tests/` — a functional test that renders a chart and asserts brand color + font landed.
|
|
77
|
+
|
|
78
|
+
`node_modules/` and `out/` are generated and gitignored.
|
|
79
|
+
|
|
80
|
+
## Sources
|
|
81
|
+
|
|
82
|
+
- Apache ECharts — theming & options: <https://echarts.apache.org/en/option.html>
|
|
83
|
+
- Apache ECharts — server-side rendering: <https://echarts.apache.org/handbook/en/how-to/cross-platform/server/>
|
|
84
|
+
- resvg-js (SVG→PNG): <https://github.com/yisibl/resvg-js>
|
|
85
|
+
- WCAG 2.1 contrast: <https://www.w3.org/TR/WCAG21/#contrast-minimum>
|
package/skill/SKILL.md
ADDED
|
@@ -0,0 +1,164 @@
|
|
|
1
|
+
---
|
|
2
|
+
name: building-branded-echarts-visualizations
|
|
3
|
+
description: >
|
|
4
|
+
Turns a company's brand styles (color codes + fonts) into polished, on-brand Apache
|
|
5
|
+
ECharts data visualizations — bar, line, area, pie/donut, scatter, KPI cards, heatmap,
|
|
6
|
+
radar, treemap, and full dashboards — rendered server-side to SVG and PNG. Use when you
|
|
7
|
+
need "branded charts", "on-brand data viz", "style ECharts to our brand", "company-branded
|
|
8
|
+
dashboards", "charts that match our brand guidelines", or to produce a reusable chart
|
|
9
|
+
theme from a brand's palette and typography. You give it a brand token file (hex colors,
|
|
10
|
+
font families, optional webfont URLs) and a chart spec (type + data); it emits a styled
|
|
11
|
+
SVG (font-accurate) plus a PNG. Bundled Node scripts do the rendering — no browser needed.
|
|
12
|
+
Invoke it by NAMING a theme — e.g. "apply the Apricot style to all of our analytics charts"
|
|
13
|
+
or "render this data in the Onyx theme" — and it resolves the named style to its brand file
|
|
14
|
+
and applies it to every chart. Bundled themes: onyx, apricot (list with `ls brands/`).
|
|
15
|
+
---
|
|
16
|
+
|
|
17
|
+
# Building Branded ECharts Visualizations
|
|
18
|
+
|
|
19
|
+
Generic charts undercut a brand. This skill makes Apache ECharts charts that look like they
|
|
20
|
+
came out of a company's own design system: its palette, its typefaces, its tone (light or
|
|
21
|
+
dark), applied consistently across every chart type. You capture the brand once as a small
|
|
22
|
+
JSON token file; every chart is rendered from that, so 14 chart types stay visually coherent
|
|
23
|
+
and re-skinning to a new brand is a one-file change.
|
|
24
|
+
|
|
25
|
+
## When to Use This Skill
|
|
26
|
+
|
|
27
|
+
- A client/company wants report, deck, or dashboard charts in **their** brand, not default ECharts blue.
|
|
28
|
+
- You have brand guidelines (hex codes + fonts) and need a **repeatable** way to produce many on-brand charts.
|
|
29
|
+
- You want a reusable **ECharts theme** derived from a brand, plus ready-to-run render scripts.
|
|
30
|
+
- You need static, embeddable outputs (**SVG** for crisp/web, **PNG** for slides) generated headlessly.
|
|
31
|
+
|
|
32
|
+
Not for: live, interactive in-browser dashboards (use ECharts directly in the page); one-off
|
|
33
|
+
charts where branding doesn't matter.
|
|
34
|
+
|
|
35
|
+
## Why On-Brand Charts Are Hard
|
|
36
|
+
|
|
37
|
+
1. **Theming surface area.** A coherent look means setting dozens of ECharts properties (axis
|
|
38
|
+
lines, split lines, label colors, legend, tooltip, title, per-series defaults) — consistently,
|
|
39
|
+
for every chart type. Do it ad hoc and charts drift.
|
|
40
|
+
2. **Palette math.** Brands ship 2–6 colors; a stacked bar or multi-series line needs more, all
|
|
41
|
+
distinguishable *and* legible on the brand's background. Naively repeating or randomizing colors
|
|
42
|
+
looks off-brand and fails contrast.
|
|
43
|
+
3. **Fonts don't travel.** An SVG references a font by name but carries no font data; a PNG
|
|
44
|
+
rasterizer needs the actual font file. Miss this and your "branded" chart silently falls back
|
|
45
|
+
to Arial.
|
|
46
|
+
4. **Light vs dark.** The same palette needs different neutrals, gridlines, and contrast handling
|
|
47
|
+
on white vs near-black. One theme must adapt.
|
|
48
|
+
|
|
49
|
+
## The Brand → Theme Pipeline
|
|
50
|
+
|
|
51
|
+
1. **Capture brand tokens** → `brands/<brand>.json` (schema below). Colors + fonts + a few shape knobs.
|
|
52
|
+
2. **Complete the palette** (`lib/palette.mjs`): reuse the brand's categorical colors, then derive
|
|
53
|
+
extra hues by golden-angle rotation, each contrast-checked against the background, so many-series
|
|
54
|
+
charts stay on-brand and legible.
|
|
55
|
+
3. **Build the ECharts theme** (`lib/theme.mjs`): map tokens → an ECharts theme object (color list,
|
|
56
|
+
background, `textStyle`, title/legend/tooltip, category/value axis treatment, and per-type series
|
|
57
|
+
defaults like bar corner radius and line width). Registered via `echarts.registerTheme`.
|
|
58
|
+
4. **Render per chart type** (`lib/charts.mjs`): each builder supplies only data + type-specific
|
|
59
|
+
touches; all styling comes from the theme. Heatmaps use a **sequential single-hue ramp** from the
|
|
60
|
+
primary color (never the categorical rainbow).
|
|
61
|
+
5. **Embed fonts + rasterize** (`lib/fonts.mjs`): inject `@font-face` (webfont URL) into the SVG so a
|
|
62
|
+
browser renders the real brand font; for PNG, `@resvg/resvg-js` uses any local font file declared
|
|
63
|
+
on the brand, else a system fallback. **SVG is the font-accurate source of truth.**
|
|
64
|
+
|
|
65
|
+
## Brand Token Schema (`brands/*.json`)
|
|
66
|
+
|
|
67
|
+
```json
|
|
68
|
+
{
|
|
69
|
+
"name": "Onyx",
|
|
70
|
+
"mode": "dark", // "light" | "dark" — drives default neutrals
|
|
71
|
+
"colors": {
|
|
72
|
+
// Monochrome: ONE hue (or greyscale) stepped light → deep (auto-extended, contrast-checked)
|
|
73
|
+
"categorical": ["#f4f6f7", "#7e858e", "#c0c5cb", "#565d67", "#9aa1a9", "#3f454e"],
|
|
74
|
+
"background": "#0b0d10", "surface": "#15181c",
|
|
75
|
+
"text": "#fafafa", "textMuted": "#8a9099",
|
|
76
|
+
"axis": "#2a2e34", "grid": "#1a1d21",
|
|
77
|
+
"positive": "#e8e9eb", "negative": "#787e86"
|
|
78
|
+
},
|
|
79
|
+
"fonts": {
|
|
80
|
+
"family": "Inter", "titleFamily": "Space Grotesk", "baseSize": 14,
|
|
81
|
+
"faces": [ // for SVG @font-face (url) + PNG (optional file)
|
|
82
|
+
{ "family": "Inter", "weight": 400, "url": "https://.../inter-400.woff2" },
|
|
83
|
+
{ "family": "Space Grotesk", "weight": 700, "url": "https://.../space-grotesk-700.woff2", "file": "fonts/SpaceGrotesk.ttf" }
|
|
84
|
+
]
|
|
85
|
+
},
|
|
86
|
+
"shape": { "barRadius": 2, "lineWidth": 2, "symbolSize": 7, "gridline": "dashed" }
|
|
87
|
+
}
|
|
88
|
+
```
|
|
89
|
+
|
|
90
|
+
Only `name`, `colors.categorical`, and `colors.background` are strictly required — everything else
|
|
91
|
+
has sensible per-mode defaults. **Editing this file (colors/fonts) and re-running is the whole
|
|
92
|
+
workflow.** Fonts are referenced, never bundled as binaries.
|
|
93
|
+
|
|
94
|
+
## Running the Scripts
|
|
95
|
+
|
|
96
|
+
```bash
|
|
97
|
+
cd scripts && npm install # echarts + @resvg/resvg-js (no native toolchain needed)
|
|
98
|
+
|
|
99
|
+
# One chart:
|
|
100
|
+
node render.mjs --brand ../brands/onyx.json --chart ../examples/05_line.json --out ../out/onyx/line.svg
|
|
101
|
+
|
|
102
|
+
# Everything — every example × every brand → out/<brand>/*.svg + *.png + out/index.html gallery:
|
|
103
|
+
node render-all.mjs
|
|
104
|
+
```
|
|
105
|
+
|
|
106
|
+
To brand it for a new company: copy a `brands/*.json`, drop in their hex codes and font families
|
|
107
|
+
(+ webfont URLs), run `render-all.mjs`, open `out/index.html`.
|
|
108
|
+
|
|
109
|
+
## Invoking by Theme Name
|
|
110
|
+
|
|
111
|
+
A user will usually just **name a theme** and a dataset — e.g. *"apply the Apricot style to all of
|
|
112
|
+
our analytics charts."* Resolve it like this:
|
|
113
|
+
|
|
114
|
+
1. **Map the named style → a brand file.** A theme name is a `brands/<name>.json` (case-insensitive;
|
|
115
|
+
`ls brands/` lists what's available — bundled: `onyx`, `apricot`). "Apricot style" → `brands/apricot.json`.
|
|
116
|
+
- If the named theme isn't bundled (e.g. *"apply our Acme brand"*), first create
|
|
117
|
+
`brands/<name>.json` from the user's hex codes + fonts, then proceed.
|
|
118
|
+
2. **Gather the data as chart specs.** Turn each chart the user wants into an `examples/*.json`
|
|
119
|
+
spec (`{type, title, data}`) — one per chart. For "all of our analytics charts," create a spec
|
|
120
|
+
per dataset/metric they gave you.
|
|
121
|
+
3. **Apply the theme to every chart.** Render each spec with the resolved brand:
|
|
122
|
+
`node render.mjs --brand brands/<theme>.json --chart <spec>.json --out out/<theme>/<name>.svg`
|
|
123
|
+
(or drop the specs in `examples/` and run `render-all.mjs` to do the whole set in that theme).
|
|
124
|
+
4. **Return the artifacts** — the `out/<theme>/*.svg` (+ `.png`) files.
|
|
125
|
+
|
|
126
|
+
So "apply the Apricot style to all our analytics charts" = resolve `apricot` → `brands/apricot.json`,
|
|
127
|
+
build a spec per chart, render them all with that brand. The skill is "theme-aware": the user names
|
|
128
|
+
the look, you map it to the brand file and apply it across the data.
|
|
129
|
+
|
|
130
|
+
## Chart-Type Recipes (the 14 builders)
|
|
131
|
+
|
|
132
|
+
`bar`, `groupedBar`, `stackedBar`, `hbar`, `line`, `area`, `pie`, `donut`, `scatter`, `kpi`
|
|
133
|
+
(graphic number cards w/ colored deltas), `heatmap` (sequential ramp), `radar`, `treemap`, and
|
|
134
|
+
`dashboard` (KPI strip + bar + line composite). See `references/chart-type-recipes.md` for the
|
|
135
|
+
`spec.data` shape and which tokens each one leans on.
|
|
136
|
+
|
|
137
|
+
## Anti-Patterns
|
|
138
|
+
|
|
139
|
+
- **Default ECharts palette** on a branded deck — instantly reads as "stock chart."
|
|
140
|
+
- **Rainbow heatmaps** — using categorical colors for magnitude is unreadable; use a single-hue ramp.
|
|
141
|
+
- **Bundling `.ttf`/`.woff2` binaries** — they bloat the package and are stripped on publish; reference fonts by URL.
|
|
142
|
+
- **Low-contrast text/series** on the brand background — always contrast-check (this skill does, automatically).
|
|
143
|
+
- **Too many raw series colors** — beyond ~6, derive harmonized hues instead of inventing clashing ones.
|
|
144
|
+
- **Ignoring light/dark** — reusing white-mode neutrals on a dark brand kills legibility.
|
|
145
|
+
|
|
146
|
+
## Output
|
|
147
|
+
|
|
148
|
+
Per chart: a font-accurate **`.svg`** (with embedded `@font-face`) and a 2× **`.png`**. `render-all.mjs`
|
|
149
|
+
also writes **`out/index.html`**, a side-by-side gallery of every brand × chart for quick review.
|
|
150
|
+
|
|
151
|
+
## References
|
|
152
|
+
|
|
153
|
+
- `references/echarts-theming-model.md` — the ECharts theme object + server-side rendering (`renderToSVGString`).
|
|
154
|
+
- `references/brand-style-mapping.md` — turning a brand style guide into tokens (+ WCAG contrast).
|
|
155
|
+
- `references/chart-type-recipes.md` — per-type `spec.data` shapes and token usage.
|
|
156
|
+
- `references/fonts-and-svg-embedding.md` — `@font-face` in SVG, resvg fonts for PNG, why binaries aren't bundled.
|
|
157
|
+
|
|
158
|
+
## Verification Checklist
|
|
159
|
+
|
|
160
|
+
- [ ] `npm install` succeeds; `node render-all.mjs` renders all charts for every brand with no errors.
|
|
161
|
+
- [ ] Each `out/<brand>/*.svg` contains a brand categorical hex **and** the brand `font-family`.
|
|
162
|
+
- [ ] The brands look distinctly on-brand from identical data (palette, neutrals, type, light/dark).
|
|
163
|
+
- [ ] Editing a color/font in a `brands/*.json` and re-running propagates everywhere.
|
|
164
|
+
- [ ] `python3 tests/test_building_branded_echarts_visualizations.py` prints `PASSED`.
|
|
@@ -0,0 +1,30 @@
|
|
|
1
|
+
{
|
|
2
|
+
"name": "Apricot",
|
|
3
|
+
"mode": "dark",
|
|
4
|
+
"colors": {
|
|
5
|
+
"categorical": ["#ffe0c2", "#eda468", "#fac59a", "#db8a43", "#f1b783", "#ba6d2f"],
|
|
6
|
+
"background": "#160f08",
|
|
7
|
+
"surface": "#241710",
|
|
8
|
+
"text": "#fbeee2",
|
|
9
|
+
"textMuted": "#c2a288",
|
|
10
|
+
"axis": "#3c2c1e",
|
|
11
|
+
"grid": "#241810",
|
|
12
|
+
"positive": "#ffe0c2",
|
|
13
|
+
"negative": "#ba6d2f"
|
|
14
|
+
},
|
|
15
|
+
"fonts": {
|
|
16
|
+
"family": "Inter",
|
|
17
|
+
"titleFamily": "Outfit",
|
|
18
|
+
"monoFamily": "JetBrains Mono",
|
|
19
|
+
"baseSize": 14,
|
|
20
|
+
"weights": { "regular": 400, "medium": 600, "bold": 700 },
|
|
21
|
+
"faces": [
|
|
22
|
+
{ "family": "Inter", "weight": 400, "url": "https://cdn.jsdelivr.net/fontsource/fonts/inter@latest/latin-400-normal.woff2" },
|
|
23
|
+
{ "family": "Inter", "weight": 600, "url": "https://cdn.jsdelivr.net/fontsource/fonts/inter@latest/latin-600-normal.woff2" },
|
|
24
|
+
{ "family": "Outfit", "weight": 600, "url": "https://cdn.jsdelivr.net/fontsource/fonts/outfit@latest/latin-600-normal.woff2" },
|
|
25
|
+
{ "family": "Outfit", "weight": 700, "url": "https://cdn.jsdelivr.net/fontsource/fonts/outfit@latest/latin-700-normal.woff2" }
|
|
26
|
+
]
|
|
27
|
+
},
|
|
28
|
+
"shape": { "barRadius": 5, "lineWidth": 2.5, "symbolSize": 8, "gridline": "dashed" },
|
|
29
|
+
"logo": { "text": "APRICOT" }
|
|
30
|
+
}
|
|
@@ -0,0 +1,31 @@
|
|
|
1
|
+
{
|
|
2
|
+
"name": "Onyx",
|
|
3
|
+
"mode": "dark",
|
|
4
|
+
"colors": {
|
|
5
|
+
"categorical": ["#f4f6f7", "#7e858e", "#c0c5cb", "#565d67", "#9aa1a9", "#3f454e"],
|
|
6
|
+
"background": "#0b0d10",
|
|
7
|
+
"surface": "#15181c",
|
|
8
|
+
"text": "#fafafa",
|
|
9
|
+
"textMuted": "#8a9099",
|
|
10
|
+
"axis": "#2a2e34",
|
|
11
|
+
"grid": "#1a1d21",
|
|
12
|
+
"positive": "#e8e9eb",
|
|
13
|
+
"negative": "#787e86"
|
|
14
|
+
},
|
|
15
|
+
"fonts": {
|
|
16
|
+
"family": "Inter",
|
|
17
|
+
"titleFamily": "Space Grotesk",
|
|
18
|
+
"monoFamily": "JetBrains Mono",
|
|
19
|
+
"baseSize": 14,
|
|
20
|
+
"weights": { "regular": 400, "medium": 600, "bold": 700 },
|
|
21
|
+
"faces": [
|
|
22
|
+
{ "family": "Inter", "weight": 400, "url": "https://cdn.jsdelivr.net/fontsource/fonts/inter@latest/latin-400-normal.woff2" },
|
|
23
|
+
{ "family": "Inter", "weight": 600, "url": "https://cdn.jsdelivr.net/fontsource/fonts/inter@latest/latin-600-normal.woff2" },
|
|
24
|
+
{ "family": "Inter", "weight": 700, "url": "https://cdn.jsdelivr.net/fontsource/fonts/inter@latest/latin-700-normal.woff2" },
|
|
25
|
+
{ "family": "Space Grotesk", "weight": 600, "url": "https://cdn.jsdelivr.net/fontsource/fonts/space-grotesk@latest/latin-600-normal.woff2" },
|
|
26
|
+
{ "family": "Space Grotesk", "weight": 700, "url": "https://cdn.jsdelivr.net/fontsource/fonts/space-grotesk@latest/latin-700-normal.woff2" }
|
|
27
|
+
]
|
|
28
|
+
},
|
|
29
|
+
"shape": { "barRadius": 2, "lineWidth": 2, "symbolSize": 7, "gridline": "dashed" },
|
|
30
|
+
"logo": { "text": "ONYX" }
|
|
31
|
+
}
|
|
@@ -0,0 +1,12 @@
|
|
|
1
|
+
{
|
|
2
|
+
"type": "bar",
|
|
3
|
+
"title": "Revenue by quarter",
|
|
4
|
+
"subtitle": "FY2026 · $M",
|
|
5
|
+
"width": 900,
|
|
6
|
+
"height": 540,
|
|
7
|
+
"yName": "$M",
|
|
8
|
+
"data": {
|
|
9
|
+
"categories": ["Q1", "Q2", "Q3", "Q4"],
|
|
10
|
+
"series": [{ "name": "Revenue", "data": [42, 51, 49, 63] }]
|
|
11
|
+
}
|
|
12
|
+
}
|
|
@@ -0,0 +1,16 @@
|
|
|
1
|
+
{
|
|
2
|
+
"type": "groupedBar",
|
|
3
|
+
"title": "Revenue by region",
|
|
4
|
+
"subtitle": "FY2026 · $M",
|
|
5
|
+
"width": 960,
|
|
6
|
+
"height": 540,
|
|
7
|
+
"yName": "$M",
|
|
8
|
+
"data": {
|
|
9
|
+
"categories": ["Q1", "Q2", "Q3", "Q4"],
|
|
10
|
+
"series": [
|
|
11
|
+
{ "name": "Americas", "data": [22, 26, 25, 31] },
|
|
12
|
+
{ "name": "EMEA", "data": [14, 17, 16, 21] },
|
|
13
|
+
{ "name": "APAC", "data": [9, 11, 13, 16] }
|
|
14
|
+
]
|
|
15
|
+
}
|
|
16
|
+
}
|
|
@@ -0,0 +1,16 @@
|
|
|
1
|
+
{
|
|
2
|
+
"type": "stackedBar",
|
|
3
|
+
"title": "Bookings by plan",
|
|
4
|
+
"subtitle": "Stacked · thousands",
|
|
5
|
+
"width": 960,
|
|
6
|
+
"height": 540,
|
|
7
|
+
"yName": "k",
|
|
8
|
+
"data": {
|
|
9
|
+
"categories": ["Jan", "Feb", "Mar", "Apr", "May", "Jun"],
|
|
10
|
+
"series": [
|
|
11
|
+
{ "name": "Starter", "data": [12, 14, 13, 16, 18, 19] },
|
|
12
|
+
{ "name": "Pro", "data": [8, 9, 11, 12, 13, 15] },
|
|
13
|
+
{ "name": "Enterprise", "data": [3, 4, 4, 6, 7, 9] }
|
|
14
|
+
]
|
|
15
|
+
}
|
|
16
|
+
}
|
|
@@ -0,0 +1,12 @@
|
|
|
1
|
+
{
|
|
2
|
+
"type": "hbar",
|
|
3
|
+
"title": "Top products by units sold",
|
|
4
|
+
"subtitle": "Last 30 days",
|
|
5
|
+
"width": 900,
|
|
6
|
+
"height": 540,
|
|
7
|
+
"xName": "units",
|
|
8
|
+
"data": {
|
|
9
|
+
"categories": ["Atlas", "Beacon", "Cobalt", "Drift", "Ember", "Forge"],
|
|
10
|
+
"series": [{ "name": "Units", "data": [1840, 1610, 1320, 980, 870, 540] }]
|
|
11
|
+
}
|
|
12
|
+
}
|
|
@@ -0,0 +1,16 @@
|
|
|
1
|
+
{
|
|
2
|
+
"type": "line",
|
|
3
|
+
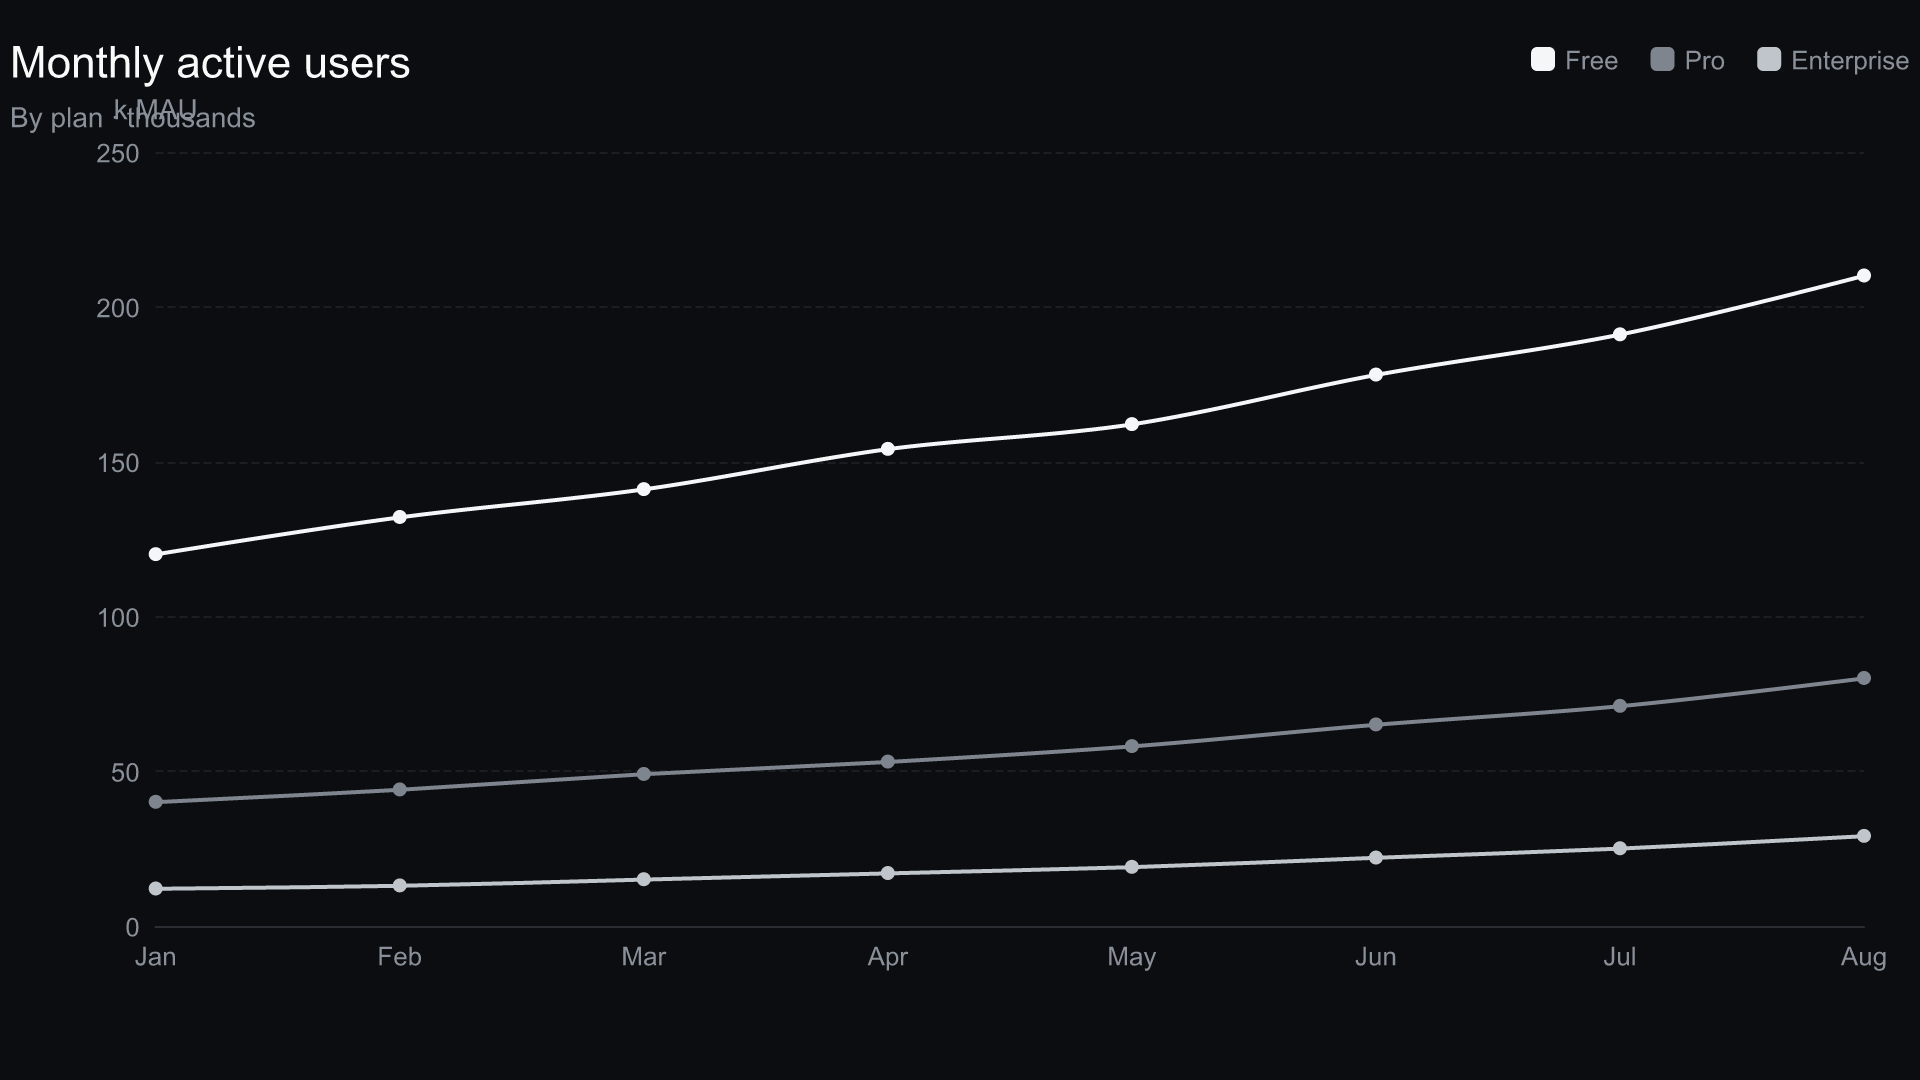
"title": "Monthly active users",
|
|
4
|
+
"subtitle": "By plan · thousands",
|
|
5
|
+
"width": 960,
|
|
6
|
+
"height": 540,
|
|
7
|
+
"yName": "k MAU",
|
|
8
|
+
"data": {
|
|
9
|
+
"categories": ["Jan", "Feb", "Mar", "Apr", "May", "Jun", "Jul", "Aug"],
|
|
10
|
+
"series": [
|
|
11
|
+
{ "name": "Free", "data": [120, 132, 141, 154, 162, 178, 191, 210] },
|
|
12
|
+
{ "name": "Pro", "data": [40, 44, 49, 53, 58, 65, 71, 80] },
|
|
13
|
+
{ "name": "Enterprise", "data": [12, 13, 15, 17, 19, 22, 25, 29] }
|
|
14
|
+
]
|
|
15
|
+
}
|
|
16
|
+
}
|
|
@@ -0,0 +1,15 @@
|
|
|
1
|
+
{
|
|
2
|
+
"type": "area",
|
|
3
|
+
"title": "Traffic by source",
|
|
4
|
+
"subtitle": "Sessions · thousands",
|
|
5
|
+
"width": 960,
|
|
6
|
+
"height": 540,
|
|
7
|
+
"yName": "k",
|
|
8
|
+
"data": {
|
|
9
|
+
"categories": ["Mon", "Tue", "Wed", "Thu", "Fri", "Sat", "Sun"],
|
|
10
|
+
"series": [
|
|
11
|
+
{ "name": "Organic", "data": [32, 38, 41, 44, 48, 30, 26] },
|
|
12
|
+
{ "name": "Paid", "data": [18, 21, 22, 25, 27, 19, 15] }
|
|
13
|
+
]
|
|
14
|
+
}
|
|
15
|
+
}
|
|
@@ -0,0 +1,16 @@
|
|
|
1
|
+
{
|
|
2
|
+
"type": "pie",
|
|
3
|
+
"title": "Market share",
|
|
4
|
+
"subtitle": "By vendor",
|
|
5
|
+
"width": 900,
|
|
6
|
+
"height": 540,
|
|
7
|
+
"data": {
|
|
8
|
+
"items": [
|
|
9
|
+
{ "name": "Acme", "value": 38 },
|
|
10
|
+
{ "name": "Globex", "value": 24 },
|
|
11
|
+
{ "name": "Initech", "value": 18 },
|
|
12
|
+
{ "name": "Umbrella", "value": 12 },
|
|
13
|
+
{ "name": "Other", "value": 8 }
|
|
14
|
+
]
|
|
15
|
+
}
|
|
16
|
+
}
|
|
@@ -0,0 +1,17 @@
|
|
|
1
|
+
{
|
|
2
|
+
"type": "donut",
|
|
3
|
+
"title": "Cloud spend by category",
|
|
4
|
+
"subtitle": "This month",
|
|
5
|
+
"centerLabel": "$84k",
|
|
6
|
+
"width": 900,
|
|
7
|
+
"height": 540,
|
|
8
|
+
"data": {
|
|
9
|
+
"items": [
|
|
10
|
+
{ "name": "Compute", "value": 38 },
|
|
11
|
+
{ "name": "Storage", "value": 21 },
|
|
12
|
+
{ "name": "Network", "value": 14 },
|
|
13
|
+
{ "name": "Data", "value": 17 },
|
|
14
|
+
{ "name": "Other", "value": 10 }
|
|
15
|
+
]
|
|
16
|
+
}
|
|
17
|
+
}
|
|
@@ -0,0 +1,15 @@
|
|
|
1
|
+
{
|
|
2
|
+
"type": "scatter",
|
|
3
|
+
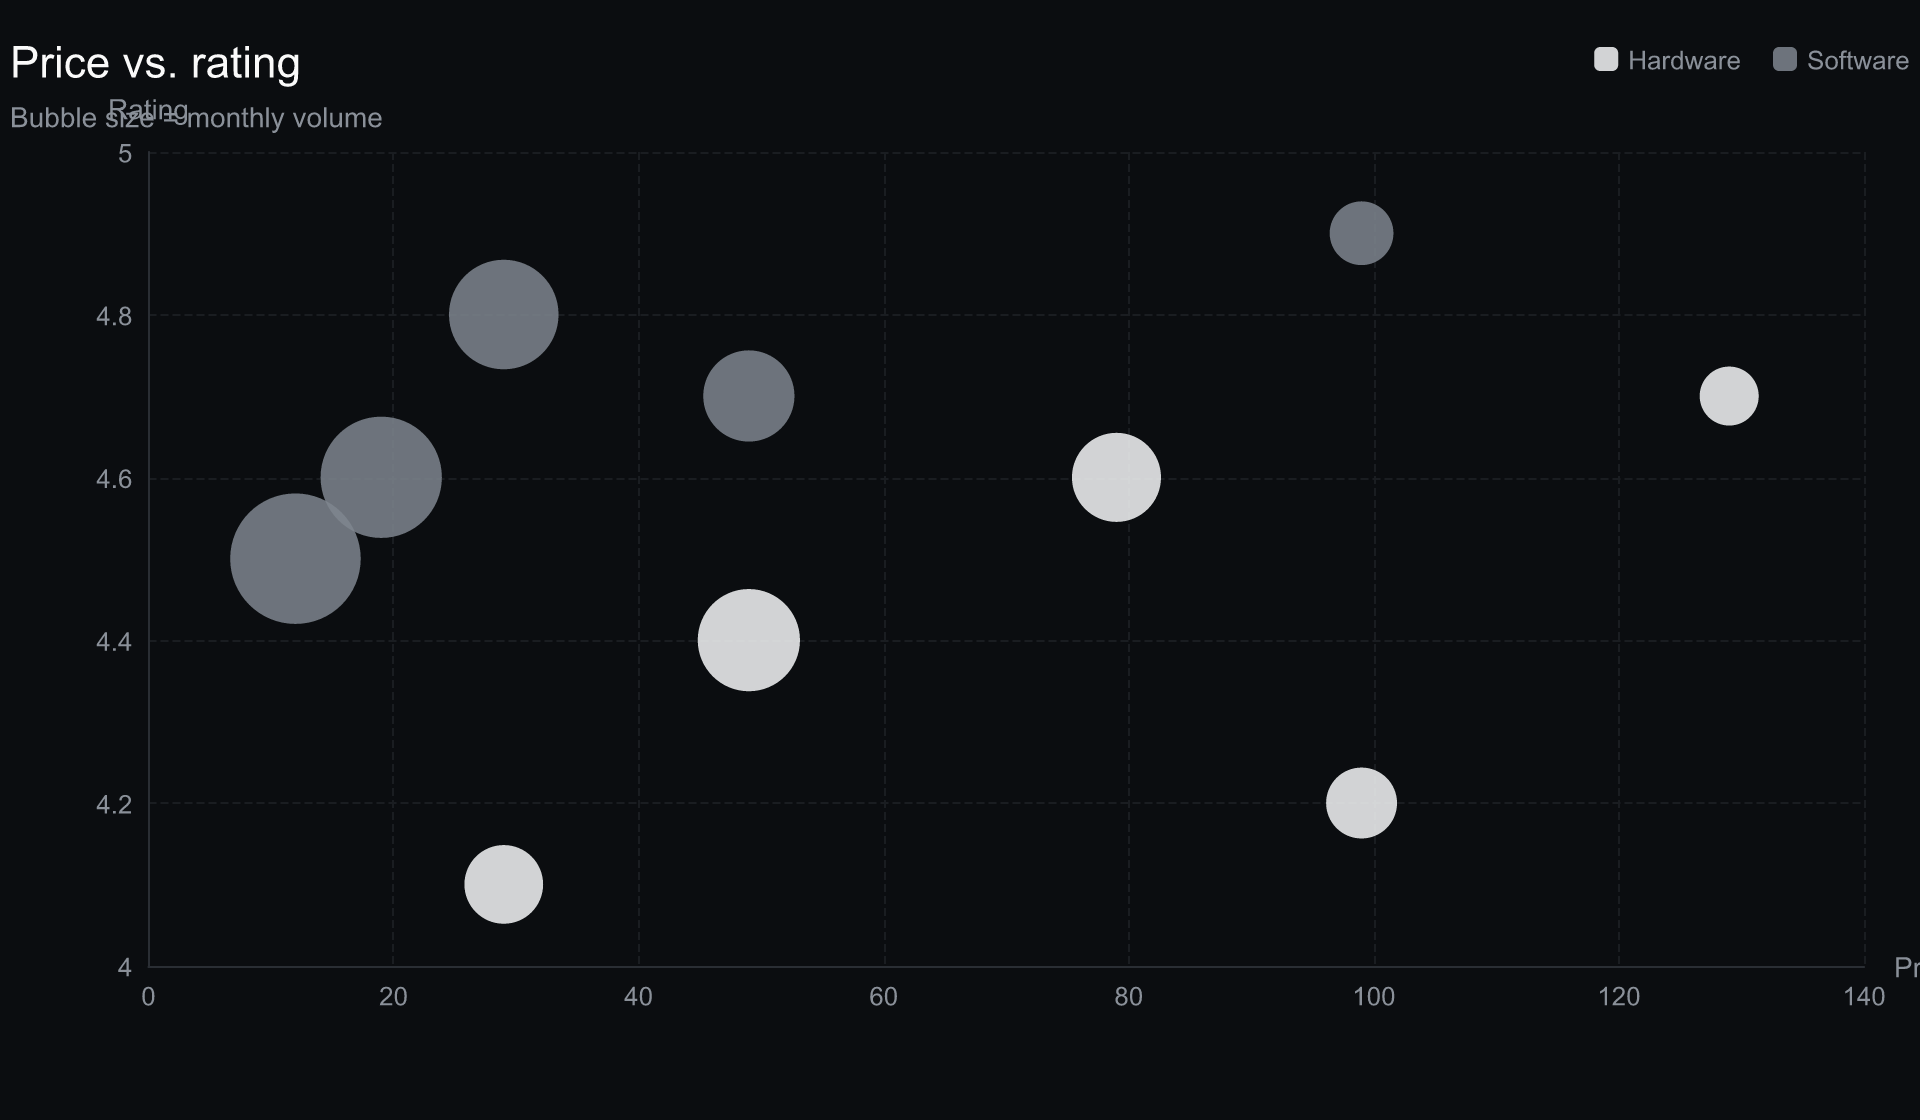
"title": "Price vs. rating",
|
|
4
|
+
"subtitle": "Bubble size = monthly volume",
|
|
5
|
+
"width": 960,
|
|
6
|
+
"height": 560,
|
|
7
|
+
"xName": "Price ($)",
|
|
8
|
+
"yName": "Rating",
|
|
9
|
+
"data": {
|
|
10
|
+
"series": [
|
|
11
|
+
{ "name": "Hardware", "points": [[29, 4.1, 320], [49, 4.4, 540], [79, 4.6, 410], [99, 4.2, 260], [129, 4.7, 180]] },
|
|
12
|
+
{ "name": "Software", "points": [[12, 4.5, 880], [19, 4.6, 760], [29, 4.8, 620], [49, 4.7, 430], [99, 4.9, 210]] }
|
|
13
|
+
]
|
|
14
|
+
}
|
|
15
|
+
}
|
|
@@ -0,0 +1,15 @@
|
|
|
1
|
+
{
|
|
2
|
+
"type": "kpi",
|
|
3
|
+
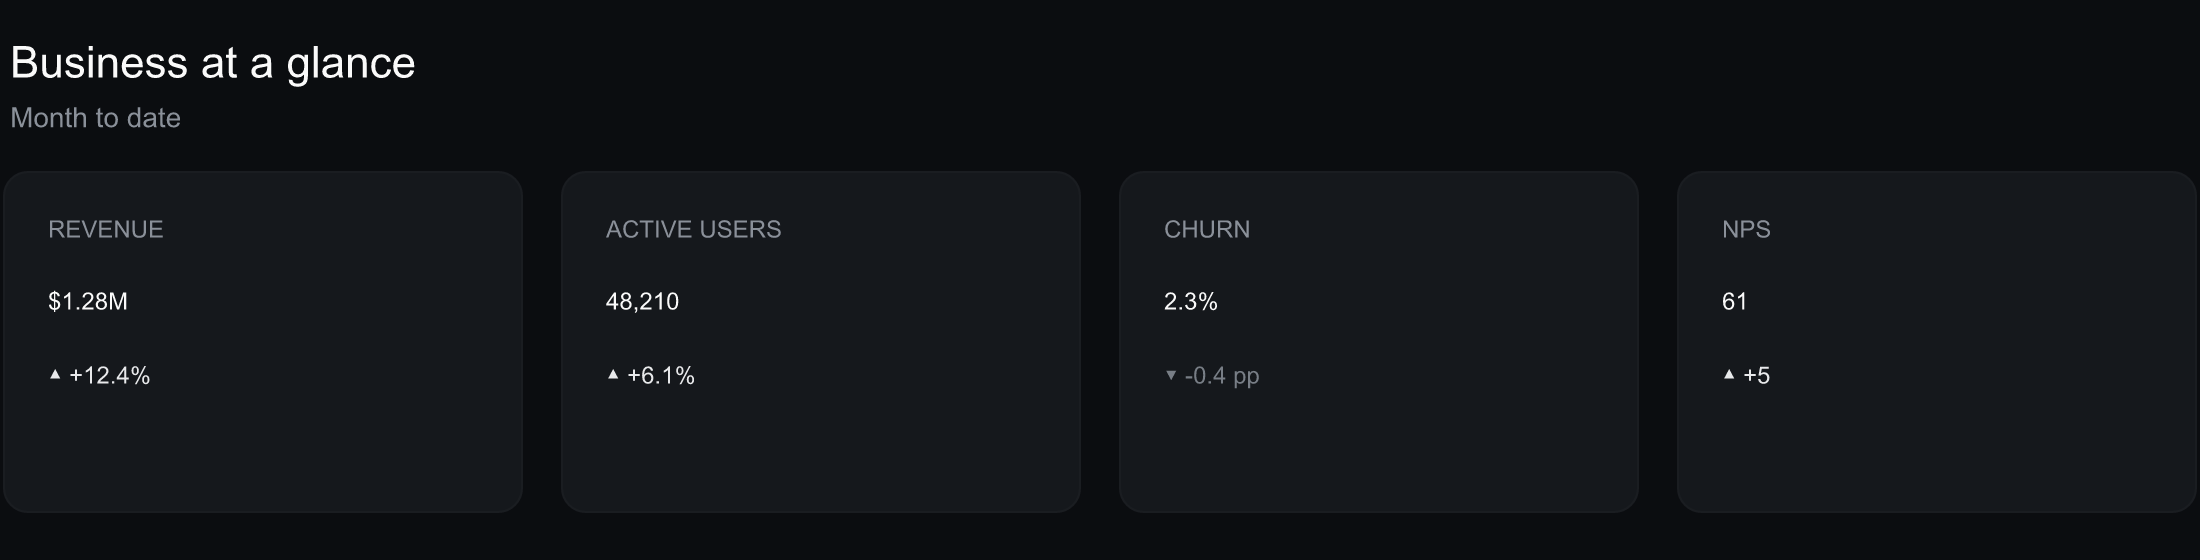
"title": "Business at a glance",
|
|
4
|
+
"subtitle": "Month to date",
|
|
5
|
+
"width": 1100,
|
|
6
|
+
"height": 280,
|
|
7
|
+
"data": {
|
|
8
|
+
"cards": [
|
|
9
|
+
{ "label": "Revenue", "value": "$1.28M", "delta": "+12.4%", "deltaDir": "up" },
|
|
10
|
+
{ "label": "Active users", "value": "48,210", "delta": "+6.1%", "deltaDir": "up" },
|
|
11
|
+
{ "label": "Churn", "value": "2.3%", "delta": "-0.4 pp", "deltaDir": "down" },
|
|
12
|
+
{ "label": "NPS", "value": "61", "delta": "+5", "deltaDir": "up" }
|
|
13
|
+
]
|
|
14
|
+
}
|
|
15
|
+
}
|
|
@@ -0,0 +1,21 @@
|
|
|
1
|
+
{
|
|
2
|
+
"type": "heatmap",
|
|
3
|
+
"title": "Activity by day and hour",
|
|
4
|
+
"subtitle": "Sessions",
|
|
5
|
+
"width": 1000,
|
|
6
|
+
"height": 560,
|
|
7
|
+
"showValues": false,
|
|
8
|
+
"data": {
|
|
9
|
+
"x": ["12a", "2a", "4a", "6a", "8a", "10a", "12p", "2p", "4p", "6p", "8p", "10p"],
|
|
10
|
+
"y": ["Sun", "Mon", "Tue", "Wed", "Thu", "Fri", "Sat"],
|
|
11
|
+
"values": [
|
|
12
|
+
[0,0,2],[1,0,1],[2,0,1],[3,0,3],[4,0,6],[5,0,9],[6,0,12],[7,0,11],[8,0,9],[9,0,7],[10,0,5],[11,0,3],
|
|
13
|
+
[0,1,1],[1,1,1],[2,1,1],[3,1,4],[4,1,9],[5,1,14],[6,1,18],[7,1,17],[8,1,15],[9,1,10],[10,1,6],[11,1,3],
|
|
14
|
+
[0,2,1],[1,2,1],[2,2,2],[3,2,5],[4,2,10],[5,2,16],[6,2,20],[7,2,19],[8,2,16],[9,2,11],[10,2,6],[11,2,3],
|
|
15
|
+
[0,3,1],[1,3,1],[2,3,2],[3,3,5],[4,3,11],[5,3,17],[6,3,21],[7,3,20],[8,3,17],[9,3,12],[10,3,7],[11,3,4],
|
|
16
|
+
[0,4,2],[1,4,1],[2,4,2],[3,4,6],[4,4,12],[5,4,18],[6,4,22],[7,4,21],[8,4,18],[9,4,13],[10,4,8],[11,4,5],
|
|
17
|
+
[0,5,2],[1,5,2],[2,5,2],[3,5,5],[4,5,10],[5,5,15],[6,5,17],[7,5,16],[8,5,15],[9,5,14],[10,5,11],[11,5,7],
|
|
18
|
+
[0,6,3],[1,6,2],[2,6,2],[3,6,4],[4,6,7],[5,6,10],[6,6,12],[7,6,12],[8,6,13],[9,6,13],[10,6,11],[11,6,8]
|
|
19
|
+
]
|
|
20
|
+
}
|
|
21
|
+
}
|
|
@@ -0,0 +1,21 @@
|
|
|
1
|
+
{
|
|
2
|
+
"type": "radar",
|
|
3
|
+
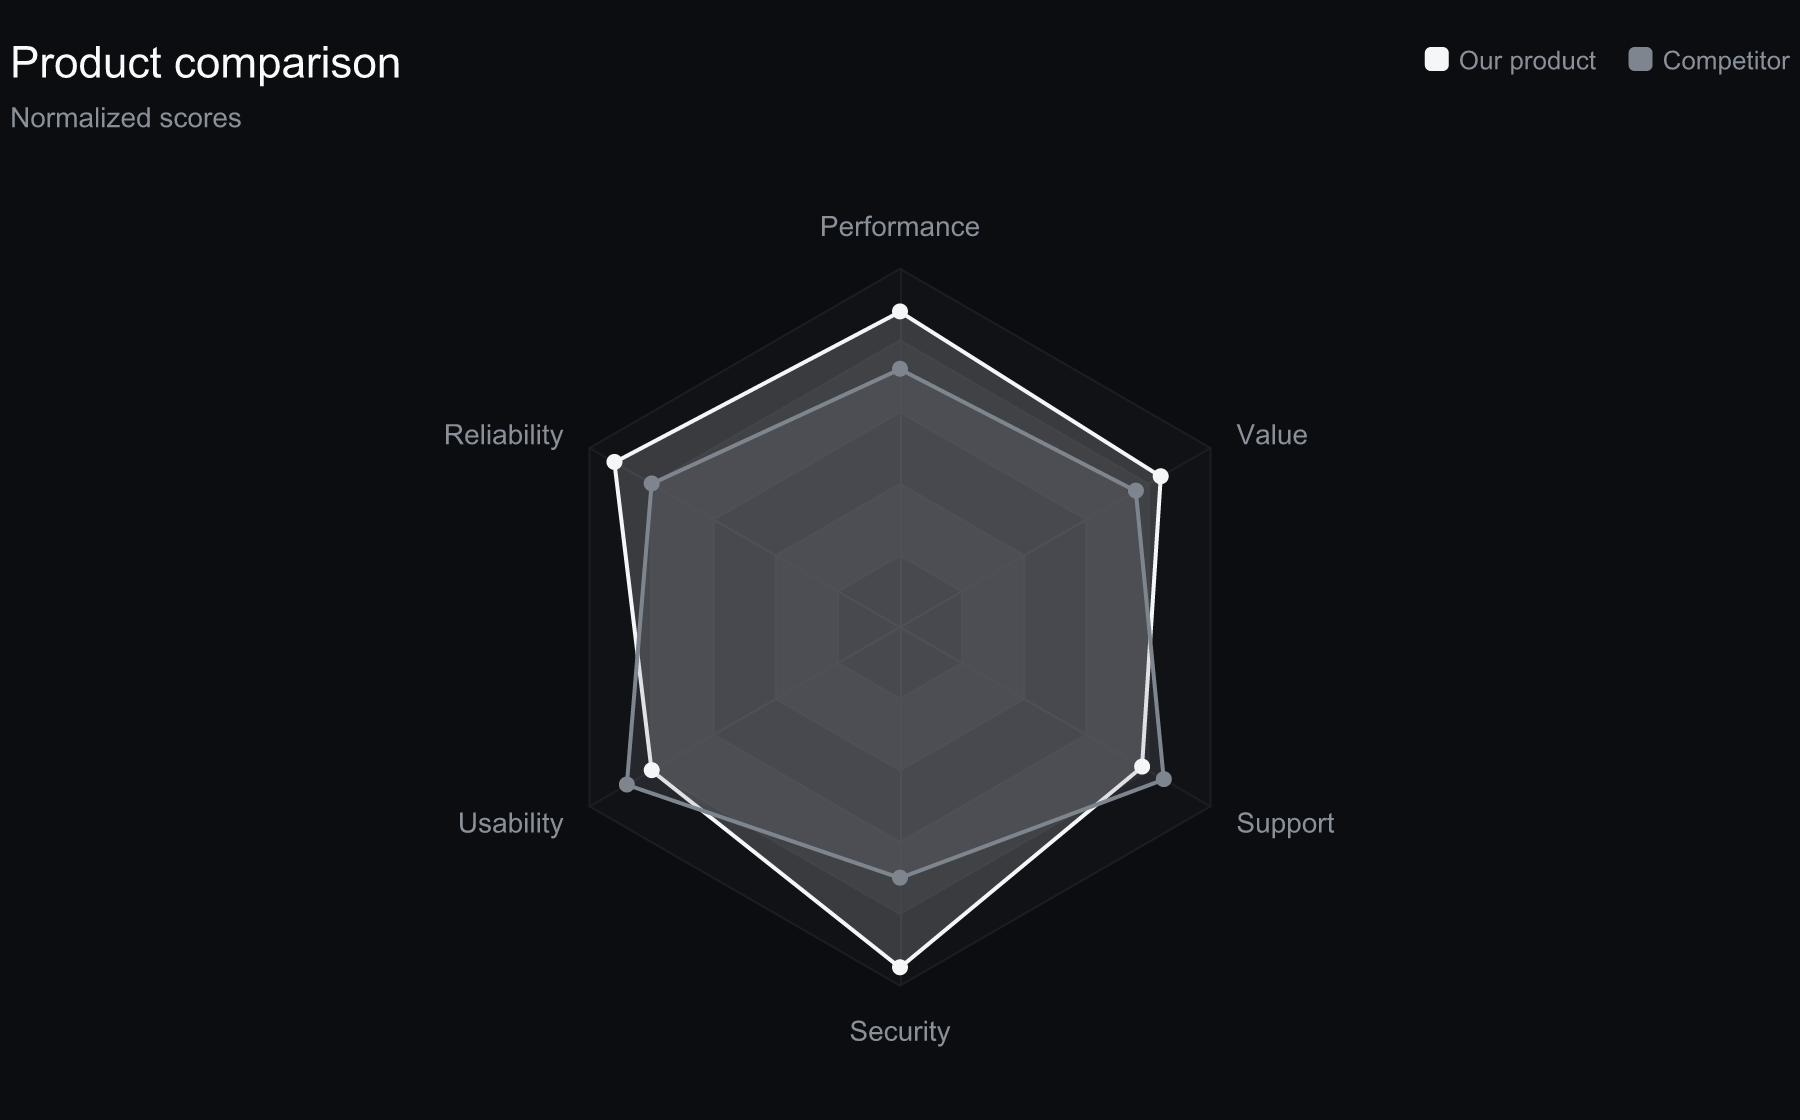
"title": "Product comparison",
|
|
4
|
+
"subtitle": "Normalized scores",
|
|
5
|
+
"width": 900,
|
|
6
|
+
"height": 560,
|
|
7
|
+
"data": {
|
|
8
|
+
"indicators": [
|
|
9
|
+
{ "name": "Performance", "max": 100 },
|
|
10
|
+
{ "name": "Reliability", "max": 100 },
|
|
11
|
+
{ "name": "Usability", "max": 100 },
|
|
12
|
+
{ "name": "Security", "max": 100 },
|
|
13
|
+
{ "name": "Support", "max": 100 },
|
|
14
|
+
{ "name": "Value", "max": 100 }
|
|
15
|
+
],
|
|
16
|
+
"series": [
|
|
17
|
+
{ "name": "Our product", "value": [88, 92, 80, 95, 78, 84] },
|
|
18
|
+
{ "name": "Competitor", "value": [72, 80, 88, 70, 85, 76] }
|
|
19
|
+
]
|
|
20
|
+
}
|
|
21
|
+
}
|
|
@@ -0,0 +1,20 @@
|
|
|
1
|
+
{
|
|
2
|
+
"type": "treemap",
|
|
3
|
+
"title": "Revenue by segment",
|
|
4
|
+
"subtitle": "Segment › product",
|
|
5
|
+
"width": 1000,
|
|
6
|
+
"height": 560,
|
|
7
|
+
"data": {
|
|
8
|
+
"nodes": [
|
|
9
|
+
{ "name": "Enterprise", "value": 52, "children": [
|
|
10
|
+
{ "name": "Platform", "value": 30 }, { "name": "Add-ons", "value": 12 }, { "name": "Services", "value": 10 }
|
|
11
|
+
]},
|
|
12
|
+
{ "name": "Mid-market", "value": 33, "children": [
|
|
13
|
+
{ "name": "Platform", "value": 19 }, { "name": "Add-ons", "value": 9 }, { "name": "Services", "value": 5 }
|
|
14
|
+
]},
|
|
15
|
+
{ "name": "SMB", "value": 21, "children": [
|
|
16
|
+
{ "name": "Starter", "value": 13 }, { "name": "Pro", "value": 8 }
|
|
17
|
+
]}
|
|
18
|
+
]
|
|
19
|
+
}
|
|
20
|
+
}
|
|
@@ -0,0 +1,28 @@
|
|
|
1
|
+
{
|
|
2
|
+
"type": "dashboard",
|
|
3
|
+
"title": "Q3 performance dashboard",
|
|
4
|
+
"subtitle": "Company KPIs · revenue · growth",
|
|
5
|
+
"width": 1200,
|
|
6
|
+
"height": 760,
|
|
7
|
+
"data": {
|
|
8
|
+
"cards": [
|
|
9
|
+
{ "label": "Revenue", "value": "$1.28M", "delta": "+12.4%", "deltaDir": "up" },
|
|
10
|
+
{ "label": "Gross margin", "value": "71%", "delta": "+1.8 pp", "deltaDir": "up" },
|
|
11
|
+
{ "label": "Active users", "value": "48.2k", "delta": "+6.1%", "deltaDir": "up" },
|
|
12
|
+
{ "label": "Churn", "value": "2.3%", "delta": "-0.4 pp", "deltaDir": "down" }
|
|
13
|
+
],
|
|
14
|
+
"bar": {
|
|
15
|
+
"categories": ["Americas", "EMEA", "APAC"],
|
|
16
|
+
"series": [
|
|
17
|
+
{ "name": "New", "data": [31, 21, 16] },
|
|
18
|
+
{ "name": "Expansion", "data": [12, 9, 7] }
|
|
19
|
+
]
|
|
20
|
+
},
|
|
21
|
+
"line": {
|
|
22
|
+
"categories": ["Apr", "May", "Jun", "Jul", "Aug", "Sep"],
|
|
23
|
+
"series": [
|
|
24
|
+
{ "name": "MRR ($k)", "data": [820, 870, 910, 980, 1040, 1120] }
|
|
25
|
+
]
|
|
26
|
+
}
|
|
27
|
+
}
|
|
28
|
+
}
|
|
@@ -0,0 +1,58 @@
|
|
|
1
|
+
# Mapping a brand style guide → chart tokens
|
|
2
|
+
|
|
3
|
+
How to translate a company's brand guidelines into the `brands/*.json` token file.
|
|
4
|
+
|
|
5
|
+
## Colors
|
|
6
|
+
|
|
7
|
+
| Brand guideline element | Token | Notes |
|
|
8
|
+
|---|---|---|
|
|
9
|
+
| Primary + secondary + accent colors | `colors.categorical[]` | Series colors. Order them by visual priority; the 1st is the "hero" hue (also used for heatmap ramps). |
|
|
10
|
+
| Page/canvas color | `colors.background` | White-ish for light mode, near-black for dark. |
|
|
11
|
+
| Card/panel color | `colors.surface` | KPI cards, tooltip background. Slightly off the background. |
|
|
12
|
+
| Body text color | `colors.text` | Titles, data labels. |
|
|
13
|
+
| Secondary text | `colors.textMuted` | Axis labels, subtitles, legend. |
|
|
14
|
+
| Hairline/divider | `colors.axis`, `colors.grid` | Axis lines vs split (grid) lines — grid is fainter. |
|
|
15
|
+
| Success / error | `colors.positive`, `colors.negative` | KPI deltas, up/down. |
|
|
16
|
+
|
|
17
|
+
You only need to supply `categorical` + `background`; the rest derive from `text`/`background`
|
|
18
|
+
if omitted. The palette is then **auto-extended and contrast-checked**: brands rarely give 8+
|
|
19
|
+
series colors, so `lib/palette.mjs` rotates hue (golden angle) and nudges lightness to fill in
|
|
20
|
+
distinguishable, legible extras.
|
|
21
|
+
|
|
22
|
+
### Contrast (accessibility)
|
|
23
|
+
|
|
24
|
+
Every series/text color is checked against the background and nudged in lightness until it clears
|
|
25
|
+
a minimum contrast ratio (WCAG-style luminance math). Aim for **≥ 3:1** for large graphical
|
|
26
|
+
elements and **≥ 4.5:1** for small text. On dark brands, push series colors lighter; on light
|
|
27
|
+
brands, darker. The skill does this automatically (`ensureContrast`), but if you hand-pick colors,
|
|
28
|
+
sanity-check them against the background.
|
|
29
|
+
|
|
30
|
+
Reference: <https://www.w3.org/TR/WCAG21/#contrast-minimum>
|
|
31
|
+
|
|
32
|
+
## Typography
|
|
33
|
+
|
|
34
|
+
| Brand guideline element | Token | Notes |
|
|
35
|
+
|---|---|---|
|
|
36
|
+
| Body / UI typeface | `fonts.family` | Axis labels, legend, data labels, KPI labels. |
|
|
37
|
+
| Display / heading typeface | `fonts.titleFamily` | Chart titles, KPI values (falls back to `family`). |
|
|
38
|
+
| Mono typeface (optional) | `fonts.monoFamily` | For code-like figures if you want it. |
|
|
39
|
+
| Base text size | `fonts.baseSize` | px; other sizes scale from it. |
|
|
40
|
+
| Weights | `fonts.weights` | `{ regular, medium, bold }`. |
|
|
41
|
+
| Webfont files | `fonts.faces[]` | `{ family, weight, url, file? }` — `url` (woff2) for SVG, optional local `file` (ttf/otf) for PNG. |
|
|
42
|
+
|
|
43
|
+
Match the brand's actual type scale: a display serif for titles + a clean sans for data reads as
|
|
44
|
+
intentional; one default sans everywhere reads as generic. See `fonts-and-svg-embedding.md` for
|
|
45
|
+
how the fonts actually get into the output.
|
|
46
|
+
|
|
47
|
+
## Shape / tone
|
|
48
|
+
|
|
49
|
+
| Token | Effect |
|
|
50
|
+
|---|---|
|
|
51
|
+
| `shape.barRadius` | Bar corner rounding (0 = sharp/corporate, 6–8 = friendly). |
|
|
52
|
+
| `shape.lineWidth` | Line series thickness. |
|
|
53
|
+
| `shape.symbolSize` | Point/marker size. |
|
|
54
|
+
| `shape.gridline` | `solid` \| `dashed` \| `none` — gridline style (or hide for a minimal look). |
|
|
55
|
+
| `mode` | `light` \| `dark` — sets default neutrals if you don't specify them. |
|
|
56
|
+
|
|
57
|
+
A finance/enterprise brand → sharp bars, solid thin gridlines, restrained palette. A consumer
|
|
58
|
+
brand → rounded bars, dashed/none gridlines, brighter palette.
|