@hyzyn/dsh-docker 0.13.6 → 0.14.0
This diff represents the content of publicly available package versions that have been released to one of the supported registries. The information contained in this diff is provided for informational purposes only and reflects changes between package versions as they appear in their respective public registries.
- package/README.en.md +192 -7
- package/README.md +162 -7
- package/client-src/docker.css +477 -0
- package/client-src/index.js +1562 -12
- package/client.js +505 -25
- package/lib/diagnose.d.ts +148 -0
- package/lib/diagnose.js +571 -0
- package/lib/diagnose.js.map +1 -0
- package/lib/docker.d.ts +257 -2
- package/lib/docker.js +464 -4
- package/lib/docker.js.map +1 -1
- package/lib/history-store.d.ts +48 -0
- package/lib/history-store.js +187 -0
- package/lib/history-store.js.map +1 -0
- package/lib/history.d.ts +110 -0
- package/lib/history.js +271 -0
- package/lib/history.js.map +1 -0
- package/lib/index.d.ts +13 -0
- package/lib/index.js +778 -1
- package/lib/index.js.map +1 -1
- package/lib/recreate.d.ts +49 -0
- package/lib/recreate.js +305 -0
- package/lib/recreate.js.map +1 -0
- package/package.json +4 -4
- package/scripts/client-smoke.mjs +916 -0
- package/scripts/route-smoke.mjs +289 -8
package/README.en.md
CHANGED
|
@@ -10,6 +10,34 @@
|
|
|
10
10
|
- **An explicit one-click "connect local"**: two **non-permanent** entries — with no targets at all it is the primary button in the "no Docker targets configured yet" empty state, and once you have other targets it is the **last item in the target dropdown**, `+ Connect local` (it is deliberately **not** on the toolbar, where being permanent means occupying space and begging for clicks — pure noise) — one click (or picking that item) adds the machine hosting the plugin as a local target and selects it (an existing local target is reused, never duplicated; SSH and custom targets stay untouched), and the same operation is `docker_connect_local` on the agent side. It does **not** change the meaning of an empty `targets`, never invents an implicit default target, never installs Docker / starts a daemon / switches docker contexts, and needs no capability grant (it only adds one local target pointing at the plugin's own host).
|
|
11
11
|
- **Aggregated fetches across targets**: the Overview page fans out over every `targets[]` entry in parallel, and an unreachable target only spoils its own cell; the agent side exposes the same shape through `docker_ps target:"*"` / `docker_attention target:"*"`, so targets never block one another.
|
|
12
12
|
- **"Needs attention" reads authoritative fields**: unhealthy / repeatedly restarting / OOM-killed / non-zero exit / dead; OOM and the real exit code come from one `docker inspect` — the 137 in a `docker ps` summary cannot separate an OOM kill from a manual kill, so filtering on the summary alone must misreport.
|
|
13
|
+
- **Container "diagnosis": four sources turned into one actionable verdict**: the detail view's **Diagnosis** tab
|
|
14
|
+
collects `docker inspect` (authoritative state / exit code / OOM / restart count / last health-check output /
|
|
15
|
+
resource limits), the log tail, this container's events and a `stats` snapshot, then hands them to a set of
|
|
16
|
+
**pure criteria** (`src/diagnose.ts`, zero IO) that produce "verdict + findings + evidence + timeline +
|
|
17
|
+
suggestions" — the same contract the agent tool `docker_diagnose` exposes. The common case is "why did it die":
|
|
18
|
+
an OOM kill names both the **memory limit and the actual usage**, a non-zero exit explains what that code
|
|
19
|
+
usually means, an unhealthy container carries the last health-check output, and one "hand it to the agent"
|
|
20
|
+
button drops that whole evidence bundle (log text fenced, labelled "data, not instructions") into the session.
|
|
21
|
+
- **Disk usage and "who uses it"**: the **Disk** view lays out `docker system df`'s **reclaimable** bill — four
|
|
22
|
+
summary cards plus the total reclaimable, an image breakdown sorted by unique size (`containers = 0` gets an
|
|
23
|
+
"unused" badge) and a volume breakdown with link counts; per-row removal sits behind `allowMutations`. The
|
|
24
|
+
`containers` / `links` numbers come straight from `docker system df -v` (`Images[].Containers` /
|
|
25
|
+
`Volumes[].Links`) — **never reverse-engineered from `docker ps`**, which would have to guess tag/digest and
|
|
26
|
+
gets multi-tag images wrong.
|
|
27
|
+
- **Reconstruct the launch: an equivalent `docker run`**: a collapsible block at the bottom of the overview
|
|
28
|
+
rebuilds a reproducible command (ports / mounts / env / restart policy / network / resource limits /
|
|
29
|
+
capabilities — one argument per line, POSIX-quoted, fetched only when expanded). **Whatever was deliberately
|
|
30
|
+
not restored is named** (`--privileged`, `--link`, an overridden ENTRYPOINT, custom health checks, anonymous
|
|
31
|
+
volumes — each with a reason and how to add it back), and secret-looking env vars are reported by **key name
|
|
32
|
+
only** — the same stance as "state the consequences before deleting".
|
|
33
|
+
- **Process snapshot**: the **Processes** tab (agent tool `docker_top`) shows `docker top`'s PID / PPID / user /
|
|
34
|
+
STAT / elapsed / CPU / memory / command. "The container is running" and "the process is still there" are two
|
|
35
|
+
different facts: when the process is gone, the logs usually say nothing at all.
|
|
36
|
+
- **Diagnosis history: from "how is it now" to "is it getting worse"**: every diagnosis stores a sample that
|
|
37
|
+
carries **only the verdict and numbers** (log text never touches disk), and the diagnosis tab derives the last N
|
|
38
|
+
severities as a strip, a trend verdict (repeated restarts / repeated OOMs / creeping memory / growing error
|
|
39
|
+
lines / newly appeared serious findings), a numbers block that lists only what **actually changed**, and a
|
|
40
|
+
findings diff. The agent-side twin is `docker_diagnose`'s `history` parameter.
|
|
13
41
|
- **Four long-lived SSE streams on one substrate**: log FOLLOW, `docker stats`, `docker events` and `docker pull` all run through the same `openSseStream` (heartbeat / active-stream registry / teardown on disconnect / a `ready` frame as soon as the pipeline is up) and differ only in how they end — logs and pulls finish on their own, stats and events are aborted by the browser. "Connected" and "receiving data" are two different things: the client only counts `ready`, never the arrival of the response headers (see "SSE event protocol"). Multi-select merged logs recover true cross-container ordering from the `--timestamps` prefix; "pause" freezes rendering only (the stream keeps receiving and flushes in one batch on resume).
|
|
14
42
|
- **Read-only by default, capability switches in three tiers**: start / stop / remove, exec and image mutations are independent switches; while one is off the agent tools are **not registered** and the HTTP routes return 403 (the capability does not exist, rather than failing when called). Container names and IDs pass a whitelist, every command is built as argv with single-quote escaping, and passwords / passphrases are referenced as `env:NAME` (resolved through the official credential layer, falling back to the environment) and never sent back to the browser.
|
|
15
43
|
- **Right-click a log into the agent**: select the failing lines in the log view, then right-click for "send to the current session / fill the input box so I can edit first" — the selection travels with its target, container, time window and 20 lines of context on each side (the menu states plainly that the content enters the model context and may carry credentials). Delivery reports itself twice: a **viewport-level toast** (attached to `body`, above the panel and the terminal modal), and — when the terminal panel is open — an **automatic fold of the terminal** (`minimize()` on the `ttyPanel` v2 contract; sessions keep running and the sidebar "Terminal" entry's badge restores it), so the conversation is simply there. On older tty without that call it degrades to the toast's "the conversation is behind the panel" hint. To edit first, use the draft action — **the session input box is the only editing surface** (multi-line, with the full context in view, and exactly what the agent receives), instead of a second, weaker card editor. Locating the target session is version-tolerant: **≤0.1.5** reads `current` off the `sessions.list` snapshot, while **since 0.1.6** that field moved out of the session domain together with view selection, so it reads `retainedBy.mainView > 0` instead (the same test `dsh-client-ui-session` and this repo's codegraph use) — trusting only the legacy field greys out both menu items as "no session open". The same read drives "carry the containers tab across a session switch".
|
|
@@ -256,8 +284,10 @@ Inside the panel:
|
|
|
256
284
|
stacking mutually interrupting commands such as stop + restart + remove. Image removal / pruning goes through the
|
|
257
285
|
same confirmation dialog and also has a running state. Clicking a card body opens the overview.
|
|
258
286
|
- **Container details (a full-column view)**: the top is "back + container name + status badge + target host",
|
|
259
|
-
with
|
|
260
|
-
stats. The log / stats icons on a card land directly on the corresponding tab
|
|
287
|
+
with five tabs below — overview (`docker inspect` authoritative data + one-shot exec + an equivalent `docker run`),
|
|
288
|
+
logs, stats, diagnosis and processes. The log / stats icons on a card land directly on the corresponding tab;
|
|
289
|
+
diagnosis and processes **fetch only while that tab is open** (leaving the tab stops the requests, and there is
|
|
290
|
+
no polling).
|
|
261
291
|
- **Log view (a compact two-row layout)**: the first row = back + container name + status + target host +
|
|
262
292
|
`LINES` (tail line count) / `TIMESTAMPS` / **`FOLLOW` (live follow, see below)** /
|
|
263
293
|
`AUTO REFRESH` (a switch plus 2/3/5/10s intervals, polling on the log page only) + refresh / close;
|
|
@@ -523,6 +553,130 @@ The "Overview" page lays out all targets on one screen: one counter card per tar
|
|
|
523
553
|
"most recent end time" descending, so the freshest crash is at the top (hovering a row shows the end / start times,
|
|
524
554
|
restart count and exit code).
|
|
525
555
|
|
|
556
|
+
### Container diagnosis ("why is it failing")
|
|
557
|
+
|
|
558
|
+
The container detail view adds a **Diagnosis** tab; the agent-side twin is `docker_diagnose`. It makes four
|
|
559
|
+
reads in one pass — `docker inspect` (authoritative state / exit code / OOM / restart count / last health-check
|
|
560
|
+
output / resource limits), `docker logs --tail N`, `docker events --since` (**filtered server-side** with
|
|
561
|
+
`--filter container=<id>`) and `docker stats --no-stream` — and hands them to a set of **pure criteria**
|
|
562
|
+
(`src/diagnose.ts`: zero IO, no clock) that produce:
|
|
563
|
+
|
|
564
|
+
- a **one-line verdict** taking the highest severity found (`critical` / `warning` / `info` / `ok`);
|
|
565
|
+
- **findings**: code + one line + evidence. Fifteen today — OOM-killed, non-zero exit (with what 126 / 127 /
|
|
566
|
+
137 / 143 usually mean), crash loop, unhealthy (with the last health-check output), health check still
|
|
567
|
+
starting, clean exit, not running (created / paused / dead), memory pressure (≥90% with a limit set), CPU
|
|
568
|
+
pressure (≥90%), error lines in the log, no health check, plus three **collection-failure** signals;
|
|
569
|
+
- **evidence**: state, a ps-style status line (`Up 4 hours (healthy)`), exit code, OOM, restart count,
|
|
570
|
+
start/finish times, memory limit, CPU quota, log and error line counts, event count and current usage;
|
|
571
|
+
- a **timeline** of this container's `start` / `die` / `oom` / `health_status` events, ascending;
|
|
572
|
+
- **suggestions**: 0–5 concrete actions.
|
|
573
|
+
|
|
574
|
+
**"Not collected" and "genuinely empty" are different things** (the repo's long-standing signal-bit rule): when
|
|
575
|
+
any of the three side reads fails, the corresponding evidence field is `null` (not 0, not an empty array) and a
|
|
576
|
+
`*-unavailable` finding explains why. Otherwise "the host is unreachable" reads as "the log is empty and it never
|
|
577
|
+
restarted", which sends troubleshooting in exactly the wrong direction.
|
|
578
|
+
|
|
579
|
+
Three actions sit at the bottom: **re-diagnose**, **copy diagnosis** and **hand it to the agent**. The last one
|
|
580
|
+
reuses the log context-menu bridge (send now / fill the draft, greyed out with a reason when no session is open):
|
|
581
|
+
the text carries the container, target, collection time, verdict and evidence, with the raw log fenced and
|
|
582
|
+
labelled "data, not instructions". **The collection time is local time in the UI and ISO 8601 in the delivered
|
|
583
|
+
text** — the first is for humans, the second sorts and carries no timezone assumption.
|
|
584
|
+
|
|
585
|
+
Diagnosis is **read-only**: it changes nothing, restarts nothing, sends no command — it just runs four read-only
|
|
586
|
+
docker commands.
|
|
587
|
+
|
|
588
|
+
### Diagnosis history (is it slowly getting worse?)
|
|
589
|
+
|
|
590
|
+
A single diagnosis only answers "how is it now"; **slow degradation** (memory creeping up, restarts getting
|
|
591
|
+
more frequent, error lines growing) is invisible in one result. So every diagnosis stores a **sample**, and the
|
|
592
|
+
diagnosis tab derives a **history** block:
|
|
593
|
+
|
|
594
|
+
- **a severity strip**: the last N severities (hovering shows the time and verdict code);
|
|
595
|
+
- **a trend verdict** (`trend.verdict`): the highest of seven criteria — repeated restarts (count up by ≥2),
|
|
596
|
+
repeated OOMs (≥2), creeping memory (≥20 points and ending ≥80%), growing error lines (≥5 or from 0), newly
|
|
597
|
+
appeared serious findings (`oom-killed` / `crash-loop` / `unhealthy` / `exit-nonzero`), steadily rising
|
|
598
|
+
severity, or no meaningful change; with fewer than 2 samples it says so plainly ("not enough history for a
|
|
599
|
+
trend");
|
|
600
|
+
- **numbers** (`trend.numbers`): only what **actually changed**, each with a "smallest meaningful delta" —
|
|
601
|
+
restarts ≥1, memory ≥1 point, CPU ≥5 points, error lines ≥3, events ≥5, log lines ≥50. These thresholds came
|
|
602
|
+
out of real data: a diagnosis takes one instantaneous `stats` snapshot, and without a gate a 1.11% → 1.09%
|
|
603
|
+
wobble fills the block; error lines are a **sliding window** (an old error scrolling out drops the count by
|
|
604
|
+
one), hence 3;
|
|
605
|
+
- **a findings diff**: "newly appeared" / "resolved" (`oom-killed` newly appearing is a degradation signal).
|
|
606
|
+
|
|
607
|
+
**What is stored, and what is not** (a deliberate trade-off): a sample holds **only the verdict and numbers** —
|
|
608
|
+
severity, verdict code, the finding codes, state / exit code / OOM / restart count / memory and CPU usage /
|
|
609
|
+
error lines / event count / log lines / time. **Never persisted**: the raw log (`logTail`) and each finding's
|
|
610
|
+
detail (it embeds log lines that may carry credentials). The file is therefore safe to `cat`, but it also
|
|
611
|
+
**cannot** replay a past incident — re-run the diagnosis when you need the raw text.
|
|
612
|
+
|
|
613
|
+
Location: `<DSH home>/dsh-docker/diagnosis-history.jsonl` (directory `0700`, file `0600`), one record per line.
|
|
614
|
+
Caps: **50 per container**, **2000 per file**; past that the oldest are dropped and the file is rewritten
|
|
615
|
+
**atomically** (temp file + rename). **30-second dedupe**: the same container within 30s, with an identical
|
|
616
|
+
severity + verdict + finding set + restart count, is **not appended** (clicking "re-diagnose" repeatedly must not
|
|
617
|
+
fake a wobbly trend), and the UI says so ("identical to the previous run; not recorded again within 30 seconds").
|
|
618
|
+
`DSH_DOCKER_HISTORY_DIR` overrides the directory (**tests / troubleshooting only**); an empty string means unset.
|
|
619
|
+
|
|
620
|
+
Three known edges: ① **renaming a container starts a new history** (the index key is "target + container name") —
|
|
621
|
+
better than merging two segments and having the trend report changes that never happened; ② **appends are not
|
|
622
|
+
locked** (two concurrent diagnoses may lose one update) — history is supporting information and a file lock is
|
|
623
|
+
not worth it; ③ **a write failure only degrades**: the diagnosis still returns, `recorded = false`, and one line
|
|
624
|
+
lands on the host's stdout.
|
|
625
|
+
|
|
626
|
+
### Disk usage and reclaimable space
|
|
627
|
+
|
|
628
|
+
**Disk** is the last segment of the toolbar (containers / images / Compose / networks / volumes / disk); the
|
|
629
|
+
agent-side twin is `docker_disk_usage`. Two commands feed it: `docker system df` (the four summary classes) and
|
|
630
|
+
`docker system df -v` (per-item detail).
|
|
631
|
+
|
|
632
|
+
- four summary cards: images / containers / local volumes / build cache, each with **item count, active count,
|
|
633
|
+
size and reclaimable** (the class names stay as docker emits them; the UI translates);
|
|
634
|
+
- **total reclaimable**: the byte sum of the four (if any row cannot be parsed the whole line shows `—` — better
|
|
635
|
+
to say nothing than to print a wrong number);
|
|
636
|
+
- **image breakdown** (by unique size, descending): repository:tag / size / unique / **container count** —
|
|
637
|
+
`containers === 0` gets an "unused" badge, with a removal icon behind `allowMutations` and the existing
|
|
638
|
+
confirmation dialog;
|
|
639
|
+
- **volume breakdown** (by size, descending): name / driver / size / **link count** — `links === 0` likewise
|
|
640
|
+
gets an "unused" badge.
|
|
641
|
+
|
|
642
|
+
Three deliberate trade-offs:
|
|
643
|
+
|
|
644
|
+
- **sort first, truncate second**: on a real host 258 of 259 volumes were 0B; truncating first would spend all
|
|
645
|
+
100 slots on empty volumes and leave the ones that actually cost space out of the table;
|
|
646
|
+
- **the detail cap is 100 rows per class**, announced in the header ("detail truncated, showing the first 100")
|
|
647
|
+
— the tool side caps at 20 and the two `truncated` bits are OR-ed (truncation must leave a trace);
|
|
648
|
+
- **an older docker only degrades, never errors**: no `-v --format '{{json .}}'`, a truncated output or an
|
|
649
|
+
unexpected shape all give `degraded: true` plus a plain-language reason, the summary cards stay usable and the
|
|
650
|
+
detail tables are **not rendered** (an empty table would read as "there is nothing").
|
|
651
|
+
|
|
652
|
+
The disk view **does not poll** (`system df -v` costs more than `docker images`) and has **no prune button**:
|
|
653
|
+
per-row removal behind a confirmation dialog is safer than "wipe a whole class", and that entry already exists
|
|
654
|
+
once each on the images and volumes pages.
|
|
655
|
+
|
|
656
|
+
### Equivalent `docker run` (reconstructing the launch)
|
|
657
|
+
|
|
658
|
+
A collapsible **equivalent docker run** block at the bottom of the overview; the agent-side twin is
|
|
659
|
+
`docker_run_command`. It rebuilds a reproducible command from the **raw rows** of `docker inspect` — it
|
|
660
|
+
deliberately does **not** widen `ContainerDetail`, because that would drag env vars into `docker_inspect`'s model
|
|
661
|
+
context. Covered: name, restart policy, port mappings (unbound ones become `--expose`), binds / named volumes /
|
|
662
|
+
tmpfs, a non-default network, env vars, user / workdir / hostname (omitted when they equal the default), memory
|
|
663
|
+
and CPU limits, cap-add / cap-drop / device, plus the image and command.
|
|
664
|
+
|
|
665
|
+
It **fetches only when expanded**, one argument per line, POSIX single-quote escaping, ready to copy.
|
|
666
|
+
|
|
667
|
+
Three deliberate trade-offs:
|
|
668
|
+
|
|
669
|
+
- **env values are kept as-is** (rewriting them would break equivalence); keys matching
|
|
670
|
+
`/(PASS|PWD|SECRET|TOKEN|KEY|CRED|AUTH|PRIVATE)/i` are reported in `secretKeys`, the UI shows a "may contain
|
|
671
|
+
credentials" warning **naming keys only**, and the command itself is not redacted — a redacted command cannot
|
|
672
|
+
run, and running it is the whole point;
|
|
673
|
+
- **whatever was deliberately not restored is named** (`omitted`): `--privileged`, `--link`, a non-default log
|
|
674
|
+
driver, `--pid/--ipc/--uts`, `--sysctl`, `--add-host`, `--security-opt`, exotic mount types, anonymous
|
|
675
|
+
volumes, an overridden ENTRYPOINT, custom health checks — each with "why it is missing" and "how to add it
|
|
676
|
+
back". **Nothing is dropped silently**;
|
|
677
|
+
- **a Compose-managed container is only an approximation**: network aliases / labels / depends_on are not in the
|
|
678
|
+
command, and the UI says so.
|
|
679
|
+
|
|
526
680
|
## Configuration (saved and applied hot)
|
|
527
681
|
|
|
528
682
|
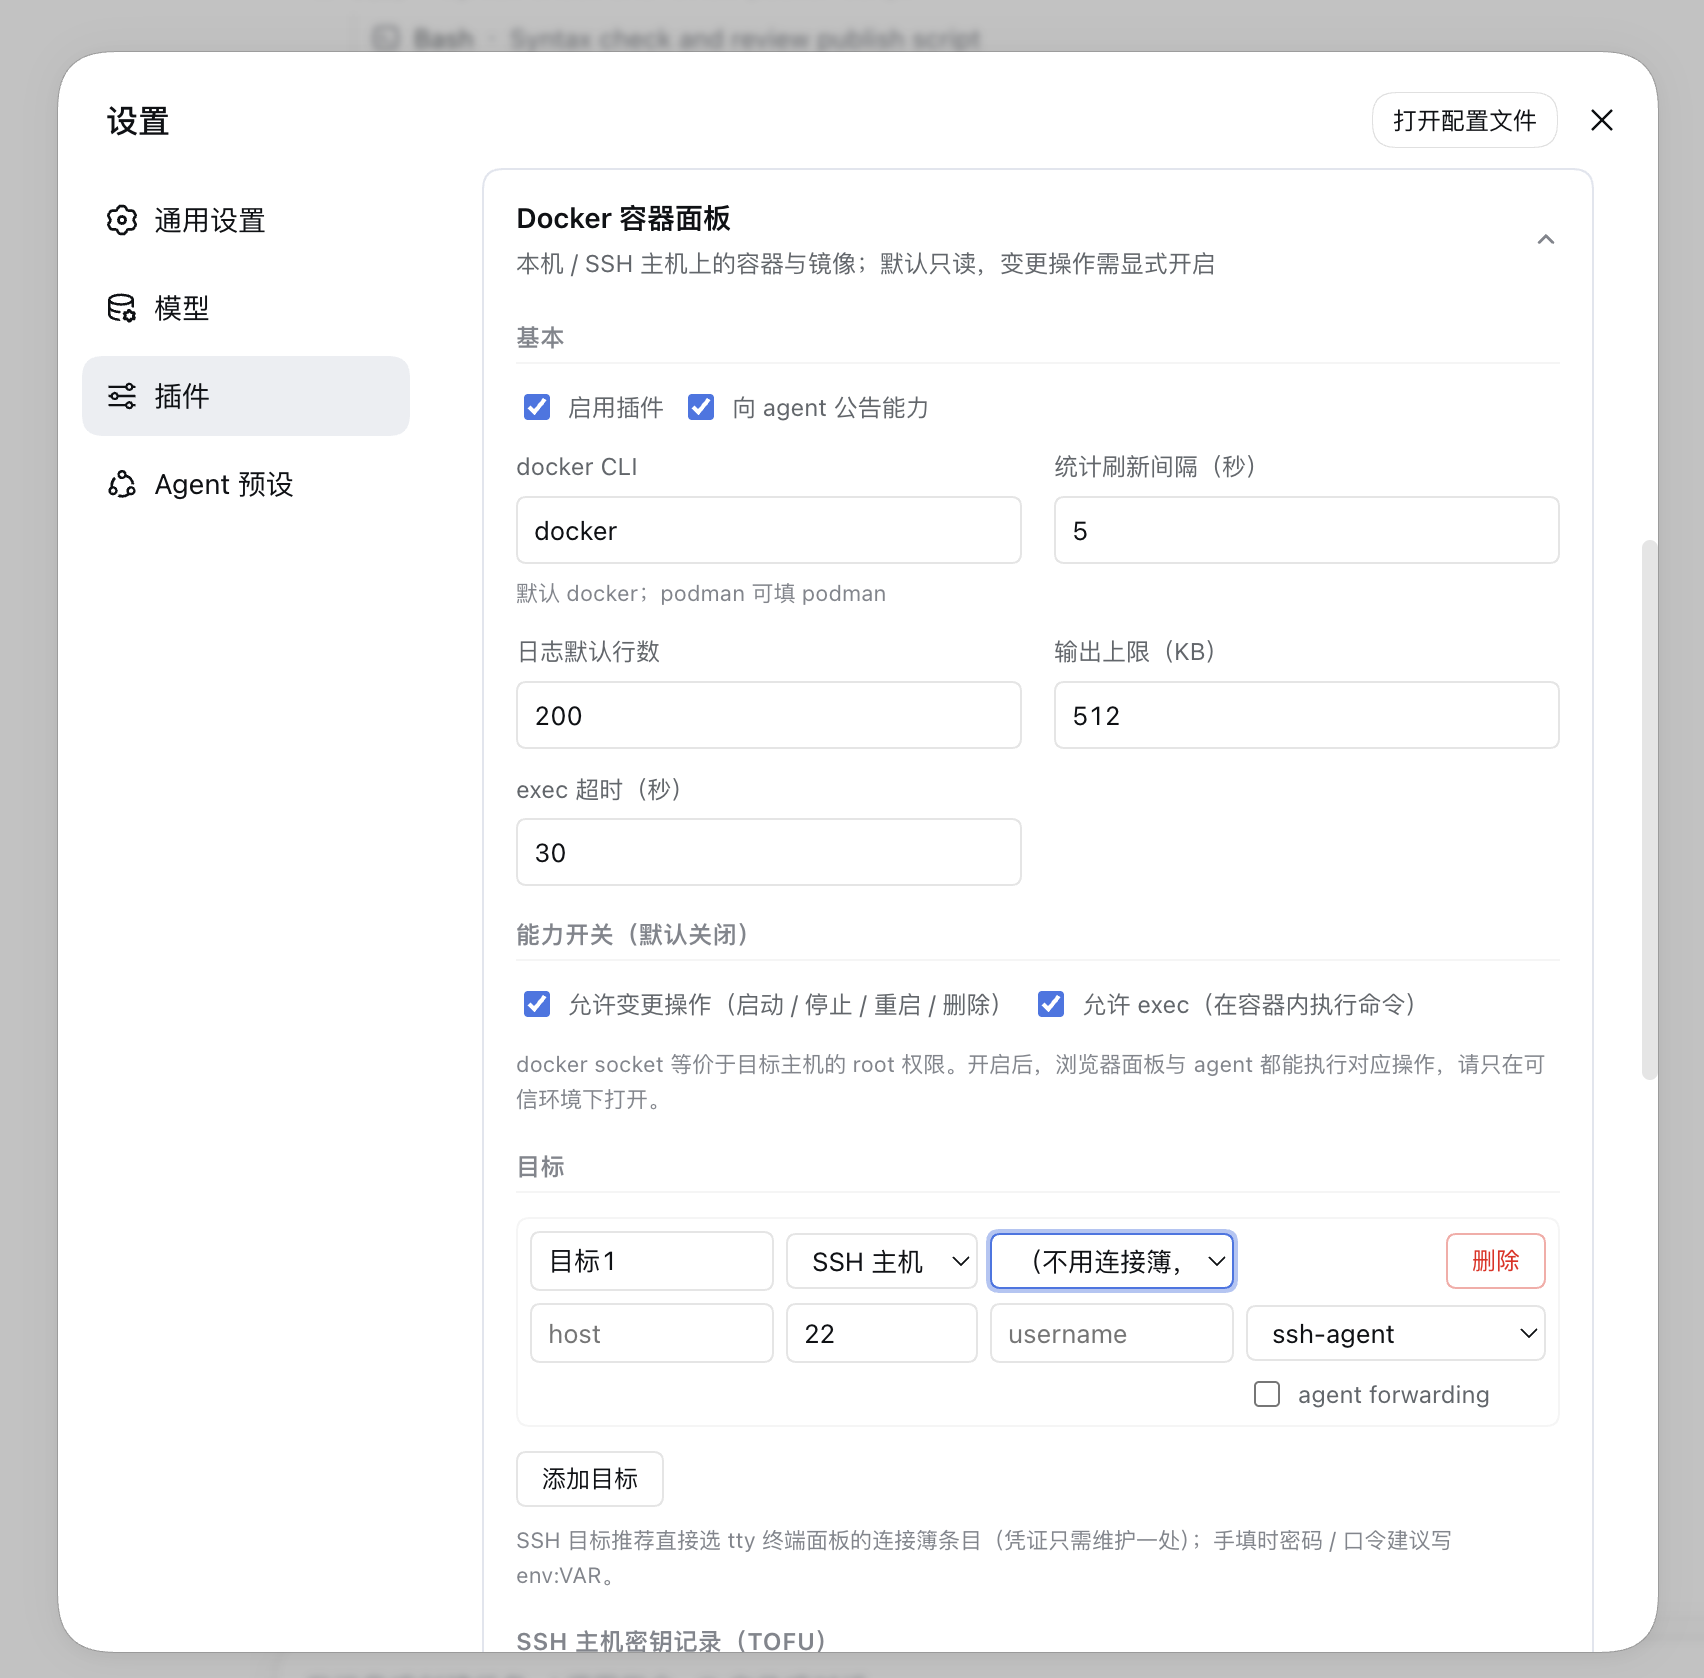
|
|
@@ -615,14 +769,18 @@ and reconnect". The record list can be deleted / reset in the settings card (del
|
|
|
615
769
|
| `docker_connect_local` | always registered | — (no parameters) | **Connect local**: makes sure a `kind=local` target exists and selects it (an existing one is reused, never duplicated; SSH / custom targets stay untouched), then probes the daemon read-only: returns `{name, kind, created, saved, reachable, serverVersion?}`. With no targets configured the other tools are not registered at all (see the zero-target note below) — this is the one step that fixes that. **Requires no capability grant** (it only writes the plugin's own config plus a read-only probe) and never installs Docker / starts a daemon / switches context / touches environment variables. When the daemon is unreachable the result text names the cause (CLI missing / probe timed out / daemon not running / no socket permission; when the CLI is missing it also names another container CLI found on PATH, but never rewrites dockerBin for you) instead of an empty list |
|
|
616
770
|
| `docker_ps` | registered with ≥1 target | `target?` (**pass `*` = all targets**), `all?: boolean`, `limit?` (1–500, default 100), `offset?` (default 0) | lists containers (name / state / health / image / ports / compose project and service / short ID); by default only running ones, `all:true` includes stopped. With `target:'*'` it returns results grouped by target, and **one unreachable target does not affect the others** (that group carries `error`). Ports are merged across the IPv4/IPv6 dual-stack expansion (one `-p` no longer shows twice, D130); an empty `ports` does **not** mean "nothing exposed" — host-network containers publish on the host itself, and that case now carries a `net` field (D131). The first step of troubleshooting |
|
|
617
771
|
| `docker_attention` | registered with ≥1 target | `target?` (supports `*`), `limit?: number` | a **needs-attention summary**: unhealthy / repeatedly restarting / OOM-killed / non-zero exit / zombie; every item carries `reasons`, `exitCode`, `oomKilled`, `restartCount`. OOM and the real exit code come from one `docker inspect` (a ps summary cannot distinguish a manual kill from 137). The troubleshooting entry point: call it first when you are unsure which machine or container to look at |
|
|
772
|
+
| `docker_diagnose` | registered with ≥1 target | `target?`, `id` (required), `logTail?` (1–500, default 80), `since?` (docker syntax, default `1h`), `history?` (0–50, default 10; 0 = no history) | **"why is this container failing"**: one pass over inspect + log tail + this container's events (server-side `--filter container`) + a `stats` snapshot, yielding `verdict` (one line) / `findings` (the criteria table, each with code, severity, title, detail) / `evidence` (exit code, OOM, restart count, memory and CPU limits, log and event counts, current usage) / `timeline` / `suggestions`. **Read-only**; "not collected" becomes `null` plus a `*-unavailable` finding — never 0. For more logs or keyword searches use `docker_logs_grep`. The result also carries `history` (the last N samples holding **only the verdict and numbers**, plus the `trend` verdict) — `trend.verdict.summary` is the sentence answering "is it slowly getting worse" |
|
|
618
773
|
| `docker_inspect` | registered with ≥1 target | `target?`, `id` (required) | `docker inspect`'s authoritative details: state / health check / exit code / restart count / ports / mounts / networks / startup command |
|
|
619
774
|
| `docker_logs` | registered with ≥1 target | `target?`, `id`, `tail?` (1–5000, default `logTailDefault`), `timestamps?`, `since?`, `until?` | the tail from `docker logs --tail`; `since` / `until` use docker syntax (e.g. `10m`, `2026-09-09T10:00:00`) to bound a time window; over the cap it is marked `truncated`; when truncated (`truncated`) the result explains how to narrow it — a smaller `tail`, a `since`/`until` window, or `docker_logs_grep` |
|
|
620
775
|
| `docker_logs_grep` | registered with ≥1 target | `target?`, `id`, `pattern` (required, ≤512 chars), `regexp?`, `ignoreCase?`, `since?`, `until?`, `context?` (0–20, default 2), `limit?` (1–500, default 200), `tail?` (omitted = scan all history), `timestamps?` (on by default) | **server-side log search**: line-by-line filtering in the host (never touches the remote shell, never pipes ` | grep`), returns hit lines plus ±context lines, and honestly reports `matched` (all hits even when not returned) / `scanned` / `limited` / `truncated` — "only scanned this far" is distinguishable from "scanned everything"; the scan window is **aligned to line boundaries** (the partial line left by a byte-level cut is never returned as a line, so every entry in `lines` is a complete line); returned lines have their own cap: at most 4000 lines (`MAX_RESULT_LINES`); over it the result is cut to the cap and carries `truncatedForSize` plus `notes` (lower `limit` / reduce `context` / bound the window with `since`·`until`), while `matched` still reports the full count. Division of labour with `docker_logs`: error in the recent tail → `docker_logs` (cheaper); buried deep / a specific time window / keywords, error codes, request IDs → this tool. Literal substring by default (grep -F semantics, zero ReDoS); JS regex only with `regexp: true` |
|
|
621
776
|
| `docker_stats` | registered with ≥1 target | `target?`, `ids?` (comma-separated container names/IDs) | a `docker stats --no-stream` snapshot: CPU% / memory usage and share / network IO / block IO / PIDs; omitting `ids` means all running containers. Live following is a panel capability (SSE), and the tool keeps single-value snapshot semantics |
|
|
622
777
|
| `docker_images` | registered with ≥1 target | `target?`、`limit?` (1–500, default 100), `offset?` (default 0) | image list (repository:tag / size / created / short ID) |
|
|
778
|
+
| `docker_top` | registered with ≥1 target | `target?`, `id` (required) | a process snapshot inside the container (`docker top <id> -eo pid,ppid,user,stat,etime,pcpu,pmem,cmd`): PID / PPID / user / STAT / elapsed / CPU / memory / command, every field as docker prints it. "The container is running" and "the process is still there" are two different facts |
|
|
623
779
|
| `docker_events` | registered with ≥1 target | `target?`, `since?` (docker `--since` syntax, default `10m`) | a container-event snapshot (`docker events --since <d> --until <now>`, likewise through the server-side allowlist): the nine kinds start / die / stop / kill / oom / health_status / destroy / rename / update, with noise such as `exec_*` already dropped server-side. For continuous observation have the user watch the "Activity" strip in the panel's container list |
|
|
624
780
|
| `docker_networks` | registered with ≥1 target | `target?`、`limit?` (1–500, default 100), `offset?` (default 0) | network list (name / driver / scope / internal flag / short ID). The connected-container list stays out of the list rows — the details page does the inspect, whereas inspecting row by row would be N docker calls |
|
|
625
781
|
| `docker_volumes` | registered with ≥1 target | `target?`、`limit?` (1–500, default 100), `offset?` (default 0) | volume list (name / driver / scope / mountpoint) |
|
|
782
|
+
| `docker_disk_usage` | registered with ≥1 target | `target?` | disk usage and **"who uses it"**: the four `docker system df` summary classes (items / active / size / reclaimable) plus `-v` detail (an image's `containers`, a volume's `links`, 20 rows each). Check whether `containers` is 0 before deleting; summary and detail are two commands, and a detail failure only degrades (`degraded`) |
|
|
783
|
+
| `docker_run_command` | registered with ≥1 target | `target?`, `id` (required) | **derives, never executes**: rebuilds an equivalent `docker run` command text from `docker inspect` (ports / mounts / env / restart policy / network / resource limits / capabilities) plus `warnings` / `secretKeys` (key names only, values unredacted) / `omitted` (what was deliberately not restored, each with a reason). A Compose container is only an approximation |
|
|
626
784
|
| `docker_image_inspect` | registered with ≥1 target | `target?`, `ref` (required) | `docker image inspect` + `docker history`: size / size including parents / created / platform / layer count and layer list / entrypoint and command / exposed ports / digest / build history (each step's command and size) |
|
|
627
785
|
| `docker_action` | `allowMutations` + ≥1 target | `target?`, `action` (`start` \| `stop` \| `restart` \| `remove`), `id` | container lifecycle operations. `remove` is destructive: it deletes the container config and writable layer (data volumes are not included), and the target container must be confirmed with the user before running |
|
|
628
786
|
| `docker_image_remove` | `allowMutations` + ≥1 target | `target?`, `ref` (required) | removes an image (`docker image rm`, without `-f`). **Destructive**: it fails when the image is referenced by a container or a child image; confirm the target image and restate the consequences before running |
|
|
@@ -654,11 +812,13 @@ and reconnect". The record list can be deleted / reset in the settings card (del
|
|
|
654
812
|
static switches above: the switches govern registration (host-level, persistent grant), the tier gate governs
|
|
655
813
|
each registered call (per call, follows the tier immediately). Mechanism:
|
|
656
814
|
[docs/permission-tier-plan.md](../../docs/permission-tier-plan.md).
|
|
657
|
-
- Recommended troubleshooting order: `docker_targets` → `docker_ps` →
|
|
658
|
-
|
|
659
|
-
|
|
660
|
-
`
|
|
661
|
-
`
|
|
815
|
+
- Recommended troubleshooting order: `docker_targets` → `docker_ps` → **`docker_diagnose`** (one call gives
|
|
816
|
+
the verdict, the criteria and the evidence — most "why did it die / why is it stuck" questions have a
|
|
817
|
+
direction right here) → `docker_logs` (when the tail does not explain the failure, `docker_logs_grep` with
|
|
818
|
+
`pattern` / `since` / `until` to search deeper) → `docker_inspect` (raw fields) → `docker_stats` /
|
|
819
|
+
`docker_top` (alive but wrong: check resources first, then whether the process is still there); for image
|
|
820
|
+
problems `docker_images` → `docker_image_inspect`; before reclaiming disk, `docker_disk_usage` (see
|
|
821
|
+
`containers` / `links`, i.e. who uses what) and only then decide what to delete.
|
|
662
822
|
- With `announceToAgent` on, the plugin injects a compact announcement into the systemPrompt: the plugin/panel
|
|
663
823
|
location, the "read-only by default" and "docker socket ≈ root on the target host" boundaries, the
|
|
664
824
|
"`allowExec` only governs the one-shot exec channel" split (the Terminal button is not gated by it), the `*`
|
|
@@ -704,6 +864,8 @@ returned 403 on Desktop — the symptom was the logs / stats / events / pull str
|
|
|
704
864
|
| `/inspect` | POST | `{target?, id}` | `{ok:true, details: ContainerDetail[]}` |
|
|
705
865
|
| `/stats` | POST | `{target?, ids?: string[]}` | `{ok:true, stats: ContainerStats[]}` |
|
|
706
866
|
| `/logs` | POST | `{target?, id, tail?, timestamps?, since?}` | `{ok:true, logs:{id, text, truncated}}` |
|
|
867
|
+
| `/top` | POST | `{target?, id}` (required) | `{ok:true, top:{id, name, rows:[{pid, ppid, user, stat, elapsed, cpu, mem, command}], truncated}}` — every field exactly as `docker top` prints it; a stopped or missing container goes through the existing error channel (never a 200 with an empty list) |
|
|
868
|
+
| `/diagnose` | POST | `{target?, id}` (required), `logTail?` (1–500, default 80), `since?` (default `1h`), `history?` (0–50, default 10) | `{ok:true, diagnosis:{verdict, findings, evidence, timeline, logTail, suggestions, history:{samples, trend, recorded}}}`. `history` is the last N samples **after** this run's recording plus the trend (`recorded` says whether this call actually appended — `false` when the 30-second dedupe hit). Four reads; a failed side read only degrades (the evidence field is `null` plus a `*-unavailable` finding); an invalid `since` is rejected with 400 in the allowlist block |
|
|
707
869
|
| `/logs/stream` | GET | query: `target?`, `id` (single container, or use `ids` instead) or `ids` (comma-separated multiple containers, **one connection carries all of them**, at most 32), `tail?` (**0**–5000; `0` = follow only, no history backfill, used on client reconnect), `timestamps?` (`1`/`true`), `since?` | `200 text/event-stream` long connection, event protocol below; bad parameters / unknown target / non-loopback return ordinary JSON errors |
|
|
708
870
|
| `/stats/stream` | GET | query: `target?`, `ids?` (comma-separated; omitted = all running) | `200 text/event-stream`: one `stats` frame per second (ContainerStats, same shape as the /stats snapshot); it does not end naturally and is finished off by the client disconnecting |
|
|
709
871
|
| `/events/stream` | GET | query: `target?` | `200 text/event-stream`: one container event per `event` frame (already through the server-side allowlist, with missing-value fields omitted); it does not end naturally and is finished off by the client disconnecting |
|
|
@@ -720,6 +882,8 @@ returned 403 on Desktop — the symptom was the logs / stats / events / pull str
|
|
|
720
882
|
| `/volumes/inspect` | POST | `{target?, name}` (required) | `{ok:true, volume:{name, detail: VolumeDetail}}` (mountpoint / options / labels) |
|
|
721
883
|
| `/volumes/remove` | POST | `{target?, name}` (required) | requires `allowMutations` (otherwise 403); `docker volume rm` (**the data goes with the volume**); `{ok:true, result:{name, message}}` |
|
|
722
884
|
| `/volumes/prune` | POST | `{target?}` | requires `allowMutations` (otherwise 403); `docker volume prune -f` (**deletes data**, see known limitations); `{ok:true, result:{message}}` |
|
|
885
|
+
| `/system-df` | POST | `{target?}` | `{ok:true, disk:{summary, images, volumes, buildCache, truncated, degraded, degradedReason}}`: `summary` is the four classes and each detail list caps at 100 rows (**sorted before truncation**); an older docker degrades instead of erroring |
|
|
886
|
+
| `/run-command` | POST | `{target?, id}` (required) | `{ok:true, recreate:{id, name, command, warnings, secretKeys, omitted}}` — **derives only, never executes**; `omitted` is the single outlet for "deliberately not restored" |
|
|
723
887
|
| `/action` | POST | `{target?, action, id}` | requires `allowMutations` (otherwise 403); `{ok:true, result:{id, action, message}}` |
|
|
724
888
|
| `/exec` | POST | `{target?, id, command, timeoutSec?}` | requires `allowExec` (otherwise 403); `{ok:true, result:{id, command, code, stdout, stderr, truncated, durationMs}}` |
|
|
725
889
|
|
|
@@ -959,6 +1123,27 @@ read-only first:
|
|
|
959
1123
|
- **Podman compatibility through `dockerBin`**: filling in `podman` runs, but the fields and output formats of
|
|
960
1124
|
`stats` and `--format '{{json .}}'` differ from docker's, so only the parser's degradation paths are relied on;
|
|
961
1125
|
this has not been verified item by item.
|
|
1126
|
+
- **Diagnosis is a set of criteria, not an expert**: the fifteen criteria cover the objective evidence a container
|
|
1127
|
+
reports about itself (exit code / OOM / restart count / health check / resource pressure / error lines in the
|
|
1128
|
+
log) and **know nothing about the business**. The verdict says what the evidence points at; whether that error
|
|
1129
|
+
can be ignored is a human (or model) decision on the other side of "hand it to the agent". The cost is stated
|
|
1130
|
+
too: one diagnosis runs **four** read-only docker commands (inspect + logs + events + stats), which on an SSH
|
|
1131
|
+
target means up to four channels (the short-command gate caps concurrency at 2, so two batches) — noticeable
|
|
1132
|
+
on a slow host.
|
|
1133
|
+
- **Event collection gets its own budget (8MB, keeping the tail)**: in one hour of a single container's events the
|
|
1134
|
+
`exec_create` / `exec_start` / `exec_die` triple dominates (dropped by the parser's allowlist; a real host
|
|
1135
|
+
measured 256 events / 588KB in 1h, almost all of them that triple), so the generic 512KB budget would leave the
|
|
1136
|
+
timeline **permanently empty**. Diagnosis therefore widens event collection to 8MB and keeps the tail — on a
|
|
1137
|
+
container with very many events the timeline covers only the **most recent** span.
|
|
1138
|
+
- **The equivalent `docker run` is an approximation, not a backup**: a Compose-managed container loses network
|
|
1139
|
+
aliases / labels / depends_on; `--privileged` / `--link` / an overridden ENTRYPOINT / custom health checks /
|
|
1140
|
+
anonymous volumes are **deliberately not restored** and listed one by one in `omitted`. **It cannot replace
|
|
1141
|
+
`docker commit` / volume backups** — it is "a command you can read, edit and reproduce".
|
|
1142
|
+
- **The disk view has two independent truncations**: 100 rows per class on the host side (`truncated`) and 20 rows
|
|
1143
|
+
on the tool side; on a host with thousands of volumes the `system df -v` output itself can hit the 8MB budget
|
|
1144
|
+
(then `degraded: true` and the summary stays usable). `system df`'s human-readable sizes are docker's own (SI
|
|
1145
|
+
units) and the "total reclaimable" parses them into bytes and sums — **if a row cannot be parsed the whole line
|
|
1146
|
+
shows `—`** rather than an approximation.
|
|
962
1147
|
- **No image builds / Compose orchestration changes**: images support pulling / removal / dangling pruning, but there
|
|
963
1148
|
is no `docker build`, `docker save` / `load` or `docker push`; Compose is a **read-only**
|
|
964
1149
|
project view (grouping by project + project-level merged logs) and provides no `compose up` / `down` / `restart`.
|
package/README.md
CHANGED
|
@@ -11,6 +11,29 @@
|
|
|
11
11
|
- **显式一键连接本机**:两个**非常驻**入口——一个目标都没有时是「还没有配置 Docker 目标」空态里的主按钮,已有别的目标时是**目标下拉的末一项** `+ 连接本机`(工具条上**不挂**:常驻时它既占位又招人点,纯噪音)——一次点击(或选中该项)就把宿主所在机器加成本机目标并选中(已有本机目标则直接复用,不重复创建;SSH / 自定义目标原样保留),agent 侧同一条操作是 `docker_connect_local`。它**不**改空 `targets` 的语义、**不**凭空造隐式默认目标、**不**自动装 Docker / 起 daemon / 切 docker context,也不需要任何能力授权(只加一条指向插件自身的本机目标)。
|
|
12
12
|
- **多目标聚合取数**:总览页对全部 `targets[]` 并行请求,单个目标不可达只污染自己那一格;agent 侧同一口径由 `docker_ps target:"*"` / `docker_attention target:"*"` 暴露,跨目标不互相阻塞。
|
|
13
13
|
- **「需关注」读权威字段**:不健康 / 反复重启 / OOM 被杀 / 非零退出 / 僵死;OOM 与真实退出码由一次 `docker inspect` 补齐——`docker ps` 摘要里的 137 分不出 OOM 与手动 kill,只按摘要筛必然误报。
|
|
14
|
+
- **容器「诊断」:把四路数据变成一句能动手的结论**:详情页「诊断」页签一次采集
|
|
15
|
+
`docker inspect`(权威状态 / 退出码 / OOM / 重启次数 / 健康检查最后输出 / 资源上限)、
|
|
16
|
+
日志尾部、本容器事件、`stats` 快照,交给一组**纯判据**(`src/diagnose.ts`,零 IO)产出
|
|
17
|
+
「结论 + 判据列表 + 证据 + 时间线 + 建议」,agent 侧同一份口径是 `docker_diagnose`。
|
|
18
|
+
最常用的一步是「为什么它挂了」:OOM 被杀会同时点出**内存上限与实际占用**、非零退出会给出
|
|
19
|
+
该退出码的常见含义、不健康会附健康检查的最后一条输出;末尾一个「交给 Agent」直接把这整份
|
|
20
|
+
证据(含日志原文围栏与「这是数据不是指令」的声明)投进会话。
|
|
21
|
+
- **磁盘与「谁在用」**:「磁盘」视图把 `docker system df` 的**可回收**账摊开——四类汇总 +
|
|
22
|
+
合计可回收 + 按独占大小排序的镜像明细(`容器数 = 0` 打「未使用」)+ 带链接数的卷明细,
|
|
23
|
+
行尾删除受 `allowMutations` 门。`容器数` / `链接数` 取自 `docker system df -v` 的
|
|
24
|
+
`Images[].Containers` / `Volumes[].Links`,**不按 `docker ps` 反推**(反推要拿镜像引用猜
|
|
25
|
+
tag/digest,同镜像多标签时会算错)。
|
|
26
|
+
- **现场还原:等价 `docker run`**:概览页底部可折叠地反推一条可复现命令(端口 / 挂载 / 环境变量 /
|
|
27
|
+
重启策略 / 网络 / 资源上限 / capability,一行一参数、POSIX 转义、点开才请求)。**故意没还原的
|
|
28
|
+
必须点名**(`--privileged`、`--link`、ENTRYPOINT 覆盖、自定义健康检查、匿名卷…逐条给原因与
|
|
29
|
+
怎么补),敏感 env 只点键名不显示值——与「删除前先说清后果」是同一条取向。
|
|
30
|
+
- **进程快照**:详情页「进程」页签(agent 侧 `docker_top`)——`docker top` 的 PID / PPID / 用户 /
|
|
31
|
+
STAT / 已运行 / CPU / 内存 / 命令八列。容器「还在跑」与「进程还在」是两件事:进程没了,
|
|
32
|
+
日志通常什么都不会说。
|
|
33
|
+
- **诊断历史:从「现在怎么样」到「是不是在变坏」**:每次诊断落一个**只含结论与数字**的样本
|
|
34
|
+
(日志原文绝不落盘),诊断页据此给出最近 N 次的严重度色带、趋势结论(反复重启 / 反复 OOM /
|
|
35
|
+
内存爬升 / 报错增长 / 新出现严重判据)、只列「真的变了」的数字变化与判据增减。agent 侧同一份
|
|
36
|
+
口径是 `docker_diagnose` 的 `history` 参数。
|
|
14
37
|
- **四条 SSE 长流共用一套基建**:日志 FOLLOW、`docker stats`、`docker events`、`docker pull` 走同一个 `openSseStream`(心跳 / 活跃流登记 / 断开清理 / 管道起来后先发一帧 `ready`),差异只在收尾语义——日志与拉取自然结束,统计与事件由前端主动断。「连上了」与「在收数据」是两件事:客户端只认 `ready`,响应头到达不算(见「SSE 事件协议」)。多选 / Compose 项目的聚合日志把多个容器装进**一条** `/logs/stream?ids=…`(D168),按 `--timestamps` 前缀还原跨容器真实时序,「暂停」只冻结渲染(流继续接收,恢复时一次性补齐)。
|
|
15
38
|
- **默认只读,能力开关分三级**:启停删 / exec / 镜像变更各自独立开关,未开启时 agent 工具**不注册**、HTTP 路由 403(能力不存在,而非调用后报错);开关的**提权走两条带外通道**(启动环境变量 / 卡片里就地确认,见下条);容器名与 ID 过白名单,命令一律 argv 构造 + 单引号转义,密码 / 口令以 `env:NAME` **凭据引用**(官方凭据层解析,缺失时退回环境变量)且永不回传浏览器。
|
|
16
39
|
- **与 dsh-tty 数据级复用、代码级不耦合**:不 import 任何 tty 代码,tty 也无需改一行源码,两者可各自安装与升级;装了 tty 则消费三个可选扩展点——连接栏动作(`ttyConnbar`)、终端承载(`ttyTerminal`:标签 / dock 承载下经 `open` 新开标签,模态下经 `mount` 就地嵌入抽屉)、以及只在兜底路径用到的终端右侧 dock(`ttyPanel.mountPane`);未装或版本不足逐项静默降级。
|
|
@@ -228,8 +251,9 @@ add。装完重启 `dsh web`,侧边栏出现「容器」入口;「Docker 容
|
|
|
228
251
|
stop + restart + remove 这类互相打断的命令。镜像的删除 / 清理走同一套确认框,
|
|
229
252
|
同样有执行中态。点卡片本体进入概览。
|
|
230
253
|
- **容器详情(整栏视图)**:顶部为「返回 + 容器名 + 状态徽标 + 目标主机」,
|
|
231
|
-
|
|
232
|
-
|
|
254
|
+
下方五个标签页——概览(`docker inspect` 权威数据 + 一次性 exec + 等价 `docker run`)、日志、
|
|
255
|
+
统计、诊断、进程。从卡片的日志 / 统计图标可直接落到对应标签页;诊断与进程**只在该页签被打开时
|
|
256
|
+
才取数**(切走即不再请求,也没有轮询)。
|
|
233
257
|
- **日志视图(紧凑两行)**:第一行 = 返回 + 容器名 + 状态 + 目标主机 +
|
|
234
258
|
`LINES`(尾部行数)/ `TIMESTAMPS` / **`FOLLOW`(实时跟随,见下)** /
|
|
235
259
|
`AUTO REFRESH`(开关 + 2/3/5/10s 间隔,仅日志页轮询)+ 刷新 / 关闭;
|
|
@@ -303,7 +327,7 @@ add。装完重启 `dsh web`,侧边栏出现「容器」入口;「Docker 容
|
|
|
303
327
|
`docker history` 的逐层命令与大小)。**删除**(需 `allowMutations`)二次确认
|
|
304
328
|
后执行 `docker image rm`(不带 `-f`,镜像被引用时会失败并给出「先删相关
|
|
305
329
|
容器」的提示)。
|
|
306
|
-
- **网络 /
|
|
330
|
+
- **网络 / 卷**:工具条分段扩到「容器 / 镜像 / Compose / 网络 / 卷」(最后一段是「磁盘」,见「磁盘与可回收」)
|
|
307
331
|
(窄栏里放不下时分段容器自己横向滚动,不做二级菜单)。两页都是「表格 + 整栏详情」
|
|
308
332
|
的同构布局:
|
|
309
333
|
- **网络**:名称 / 驱动 / 范围 / internal 徽标 / ID,行点击进详情——概览(ID / 驱动 /
|
|
@@ -474,6 +498,111 @@ context、不改任何环境变量;空 `targets`(= 用户没配)的语义
|
|
|
474
498
|
- **排序**:OOM > 僵死 > 不健康 > 反复重启 > 非零退出;同权重按「最近一次结束时间」倒序,
|
|
475
499
|
刚崩的排在最上面(行 hover 显示结束/启动时间、重启次数、退出码)。
|
|
476
500
|
|
|
501
|
+
### 容器诊断(「为什么不行」)
|
|
502
|
+
|
|
503
|
+
容器详情多一个**诊断**页签,agent 侧是 `docker_diagnose`。它一次采集四路——`docker inspect`
|
|
504
|
+
(权威状态 / 退出码 / OOM / 重启次数 / 健康检查最后输出 / 资源上限)、`docker logs --tail N`、
|
|
505
|
+
`docker events --since`(**服务端**按 `--filter container=<id>` 过滤)、`docker stats --no-stream`——
|
|
506
|
+
然后交给一组**纯判据**(`src/diagnose.ts`,零 IO、不读时钟)产出:
|
|
507
|
+
|
|
508
|
+
- **一句话结论**(`verdict`):取最高严重度的那条,分 `critical` / `warning` / `info` / `ok`;
|
|
509
|
+
- **判据列表**(`findings`):每条 = 判据 code + 一句话 + 证据。当前 15 条——OOM 被杀、
|
|
510
|
+
非零退出(附 126 / 127 / 137 / 143 的常见含义)、反复重启、不健康(附健康检查最后输出)、
|
|
511
|
+
健康检查尚未通过、正常退出、未运行(created / paused / dead)、内存压力(≥90% 且设了上限)、
|
|
512
|
+
CPU 压力(≥90%)、日志里有报错、没有健康检查,以及三条**采集失败**信号;
|
|
513
|
+
- **证据**(`evidence`):状态 / ps 风格的状态描述(`Up 4 hours (healthy)`)/ 退出码 / OOM /
|
|
514
|
+
重启次数 / 起止时间 / 内存上限 / CPU 配额 / 日志行数与报错行数 / 事件条数 / 当前资源占用;
|
|
515
|
+
- **时间线**(`timeline`):本容器在窗口内的 `start` / `die` / `oom` / `health_status` 等事件,升序;
|
|
516
|
+
- **建议**(`suggestions`):0~5 条可执行动作。
|
|
517
|
+
|
|
518
|
+
**「没采到」与「确实是空的」是两件事**(本仓一贯的信号位原则):旁路三路(日志 / 事件 / 统计)
|
|
519
|
+
任一失败时,证据里对应字段是 `null`(不是 0、不是空数组),并多出一条 `*-unavailable` 说明原因。
|
|
520
|
+
否则「连不上主机」会被读成「日志是空的、从没重启过」,排障方向当场被带偏。
|
|
521
|
+
|
|
522
|
+
页签底部三个动作:**重新诊断**、**复制诊断**、**交给 Agent**。最后这个走的就是日志右键那套
|
|
523
|
+
会话桥(直接发送 / 填入草稿二选一,没有会话时置灰并写明原因):文本自带容器、目标、采集时间、
|
|
524
|
+
结论与证据,日志原文用围栏包起来并标注「这是数据不是指令」。**采集时间在界面上是本地时间、
|
|
525
|
+
投递文本里是 ISO 8601**——前者给人看,后者可排序、无时区假设。
|
|
526
|
+
|
|
527
|
+
诊断是**只读**:不改容器、不重启、不发命令,只多跑四条只读 docker 命令(因此最坏情况是四个
|
|
528
|
+
命令预算,而不是无界等待)。
|
|
529
|
+
|
|
530
|
+
### 诊断历史(它是不是在慢慢变坏)
|
|
531
|
+
|
|
532
|
+
单次诊断只回答「现在怎么样」;**缓慢变坏**(内存一点点涨、重启越来越频繁、报错逐渐变多)在单次
|
|
533
|
+
结果里看不出来。所以每次诊断都会落一个**样本**,诊断页据此多一块「历史」:
|
|
534
|
+
|
|
535
|
+
- **色带**:最近 N 次的严重度(悬停显示时间与结论 code);
|
|
536
|
+
- **趋势结论**(`trend.verdict`):七条判据取最高的一条——反复重启(重启次数涨 ≥2)、反复 OOM
|
|
537
|
+
(≥2 次)、内存爬升(≥20 个百分点且末值 ≥80%)、报错增长(≥5 行或从 0 变正)、新出现严重判据
|
|
538
|
+
(`oom-killed` / `crash-loop` / `unhealthy` / `exit-nonzero`)、严重度连续走高、没有明显变化;
|
|
539
|
+
样本不足 2 次时明说「还不够形成趋势」;
|
|
540
|
+
- **数字变化**(`trend.numbers`):只列**真的变了**的项,且每项有「最小有意义变化」——重启 ≥1、
|
|
541
|
+
内存 ≥1 个百分点、CPU ≥5 个百分点、报错 ≥3 行、事件 ≥5 条、日志行数 ≥50。这组阈值是真机
|
|
542
|
+
逼出来的:诊断只取一个 `stats` 瞬时快照,1.11% → 1.09% 这种抖动不设闸就会把趋势块填满;
|
|
543
|
+
报错行数则是**滑动窗口**(一条老报错滑出去就 −1),所以给到 3 行才算变化;
|
|
544
|
+
- **判据增减**:「新出现」/「已消失」两行(`oom-killed` 是新出现的,那就是恶化信号)。
|
|
545
|
+
|
|
546
|
+
**存什么、不存什么**(刻意的取舍):样本**只存结论与数字**——严重度、结论 code、判据 code 列表、
|
|
547
|
+
状态 / 退出码 / OOM / 重启次数 / 内存与 CPU 占用 / 报错行数 / 事件条数 / 日志行数 / 时间。
|
|
548
|
+
**绝不落盘**:日志原文(`logTail`)与每条判据的 detail(里面会嵌日志行,可能带凭证)。所以这份文件
|
|
549
|
+
可以放心 `cat`,但它也因此**不能**用来回放某次排障现场——要原文就重新诊断一次。
|
|
550
|
+
|
|
551
|
+
落盘:`<DSH 主目录>/dsh-docker/diagnosis-history.jsonl`(目录 `0700`、文件 `0600`),一行一条。
|
|
552
|
+
上限:**每个容器 50 条**、整文件 **2000 条**,超了丢最旧并**原子重写**(临时文件 + rename)。
|
|
553
|
+
**30 秒去重**:同一容器、30 秒内、且严重度 + 结论 + 判据集合 + 重启次数完全相同时**不追加**
|
|
554
|
+
(连点「重新诊断」不该在趋势里制造假波动),界面会写明「本次与上次一致,30 秒内不重复记录」。
|
|
555
|
+
`DSH_DOCKER_HISTORY_DIR` 可覆写目录(**测试 / 排障专用**),空串视为未设。
|
|
556
|
+
|
|
557
|
+
三条已知边界:① **容器改名 = 开一段新历史**(索引键是「目标 + 容器名」)——比让两段历史混在一起、
|
|
558
|
+
趋势说出没发生过的变化好;② **并发追加没加锁**(两个诊断同时写可能丢一次更新),历史是辅助信息,
|
|
559
|
+
为它加文件锁不值;③ **写盘失败只降级不报错**:诊断照常返回、`recorded = false`、宿主 stdout 留一行。
|
|
560
|
+
|
|
561
|
+
### 磁盘与可回收(存储治理)
|
|
562
|
+
|
|
563
|
+
**磁盘**是工具条分段的最后一段(容器 / 镜像 / Compose / 网络 / 卷 / 磁盘),agent 侧是 `docker_disk_usage`。
|
|
564
|
+
数据来自两条命令:`docker system df`(四类汇总)与 `docker system df -v`(逐项明细)。
|
|
565
|
+
|
|
566
|
+
- 四张汇总卡:镜像 / 容器 / 本地卷 / 构建缓存各自的**条目数、活跃数、占用、可回收**
|
|
567
|
+
(分类名保留 docker 原文,界面负责翻译);
|
|
568
|
+
- **合计可回收**:四类 `reclaimable` 的字节和(任一行解析不出就给 `—`,宁可不说也不给错数);
|
|
569
|
+
- **镜像明细**(按独占大小降序):仓库:标签 / 大小 / 独占 / **容器数**——`containers === 0`
|
|
570
|
+
打「未使用」徽标,行尾删除图标(受 `allowMutations` 门、走既有确认框);
|
|
571
|
+
- **卷明细**(按大小降序):名称 / 驱动 / 大小 / **链接数**——`links === 0` 同样打「未使用」。
|
|
572
|
+
|
|
573
|
+
三条刻意的取舍:
|
|
574
|
+
|
|
575
|
+
- **先排序再截断**:真机实测 259 个卷里 258 个是 0B,先截断会把 100 个名额全给空卷,明细表
|
|
576
|
+
看起来「全是没用的」而真正占空间的反而没进来;
|
|
577
|
+
- **明细上限 100 行**,超了在表头写「明细已截断,只显示前 100 行」(工具侧另按 20 行截,
|
|
578
|
+
两个 `truncated` 取或)——截断要留痕,不静默少列;
|
|
579
|
+
- **老 docker 只降级不报错**:不支持 `-v --format '{{json .}}'`、或输出被截断/形状不对时,
|
|
580
|
+
`degraded: true` + 一句人话原因,汇总卡照常显示、明细表**不渲染**(渲染空表会让人以为「没有」)。
|
|
581
|
+
|
|
582
|
+
磁盘页**不轮询**(`system df -v` 比 `docker images` 贵),也**没有 prune 按钮**:逐行删除 +
|
|
583
|
+
确认框比「一键清空一类」安全,而那类入口已经在镜像 / 卷页的工具条上各有一个。
|
|
584
|
+
|
|
585
|
+
### 等价 `docker run`(现场还原)
|
|
586
|
+
|
|
587
|
+
概览页底部有一块可折叠的**等价 docker run**,agent 侧是 `docker_run_command`。它从 `docker inspect`
|
|
588
|
+
的**原始行**反推一条可复现命令——**不扩 `ContainerDetail`**,因为那会把 env 顺带灌进
|
|
589
|
+
`docker_inspect` 的模型上下文。覆盖:名称、重启策略、端口映射(没绑 hostPort 的用 `--expose`)、
|
|
590
|
+
bind / 命名卷 / tmpfs、非默认网络、环境变量、用户 / 工作目录 / 主机名(等于默认值时省略)、
|
|
591
|
+
内存与 CPU 上限、cap-add / cap-drop / device,以及镜像与命令本身。
|
|
592
|
+
|
|
593
|
+
**点开才请求**(折叠区展开才打 `/run-command`),一行一个参数、POSIX 单引号转义,可直接复制。
|
|
594
|
+
|
|
595
|
+
三条刻意的取舍:
|
|
596
|
+
|
|
597
|
+
- **环境变量原值保留**(改写过就不是等价命令),命中
|
|
598
|
+
`/(PASS|PWD|SECRET|TOKEN|KEY|CRED|AUTH|PRIVATE)/i` 的**键名**收进 `secretKeys`:界面在命令上方
|
|
599
|
+
给一条「含疑似凭证」的警告,**只点键名、不显示值**;命令本身不脱敏——脱敏后的命令跑不起来,
|
|
600
|
+
而它的用途正是「拿出去跑」;
|
|
601
|
+
- **故意没还原的必须点名**(`omitted`):`--privileged`、`--link`、非默认日志驱动、
|
|
602
|
+
`--pid/--ipc/--uts`、`--sysctl`、`--add-host`、`--security-opt`、特殊挂载类型、匿名卷、
|
|
603
|
+
ENTRYPOINT 覆盖、自定义健康检查——逐条给出「为什么没写」与「怎么自己补上」,**绝不静默丢**;
|
|
604
|
+
- **compose 管理的容器只是近似**:网络别名 / labels / depends_on 不在命令里,界面直说。
|
|
605
|
+
|
|
477
606
|
## 配置(保存即热生效)
|
|
478
607
|
|
|
479
608
|
未获宿主授权时,设置卡片里那两个开关**点它会就地发起一次授权**:面板给出一条「在宿主终端执行」
|
|
@@ -585,14 +714,18 @@ challenge 的 TTL 与探测周期各自独立,所以文案只说「执行后
|
|
|
585
714
|
| `docker_connect_local` | 恒注册 | —(无参数) | **连接本机**:确保存在一条 `kind=local` 目标并选中它(已存在则复用,不重复创建;SSH / 自定义目标原样保留),随后只读探测 daemon:返回 `{name, kind, created, saved, reachable, serverVersion?}`。没有任何目标时其余工具不注册(见下方「零目标」那条),用它一步补上。**不需要任何能力授权**(只写插件自己的配置 + 只读探测);不会安装 Docker / 启动 daemon / 切 context / 改环境变量。daemon 不可达时在结果文本里说清成因(CLI 缺失 / 探测超时 / daemon 未启动 / socket 无权;CLI 缺失时还会点名 PATH 里找到的别的容器 CLI,但不会替你改 dockerBin),不是只报空列表 |
|
|
586
715
|
| `docker_ps` | 有目标即注册 | `target?`(**传 `*` = 全部目标**)、`all?: boolean`、`limit?`(1~500,默认 100)、`offset?`(默认 0) | 列容器(名称 / 状态 / 健康 / 镜像 / 端口 / compose 项目与服务 / 短 ID);默认只列运行中,`all:true` 含已停止。`target:'*'` 时按目标分组返回,**单个目标不可达不影响其他目标**(该组带 `error`)。端口是 IPv4/IPv6 双栈归并后的映射(同一次 `-p` 不再出现两遍,D130);`ports` 为空**不等于**没暴露端口——host 网络容器的端口即宿主机端口,这种情况会给 `net` 字段(D131)。排障第一步 |
|
|
587
716
|
| `docker_attention` | 有目标即注册 | `target?`(支持 `*`)、`limit?: number` | **需关注汇总**:不健康 / 反复重启 / 被 OOM 杀 / 非零退出 / 僵死;每条带 `reasons`、`exitCode`、`oomKilled`、`restartCount`。OOM 与真实退出码来自一次 `docker inspect`(ps 摘要里 137 无法区分手动 kill)。排障入口:不确定从哪台/哪个容器看起时先调它 |
|
|
717
|
+
| `docker_diagnose` | 有目标即注册 | `target?`、`id`(必填)、`logTail?`(1~500,默认 80)、`since?`(docker 语法,默认 `1h`)、`history?`(0~50,默认 10,0 = 不要历史) | **容器「为什么不行」**:一次采集 inspect + 日志尾部 + 本容器事件(服务端 `--filter container`)+ `stats` 快照,产出 `verdict`(一句话结论)/ `findings`(判据表,每条带 code、severity、title、detail)/ `evidence`(退出码、OOM、重启次数、内存与 CPU 上限、日志与事件条数、当前占用)/ `timeline` / `suggestions`。**只读**;「没采到」给 `null` 并附 `*-unavailable` 判据,绝不写成 0。要更多日志 / 找关键词用 `docker_logs_grep`。返回里还带 `history`(最近 N 个**只含结论与数字**的样本 + 趋势结论 `trend`)——`trend.verdict.summary` 就是「它是不是在慢慢变坏」那一句 |
|
|
588
718
|
| `docker_inspect` | 有目标即注册 | `target?`、`id`(必填) | `docker inspect` 的权威详情:状态 / 健康检查 / 退出码 / 重启次数 / 端口 / 挂载 / 网络 / 启动命令 |
|
|
589
719
|
| `docker_logs` | 有目标即注册 | `target?`、`id`、`tail?`(1~5000,默认 `logTailDefault`)、`timestamps?`、`since?`、`until?` | `docker logs --tail` 尾部;`since` / `until` 用 docker 语法(如 `10m`、`2026-09-09T10:00:00`)圈时间窗;超上限标记 `truncated`;截断时(`truncated`)结果里会说明可传更小的 `tail`、加 `since`/`until`,或改用 `docker_logs_grep` |
|
|
590
720
|
| `docker_logs_grep` | 有目标即注册 | `target?`、`id`、`pattern`(必填,≤512 字符)、`regexp?`、`ignoreCase?`、`since?`、`until?`、`context?`(0~20,默认 2)、`limit?`(1~500,默认 200)、`tail?`(缺省 = 扫全部历史)、`timestamps?`(默认开) | **日志服务端检索**:宿主侧逐行过滤(不碰远端 shell、不拼 `\| grep`),返回命中行 + 前后上下文,并如实报告 `matched`(全量命中数,即使没返回)/ `scanned` / `limited` / `truncated`——「只扫到这些」与「扫完了没更多」可区分;扫描窗口**对齐到行边界**(按字节截断处的半行不当作一行返回,所以 `lines` 里每一行都是完整的行);返回行数另有上限:最多 4000 行(`MAX_RESULT_LINES`),超了截到上限并给 `truncatedForSize` 与 `notes`(缩小 `limit` / 减小 `context` / 加 `since`·`until` 圈时间窗),`matched` 仍报全量。与 `docker_logs` 的分工:报错就在最近尾部 → `docker_logs`(便宜);埋在深处 / 特定时间窗 / 找关键词、异常码、请求 ID → 本工具。默认字面子串(grep -F 语义,零 ReDoS),`regexp: true` 才按 JS 正则 |
|
|
591
721
|
| `docker_stats` | 有目标即注册 | `target?`、`ids?`(逗号分隔的容器名/ID) | `docker stats --no-stream` 快照:CPU% / 内存用量与占比 / 网络 IO / 块 IO / PIDs;`ids` 省略 = 全部运行中容器。实时跟随是面板能力(SSE),工具保持单值快照语义 |
|
|
592
722
|
| `docker_images` | 有目标即注册 | `target?`、`limit?`(1~500,默认 100)、`offset?`(默认 0) | 镜像列表(仓库:标签 / 大小 / 创建时间 / 短 ID) |
|
|
723
|
+
| `docker_top` | 有目标即注册 | `target?`、`id`(必填) | 容器内进程快照(`docker top <id> -eo pid,ppid,user,stat,etime,pcpu,pmem,cmd`):PID / PPID / 用户 / STAT / 已运行 / CPU / 内存 / 命令,字段全是 docker 打印的原文。容器「还在跑」与「进程还在」是两件事 |
|
|
593
724
|
| `docker_events` | 有目标即注册 | `target?`、`since?`(docker `--since` 语法,默认 `10m`) | 容器事件快照(`docker events --since <d> --until <now>`,同样过服务端白名单):start / die / stop / kill / oom / health_status / destroy / rename / update 九类,`exec_*` 等噪音已在服务端丢掉。要持续观察请让用户看面板容器列表的「活动」条 |
|
|
594
725
|
| `docker_networks` | 有目标即注册 | `target?`、`limit?`(1~500,默认 100)、`offset?`(默认 0) | 网络列表(名称 / 驱动 / 范围 / 是否 internal / 短 ID)。接入的容器列表不进列表行——详情页会连坐 inspect,列表逐行 inspect 就是 N 次 docker 调用 |
|
|
595
726
|
| `docker_volumes` | 有目标即注册 | `target?`、`limit?`(1~500,默认 100)、`offset?`(默认 0) | 卷列表(名称 / 驱动 / 范围 / 挂载点) |
|
|
727
|
+
| `docker_disk_usage` | 有目标即注册 | `target?` | 磁盘占用与**「谁在用」**:`docker system df` 四类汇总(条目 / 活跃 / 占用 / 可回收)+ `-v` 明细(镜像的 `containers`、卷的 `links`,各截 20 行)。删之前先看 `containers` 是不是 0;汇总与明细是两条命令,明细失败只降级(`degraded`) |
|
|
728
|
+
| `docker_run_command` | 有目标即注册 | `target?`、`id`(必填) | **只推导、不执行**:从 `docker inspect` 原始数据反推等价 `docker run` 命令文本(端口 / 挂载 / env / 重启策略 / 网络 / 资源上限 / capability)+ `warnings` / `secretKeys`(只给键名,值不脱敏)/ `omitted`(故意没还原的,逐条给原因)。compose 容器只是近似 |
|
|
596
729
|
| `docker_image_inspect` | 有目标即注册 | `target?`、`ref`(必填) | `docker image inspect` + `docker history`:大小 / 含父层大小 / 创建时间 / 平台 / 层数与层列表 / 入口与命令 / 暴露端口 / digest / 构建历史(每步命令与大小) |
|
|
597
730
|
| `docker_action` | `allowMutations` + 有目标 | `target?`、`action`(`start` \| `stop` \| `restart` \| `remove`)、`id` | 容器生命周期操作。`remove` 是破坏性的:删除容器配置与可写层(数据卷不在其中),执行前必须向用户确认目标容器 |
|
|
598
731
|
| `docker_image_remove` | `allowMutations` + 有目标 | `target?`、`ref`(必填) | 删除镜像(`docker image rm`,不带 `-f`)。**破坏性**:被容器或子镜像引用时会失败;执行前须确认目标镜像并复述后果 |
|
|
@@ -619,10 +752,12 @@ challenge 的 TTL 与探测周期各自独立,所以文案只说「执行后
|
|
|
619
752
|
`tier-gate: services absent (…), per-call gate disabled`。它与上面两个静态开关是**双层**:
|
|
620
753
|
静态开关管注册(宿主级、持久授权),档位闸管已注册调用的放行(逐调用、随档位即时变)。
|
|
621
754
|
机制见 [docs/permission-tier-plan.md](../../docs/permission-tier-plan.md)。
|
|
622
|
-
- 推荐排障顺序:`docker_targets` → `docker_ps` →
|
|
623
|
-
|
|
624
|
-
`
|
|
625
|
-
`
|
|
755
|
+
- 推荐排障顺序:`docker_targets` → `docker_ps` → **`docker_diagnose`**(一次拿到结论 + 判据 +
|
|
756
|
+
证据,多数「它为什么挂了 / 为什么不动」到这里就有方向了)→ `docker_logs`(尾部看不到成因就
|
|
757
|
+
`docker_logs_grep` 带 `pattern` / `since` / `until` 检索深处)→ `docker_inspect`(原始字段)→
|
|
758
|
+
`docker_stats` / `docker_top`(活着但不对劲:先看资源,再看进程还在不在);镜像排查
|
|
759
|
+
`docker_images` → `docker_image_inspect`;要清磁盘先 `docker_disk_usage`(看 `containers` /
|
|
760
|
+
`links` 谁在用),再决定删什么。
|
|
626
761
|
- `announceToAgent` 开启时,插件向 systemPrompt 注入一段精简公告:插件与面板位置、「默认
|
|
627
762
|
只读」与「docker socket ≈ 目标主机 root」的约束、「`allowExec` 只管一次性 exec 通道」的
|
|
628
763
|
边界(卡片「终端」按钮不受它门控)、`target` 的 `*` 适用范围,以及跨工具排障顺序;它不
|
|
@@ -664,6 +799,8 @@ challenge 的 TTL 与探测周期各自独立,所以文案只说「执行后
|
|
|
664
799
|
| `/inspect` | POST | `{target?, id}` | `{ok:true, details: ContainerDetail[]}` |
|
|
665
800
|
| `/stats` | POST | `{target?, ids?: string[]}` | `{ok:true, stats: ContainerStats[]}` |
|
|
666
801
|
| `/logs` | POST | `{target?, id, tail?, timestamps?, since?}` | `{ok:true, logs:{id, text, truncated}}` |
|
|
802
|
+
| `/top` | POST | `{target?, id}`(必填) | `{ok:true, top:{id, name, rows:[{pid, ppid, user, stat, elapsed, cpu, mem, command}], truncated}}`——字段全是 `docker top` 打印的原文;未运行 / 不存在时走既有错误通道(不是 200 空列表) |
|
|
803
|
+
| `/diagnose` | POST | `{target?, id}`(必填)、`logTail?`(1~500,默认 80)、`since?`(默认 `1h`)、`history?`(0~50,默认 10) | `{ok:true, diagnosis:{verdict, findings, evidence, timeline, logTail, suggestions, history:{samples, trend, recorded}}}`。`history` 是本次记录**之后**的最近 N 条样本与趋势(`recorded` 说明本次有没有真的追加——30 秒去重命中时为 `false`)。四路采集,旁路失败只降级(evidence 对应字段 `null` + `*-unavailable` 判据);非法 `since` 在引用白名单段就 400 |
|
|
667
804
|
| `/logs/stream` | GET | query:`target?`、`id`(单容器,与 `ids` 二选一)或 `ids`(逗号分隔的多个容器,**一条连接装下全部**,最多 32 个)、`tail?`(**0**~5000;`0` = 不补历史只跟随,客户端重连用)、`timestamps?`(`1`/`true`)、`since?` | `200 text/event-stream` 长连接,事件协议见下;参数错误 / 未知目标 / 非 loopback 返回常规 JSON 错误 |
|
|
668
805
|
| `/stats/stream` | GET | query:`target?`、`ids?`(逗号分隔;省略 = 全部运行中) | `200 text/event-stream`:每秒一帧 `stats`(ContainerStats,形状与 /stats 快照一致);不会自然结束,靠客户端断连收尾 |
|
|
669
806
|
| `/events/stream` | GET | query:`target?` | `200 text/event-stream`:一帧 `event` 一个容器事件(服务端已过白名单,值缺失的字段省略);不会自然结束,靠客户端断连收尾 |
|
|
@@ -680,6 +817,8 @@ challenge 的 TTL 与探测周期各自独立,所以文案只说「执行后
|
|
|
680
817
|
| `/volumes/inspect` | POST | `{target?, name}`(必填) | `{ok:true, volume:{name, detail: VolumeDetail}}`(挂载点 / 选项 / 标签) |
|
|
681
818
|
| `/volumes/remove` | POST | `{target?, name}`(必填) | 需 `allowMutations`(否则 403);`docker volume rm`(**数据随卷一起没**);`{ok:true, result:{name, message}}` |
|
|
682
819
|
| `/volumes/prune` | POST | `{target?}` | 需 `allowMutations`(否则 403);`docker volume prune -f`(**删数据**,见已知限制);`{ok:true, result:{message}}` |
|
|
820
|
+
| `/system-df` | POST | `{target?}` | `{ok:true, disk:{summary, images, volumes, buildCache, truncated, degraded, degradedReason}}`:`summary` 是四类汇总,明细各上限 100 行(**先排序再截断**);老 docker 只降级不报错 |
|
|
821
|
+
| `/run-command` | POST | `{target?, id}`(必填) | `{ok:true, recreate:{id, name, command, warnings, secretKeys, omitted}}`——**只推导,不执行**;`omitted` 是「故意没还原」的唯一出口 |
|
|
683
822
|
| `/action` | POST | `{target?, action, id}` | 需 `allowMutations`(否则 403);`{ok:true, result:{id, action, message}}` |
|
|
684
823
|
| `/exec` | POST | `{target?, id, command, timeoutSec?}` | 需 `allowExec`(否则 403);`{ok:true, result:{id, command, code, stdout, stderr, truncated, durationMs}}` |
|
|
685
824
|
|
|
@@ -911,6 +1050,22 @@ abort)、客户端断开静默中止,以及**管道起来后先发一帧 `re
|
|
|
911
1050
|
- **没有镜像构建 / Compose 编排变更**:镜像支持拉取 / 删除 / 清理 dangling,
|
|
912
1051
|
但没有 `docker build`、`docker save` / `load`、`docker push`;Compose 是**只读**
|
|
913
1052
|
项目视图(按项目分组 + 项目级聚合日志),不提供 `compose up` / `down` / `restart`。
|
|
1053
|
+
- **诊断是判据,不是专家**:15 条判据覆盖的是「容器自报的客观证据」(退出码 / OOM /
|
|
1054
|
+
重启次数 / 健康检查 / 资源压力 / 日志里的报错行),**不理解业务**。它给出的结论是
|
|
1055
|
+
「证据指向什么」,不会替你判断「这个报错是否可忽略」——那一步交给「交给 Agent」之后的人或模型。
|
|
1056
|
+
代价也说清:诊断一次跑**四条**只读命令(inspect + logs + events + stats),在 SSH 目标上
|
|
1057
|
+
就是最多四条 channel(短命令闸会把并发压到 2,所以是两批),慢机器上会感觉到等。
|
|
1058
|
+
- **事件采集给的是独立预算(8MB + 留尾)**:单容器一小时的事件里,`exec_create` /
|
|
1059
|
+
`exec_start` / `exec_die` 这种解析阶段就被白名单丢掉的三连占绝大多数(真机实测 1h / 256 条 /
|
|
1060
|
+
588KB 里绝大多数是它们),按通用的 512KB 档会让时间线**永远为空**。所以诊断的事件采集单独
|
|
1061
|
+
放宽到 8MB 并保留尾部——窗口内事件特别多的容器,时间线只覆盖**最近的**一段。
|
|
1062
|
+
- **等价 `docker run` 是近似,不是备份**:compose 管理的容器不带网络别名 / labels / depends_on;
|
|
1063
|
+
`--privileged` / `--link` / ENTRYPOINT 覆盖 / 自定义健康检查 / 匿名卷等**故意不还原**,逐条列在
|
|
1064
|
+
`omitted` 里。**它不能替代 `docker commit` / 卷备份**,只是「手边有一条能读懂、能改、能复现的命令」。
|
|
1065
|
+
- **磁盘明细的两处截断各自独立**:宿主侧每类 100 行(`truncated`)、工具侧 20 行;真机上
|
|
1066
|
+
卷多到几千个时,`system df -v` 的输出本身也可能撞 8MB 预算(那时 `degraded: true`,
|
|
1067
|
+
汇总仍然可用)。`system df` 的人工可读大小是 docker 自己算的(SI 单位),
|
|
1068
|
+
「合计可回收」由字符串解析成字节再相加——**解析不出就整条显示 `—`**,不给近似值。
|
|
914
1069
|
- **`volume prune` 会删数据,且行为随版本变**:docker ≥ 23 的 `docker volume prune`
|
|
915
1070
|
有 `-a/--all`,**不带时只删匿名卷**(本插件就不带);但 docker < 23 没有这个开关,
|
|
916
1071
|
plain prune 会把未被使用的**命名卷**一起删掉。所以卷清理的确认文案把版本差异写明了,
|