@gtadi/k8s-node-debugger 1.0.1 → 1.0.2
This diff represents the content of publicly available package versions that have been released to one of the supported registries. The information contained in this diff is provided for informational purposes only and reflects changes between package versions as they appear in their respective public registries.
- package/README.md +23 -2
- package/package.json +1 -1
- package/public/app.js +4 -0
- package/public/health-view.js +412 -0
- package/public/style.css +50 -0
- package/src/probes.js +10 -4
package/README.md
CHANGED
|
@@ -22,16 +22,37 @@ node bin/k8s-node-debugger.js <node-name>
|
|
|
22
22
|
|
|
23
23
|
|
|
24
24
|
|
|
25
|
+
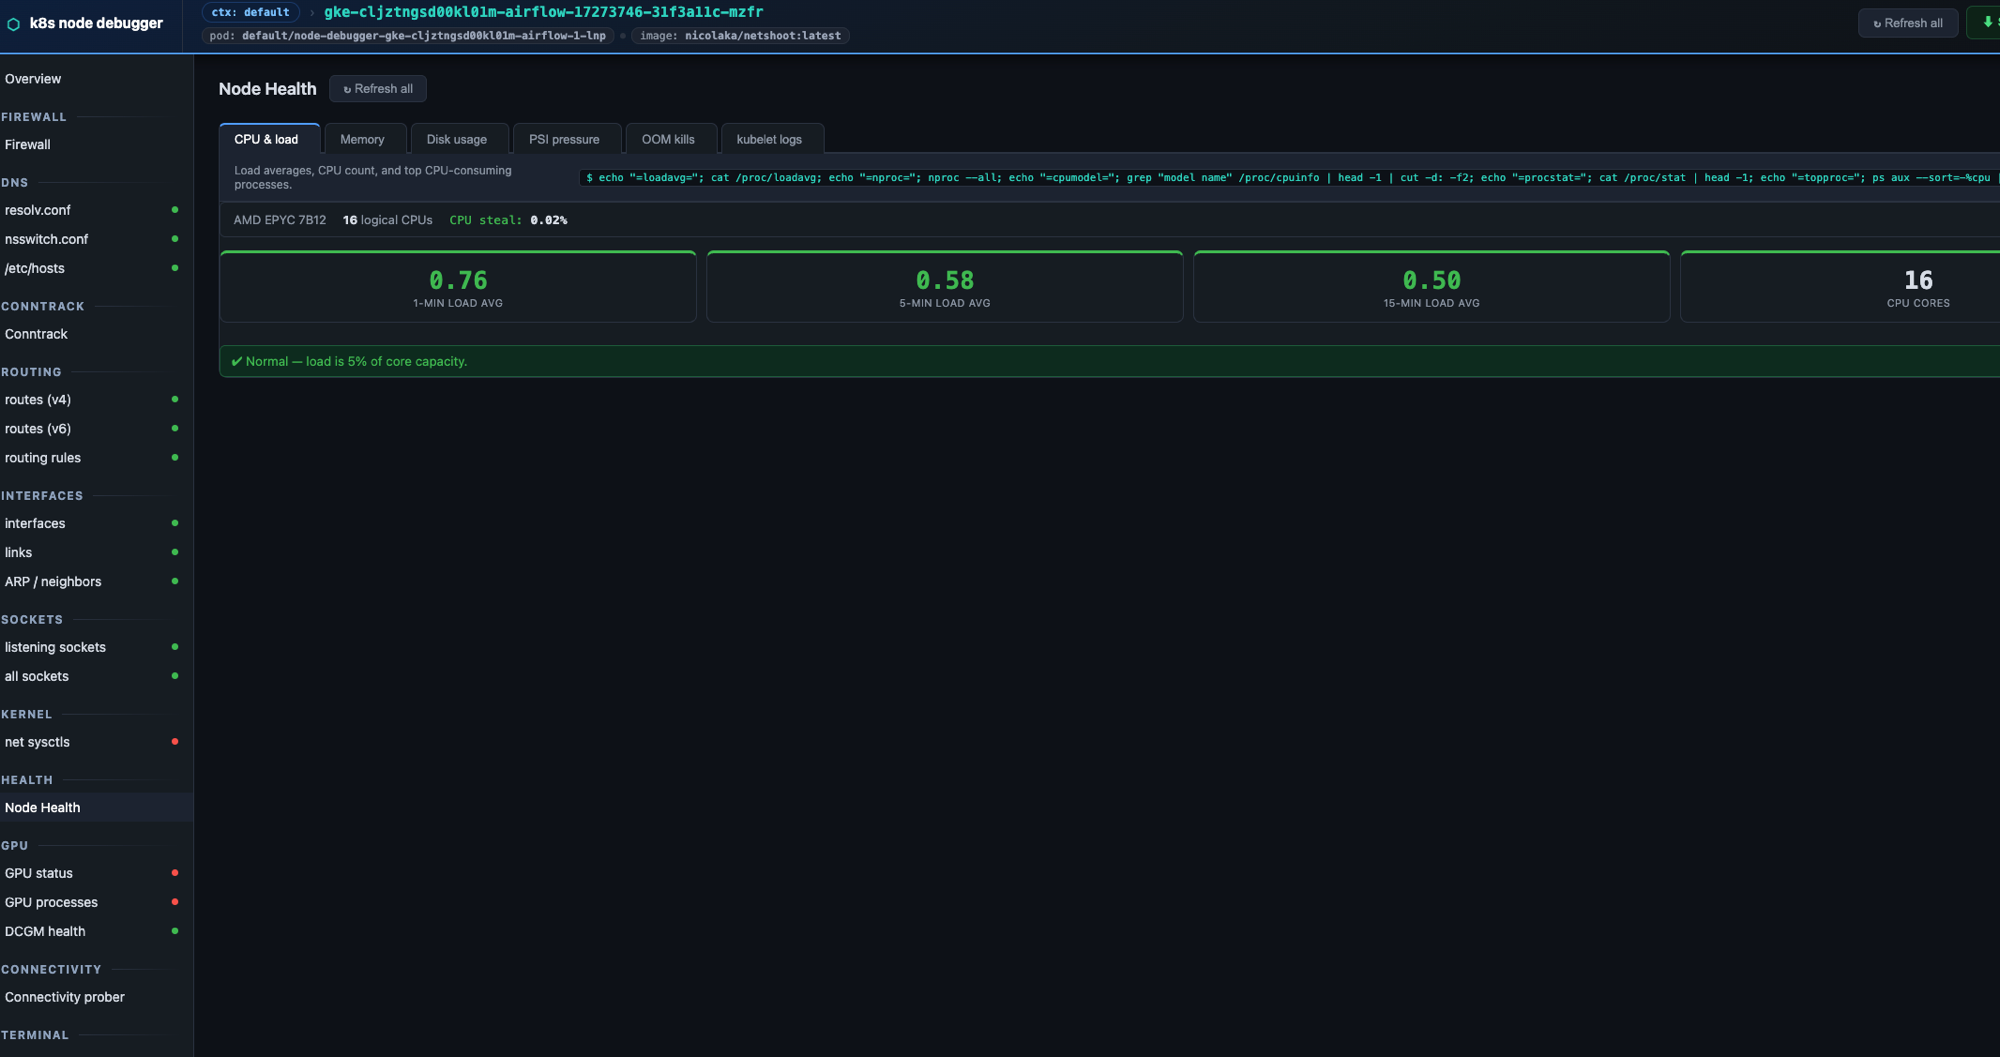
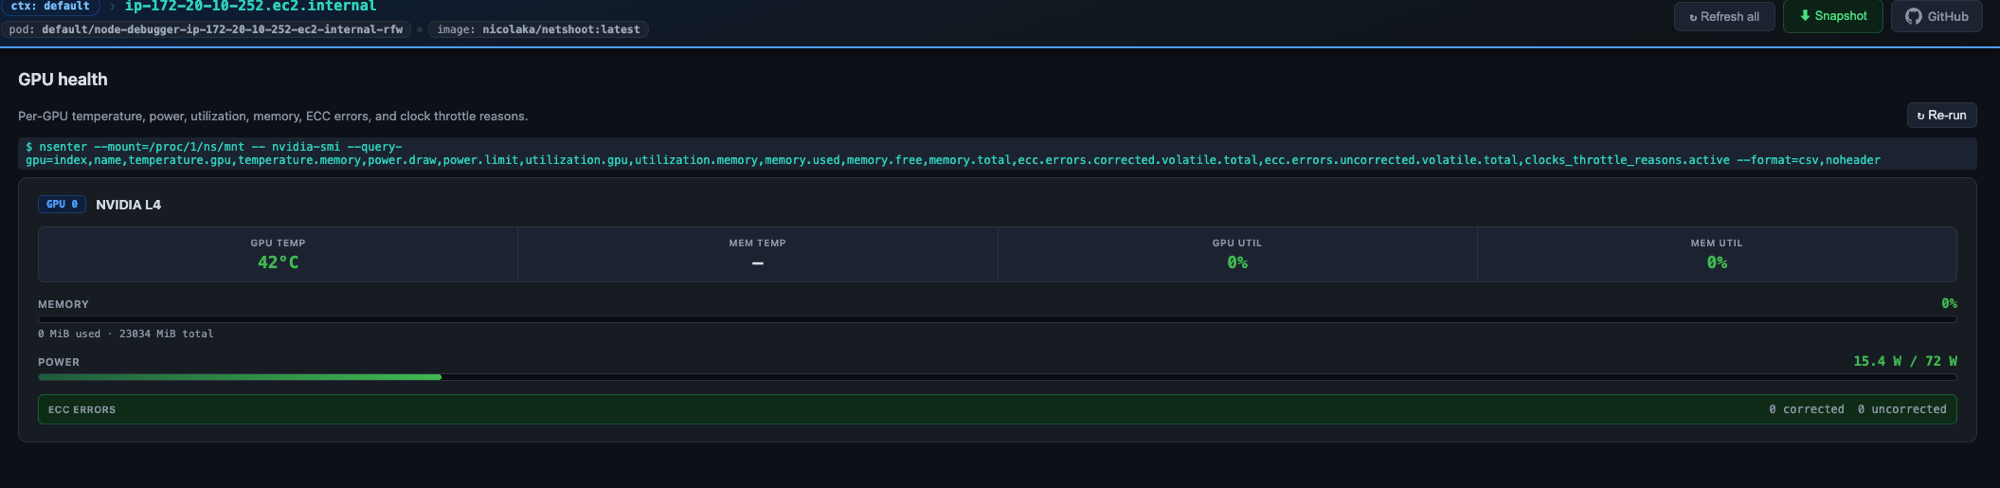
### GPU Health — temperature, power, utilization, memory, ECC errors, clock throttle
|
|
26
|
+
|
|
27
|
+
|
|
28
|
+
|
|
29
|
+
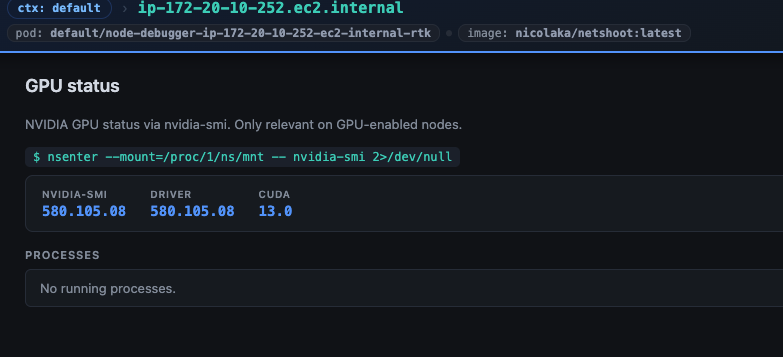
### GPU Status — driver version, CUDA, per-GPU metrics, processes
|
|
30
|
+
|
|
31
|
+
|
|
32
|
+
|
|
25
33
|
## Install
|
|
26
34
|
|
|
35
|
+
```bash
|
|
36
|
+
npm install -g @gtadi/k8s-node-debugger
|
|
37
|
+
```
|
|
38
|
+
|
|
39
|
+
Or run without installing:
|
|
40
|
+
|
|
41
|
+
```bash
|
|
42
|
+
npx @gtadi/k8s-node-debugger <node-name>
|
|
43
|
+
```
|
|
44
|
+
|
|
45
|
+
Requires `kubectl` on your PATH with an active kubeconfig. The debug image (`nicolaka/netshoot`) is pulled from Docker Hub on first use.
|
|
46
|
+
|
|
47
|
+
### From source
|
|
48
|
+
|
|
27
49
|
```bash
|
|
28
50
|
git clone git@github.com:goutamtadi1/k8s-node-debugger.git
|
|
29
51
|
cd k8s-node-debugger
|
|
30
52
|
npm install
|
|
53
|
+
node bin/k8s-node-debugger.js <node-name>
|
|
31
54
|
```
|
|
32
55
|
|
|
33
|
-
Requires `kubectl` on your PATH with an active kubeconfig. The debug image (`nicolaka/netshoot`) is pulled from Docker Hub on first use.
|
|
34
|
-
|
|
35
56
|
## Usage
|
|
36
57
|
|
|
37
58
|
```bash
|
package/package.json
CHANGED
|
@@ -1,6 +1,6 @@
|
|
|
1
1
|
{
|
|
2
2
|
"name": "@gtadi/k8s-node-debugger",
|
|
3
|
-
"version": "1.0.
|
|
3
|
+
"version": "1.0.2",
|
|
4
4
|
"description": "Spin up a privileged debug pod on a target Kubernetes node and inspect its network stack (iptables, resolv.conf, conntrack, routes, sockets) from a browser UI.",
|
|
5
5
|
"bin": {
|
|
6
6
|
"k8s-node-debugger": "bin/k8s-node-debugger.js"
|
package/public/app.js
CHANGED
|
@@ -256,6 +256,7 @@ const FANCY_PROBES = new Set([
|
|
|
256
256
|
'iptables', 'iptables-nat',
|
|
257
257
|
'conntrack', 'conntrack-stats', 'conntrack-count',
|
|
258
258
|
'mem-info', 'mem-pressure', 'oom-kills', 'kubelet-logs', 'disk-usage', 'cpu-stat',
|
|
259
|
+
'gpu-info', 'gpu-health', 'gpu-processes',
|
|
259
260
|
]);
|
|
260
261
|
|
|
261
262
|
function buildProbePanel(probe) {
|
|
@@ -385,6 +386,9 @@ function tryFancyRender(id, output, container) {
|
|
|
385
386
|
'kubelet-logs': () => renderKubeletLogsView(output, container),
|
|
386
387
|
'disk-usage': () => renderDiskView(output, container),
|
|
387
388
|
'cpu-stat': () => renderCpuView(output, container),
|
|
389
|
+
'gpu-info': () => renderGpuInfoView(output, container),
|
|
390
|
+
'gpu-health': () => renderGpuHealthView(output, container),
|
|
391
|
+
'gpu-processes': () => renderGpuProcessesView(output, container),
|
|
388
392
|
};
|
|
389
393
|
if (!renderers[id]) return false;
|
|
390
394
|
try { renderers[id](); return true; } catch (e) { console.error('[fancy render]', id, e); return false; }
|
package/public/health-view.js
CHANGED
|
@@ -451,6 +451,415 @@
|
|
|
451
451
|
container.appendChild(wrap);
|
|
452
452
|
}
|
|
453
453
|
|
|
454
|
+
/* ══════════════════════════════════════════════════════════════════════
|
|
455
|
+
* GPU status — nvidia-smi plain text table
|
|
456
|
+
* ══════════════════════════════════════════════════════════════════════ */
|
|
457
|
+
function renderGpuInfoView(raw, container) {
|
|
458
|
+
if (!raw.includes('NVIDIA-SMI')) { container.className = 'output'; container.textContent = raw; return; }
|
|
459
|
+
|
|
460
|
+
const lines = raw.split('\n');
|
|
461
|
+
|
|
462
|
+
// Version header
|
|
463
|
+
const verLine = lines.find(l => l.includes('NVIDIA-SMI')) || '';
|
|
464
|
+
const smiVer = verLine.match(/NVIDIA-SMI\s+(\S+)/)?.[1] || '—';
|
|
465
|
+
const driverVer = verLine.match(/Driver Version:\s+(\S+)/)?.[1] || '—';
|
|
466
|
+
const cudaVer = verLine.match(/CUDA Version:\s+(\S+)/)?.[1] || '—';
|
|
467
|
+
|
|
468
|
+
// Collect GPU data: groups of 3 content lines between |====| ... +---+
|
|
469
|
+
const gpus = [];
|
|
470
|
+
let inGpu = false, buf = [];
|
|
471
|
+
for (const line of lines) {
|
|
472
|
+
if (/^\|[=]+\|?$/.test(line.trim())) { inGpu = true; buf = []; continue; }
|
|
473
|
+
if (inGpu && line.startsWith('+')) {
|
|
474
|
+
if (buf.length >= 2) {
|
|
475
|
+
const g = parseNvidiaSmiGpuBlock(buf);
|
|
476
|
+
if (g) gpus.push(g);
|
|
477
|
+
}
|
|
478
|
+
inGpu = false; buf = []; continue;
|
|
479
|
+
}
|
|
480
|
+
if (inGpu && line.startsWith('|') && !line.includes('Processes:') &&
|
|
481
|
+
!line.includes('No running') && !line.includes('GPU GI') && !line.includes('GPU GI')) {
|
|
482
|
+
buf.push(line);
|
|
483
|
+
}
|
|
484
|
+
}
|
|
485
|
+
|
|
486
|
+
// Processes
|
|
487
|
+
let noProcs = raw.includes('No running processes found');
|
|
488
|
+
const procs = [];
|
|
489
|
+
if (!noProcs) {
|
|
490
|
+
const procRe = /\|\s+(\d+)\s+\S+\s+\S+\s+(\d+)\s+(\S+)\s+(.*?)\s+(\d+)MiB\s+\|/;
|
|
491
|
+
let inP = false;
|
|
492
|
+
for (const line of lines) {
|
|
493
|
+
if (line.includes('Processes:')) { inP = true; continue; }
|
|
494
|
+
if (inP && /^\|[=]+/.test(line)) continue;
|
|
495
|
+
if (inP && line.startsWith('+')) break;
|
|
496
|
+
if (inP) {
|
|
497
|
+
if (line.includes('No running')) { noProcs = true; break; }
|
|
498
|
+
const m = line.match(procRe);
|
|
499
|
+
if (m) procs.push({ gpu: m[1], pid: m[2], type: m[3], name: m[4].trim(), mem: m[5] });
|
|
500
|
+
}
|
|
501
|
+
}
|
|
502
|
+
}
|
|
503
|
+
|
|
504
|
+
function tempCls(t) { return t >= 85 ? 'hv-crit' : t >= 70 ? 'hv-warn' : 'hv-ok'; }
|
|
505
|
+
function pctCls(v) { return v >= 90 ? 'hv-crit' : v >= 70 ? 'hv-warn' : 'hv-ok'; }
|
|
506
|
+
function powerCls2(d,c) { if (!c) return 'hv-ok'; const r=d/c; return r>=0.95?'hv-crit':r>=0.80?'hv-warn':'hv-ok'; }
|
|
507
|
+
|
|
508
|
+
function memBar(used, total) {
|
|
509
|
+
if (!total) return '';
|
|
510
|
+
const pct = Math.min(Math.round(used/total*100),100);
|
|
511
|
+
const cls = pctCls(pct);
|
|
512
|
+
return `<div class="gpu-health-metric">
|
|
513
|
+
<div class="gpu-health-metric-hdr">
|
|
514
|
+
<span class="gpu-health-lbl">Memory</span>
|
|
515
|
+
<span class="gpu-health-val ${cls}">${pct}%</span>
|
|
516
|
+
</div>
|
|
517
|
+
<div class="hv-gauge-bar gpu-health-bar"><div class="hv-gauge-fill ${cls}" style="width:${pct}%"></div></div>
|
|
518
|
+
<div class="gpu-health-sub">${used} MiB used · ${total} MiB total</div>
|
|
519
|
+
</div>`;
|
|
520
|
+
}
|
|
521
|
+
|
|
522
|
+
function pwrBar(draw, cap) {
|
|
523
|
+
if (!cap) return '';
|
|
524
|
+
const pct = Math.min(Math.round(draw/cap*100),100);
|
|
525
|
+
const cls = powerCls2(draw, cap);
|
|
526
|
+
return `<div class="gpu-health-metric">
|
|
527
|
+
<div class="gpu-health-metric-hdr">
|
|
528
|
+
<span class="gpu-health-lbl">Power</span>
|
|
529
|
+
<span class="gpu-health-val ${cls}">${draw} W / ${cap} W</span>
|
|
530
|
+
</div>
|
|
531
|
+
<div class="hv-gauge-bar gpu-health-bar"><div class="hv-gauge-fill ${cls}" style="width:${pct}%"></div></div>
|
|
532
|
+
</div>`;
|
|
533
|
+
}
|
|
534
|
+
|
|
535
|
+
const gpuCards = gpus.map(g => `
|
|
536
|
+
<div class="gpu-health-card">
|
|
537
|
+
<div class="gpu-health-hdr">
|
|
538
|
+
<span class="gpu-proc-idx">GPU ${h(g.index)}</span>
|
|
539
|
+
<span class="gpu-health-name">${h(g.name)}</span>
|
|
540
|
+
</div>
|
|
541
|
+
<div class="gpu-health-row">
|
|
542
|
+
<div class="gpu-health-cell">
|
|
543
|
+
<span class="gpu-health-lbl">GPU Temp</span>
|
|
544
|
+
<span class="gpu-health-val ${tempCls(g.temp)}">${g.temp}°C</span>
|
|
545
|
+
</div>
|
|
546
|
+
<div class="gpu-health-cell">
|
|
547
|
+
<span class="gpu-health-lbl">Perf</span>
|
|
548
|
+
<span class="gpu-health-val">${h(g.perf)}</span>
|
|
549
|
+
</div>
|
|
550
|
+
<div class="gpu-health-cell">
|
|
551
|
+
<span class="gpu-health-lbl">GPU Util</span>
|
|
552
|
+
<span class="gpu-health-val ${pctCls(g.utilGpu)}">${g.utilGpu}%</span>
|
|
553
|
+
</div>
|
|
554
|
+
<div class="gpu-health-cell">
|
|
555
|
+
<span class="gpu-health-lbl">Fan</span>
|
|
556
|
+
<span class="gpu-health-val">${g.fan !== null ? g.fan + '%' : '—'}</span>
|
|
557
|
+
</div>
|
|
558
|
+
</div>
|
|
559
|
+
${memBar(g.memUsed, g.memTotal)}
|
|
560
|
+
${pwrBar(g.pwrDraw, g.pwrCap)}
|
|
561
|
+
<div class="gpu-info-meta">
|
|
562
|
+
<div class="gpu-info-meta-row">
|
|
563
|
+
<span class="gpu-health-lbl">Bus ID</span>
|
|
564
|
+
<span class="gpu-info-meta-val">${h(g.busId)}</span>
|
|
565
|
+
</div>
|
|
566
|
+
<div class="gpu-info-meta-row">
|
|
567
|
+
<span class="gpu-health-lbl">Persistence</span>
|
|
568
|
+
<span class="gpu-info-meta-val ${g.persistence === 'On' ? 'hv-ok' : ''}">${h(g.persistence)}</span>
|
|
569
|
+
</div>
|
|
570
|
+
<div class="gpu-info-meta-row">
|
|
571
|
+
<span class="gpu-health-lbl">Compute Mode</span>
|
|
572
|
+
<span class="gpu-info-meta-val">${h(g.computeMode)}</span>
|
|
573
|
+
</div>
|
|
574
|
+
${g.migMode ? `<div class="gpu-info-meta-row">
|
|
575
|
+
<span class="gpu-health-lbl">MIG Mode</span>
|
|
576
|
+
<span class="gpu-info-meta-val">${h(g.migMode)}</span>
|
|
577
|
+
</div>` : ''}
|
|
578
|
+
</div>
|
|
579
|
+
</div>`).join('');
|
|
580
|
+
|
|
581
|
+
const procsHtml = noProcs
|
|
582
|
+
? '<div class="gpu-info-no-procs">No running processes.</div>'
|
|
583
|
+
: `<div class="hv-top-table-wrap"><table class="hv-top-table">
|
|
584
|
+
<thead><tr><th>GPU</th><th>PID</th><th>Type</th><th>Process</th><th>GPU Mem</th></tr></thead>
|
|
585
|
+
<tbody>${procs.map(p => `<tr>
|
|
586
|
+
<td><span class="gpu-proc-idx">GPU ${h(p.gpu)}</span></td>
|
|
587
|
+
<td class="gpu-proc-pid">${h(p.pid)}</td>
|
|
588
|
+
<td><span class="gpu-proc-type gpu-proc-type-${h(p.type.toLowerCase())}">${h(p.type)}</span></td>
|
|
589
|
+
<td class="gpu-proc-cmd">${h(p.name)}</td>
|
|
590
|
+
<td class="gpu-proc-mem">${h(p.mem)} MiB</td>
|
|
591
|
+
</tr>`).join('')}</tbody>
|
|
592
|
+
</table></div>`;
|
|
593
|
+
|
|
594
|
+
const wrap = document.createElement('div');
|
|
595
|
+
wrap.className = 'hv-wrap gpu-health-grid';
|
|
596
|
+
wrap.innerHTML = `
|
|
597
|
+
<div class="gpu-info-versions">
|
|
598
|
+
<div class="gpu-info-ver-item"><span class="gpu-health-lbl">NVIDIA-SMI</span><span class="gpu-info-ver-val">${h(smiVer)}</span></div>
|
|
599
|
+
<div class="gpu-info-ver-item"><span class="gpu-health-lbl">Driver</span><span class="gpu-info-ver-val">${h(driverVer)}</span></div>
|
|
600
|
+
<div class="gpu-info-ver-item"><span class="gpu-health-lbl">CUDA</span><span class="gpu-info-ver-val">${h(cudaVer)}</span></div>
|
|
601
|
+
</div>
|
|
602
|
+
${gpuCards}
|
|
603
|
+
<div class="gpu-info-procs-section">
|
|
604
|
+
<div class="gpu-info-procs-title">Processes</div>
|
|
605
|
+
${procsHtml}
|
|
606
|
+
</div>`;
|
|
607
|
+
|
|
608
|
+
container.innerHTML = '';
|
|
609
|
+
container.className = '';
|
|
610
|
+
container.appendChild(wrap);
|
|
611
|
+
}
|
|
612
|
+
|
|
613
|
+
function parseNvidiaSmiGpuBlock(lines) {
|
|
614
|
+
// Line 0: | idx name persistence | bus_id disp_a | ecc |
|
|
615
|
+
// Line 1: | fan tempC perf drawW/capW | usedMiB/totalMiB | util% compute |
|
|
616
|
+
// Line 2: | ... | ... | mig |
|
|
617
|
+
const l0 = lines[0] || '', l1 = lines[1] || '', l2 = lines[2] || '';
|
|
618
|
+
const m0 = l0.match(/\|\s+(\d+)\s+(.*?)\s+(On|Off)\s+\|\s+(\S+)\s+(On|Off)\s+\|\s+(\S+)\s+\|/);
|
|
619
|
+
const m1 = l1.match(/\|\s*(N\/A|\d+)\s+(\d+)C\s+(\S+)\s+(\d+)W\s*\/\s*(\d+)W\s+\|\s+(\d+)MiB\s*\/\s*(\d+)MiB\s+\|\s+(\d+)%\s+(\S+)\s+\|/);
|
|
620
|
+
if (!m0 || !m1) return null;
|
|
621
|
+
const m2 = l2.match(/\|\s*\|\s*\|\s+(\S+)\s+\|/);
|
|
622
|
+
return {
|
|
623
|
+
index: m0[1],
|
|
624
|
+
name: m0[2].trim(),
|
|
625
|
+
persistence: m0[3],
|
|
626
|
+
busId: m0[4],
|
|
627
|
+
dispA: m0[5],
|
|
628
|
+
ecc: m0[6],
|
|
629
|
+
fan: m1[1] === 'N/A' ? null : parseInt(m1[1]),
|
|
630
|
+
temp: parseInt(m1[2]),
|
|
631
|
+
perf: m1[3],
|
|
632
|
+
pwrDraw: parseInt(m1[4]),
|
|
633
|
+
pwrCap: parseInt(m1[5]),
|
|
634
|
+
memUsed: parseInt(m1[6]),
|
|
635
|
+
memTotal: parseInt(m1[7]),
|
|
636
|
+
utilGpu: parseInt(m1[8]),
|
|
637
|
+
computeMode: m1[9],
|
|
638
|
+
migMode: m2?.[1] || null,
|
|
639
|
+
};
|
|
640
|
+
}
|
|
641
|
+
|
|
642
|
+
/* ══════════════════════════════════════════════════════════════════════
|
|
643
|
+
* GPU health — nvidia-smi --query-gpu CSV
|
|
644
|
+
* Columns: index, name, temp.gpu, temp.mem, power.draw, power.limit,
|
|
645
|
+
* util.gpu, util.mem, mem.used, mem.free, mem.total,
|
|
646
|
+
* ecc.corrected, ecc.uncorrected, throttle_reasons
|
|
647
|
+
* ══════════════════════════════════════════════════════════════════════ */
|
|
648
|
+
function renderGpuHealthView(raw, container) {
|
|
649
|
+
const lines = raw.split('\n').map(l => l.trim()).filter(l => l);
|
|
650
|
+
if (!lines.length) { container.textContent = raw; return; }
|
|
651
|
+
|
|
652
|
+
const THROTTLE_REASONS = [
|
|
653
|
+
[0x02, 'App Clock Setting'],
|
|
654
|
+
[0x04, 'SW Power Cap'],
|
|
655
|
+
[0x08, 'HW Slowdown'],
|
|
656
|
+
[0x10, 'Sync Boost'],
|
|
657
|
+
[0x20, 'SW Thermal Slowdown'],
|
|
658
|
+
[0x40, 'HW Thermal Slowdown'],
|
|
659
|
+
[0x80, 'HW Power Brake'],
|
|
660
|
+
[0x100, 'Display Clock Setting'],
|
|
661
|
+
];
|
|
662
|
+
|
|
663
|
+
function pn(s) { const n = parseFloat(s); return isNaN(n) ? null : n; }
|
|
664
|
+
function strip(s, u) { return pn((s || '').replace(u, '')); }
|
|
665
|
+
|
|
666
|
+
const gpus = lines.map(line => {
|
|
667
|
+
const p = line.split(',').map(s => s.trim());
|
|
668
|
+
return {
|
|
669
|
+
index: p[0],
|
|
670
|
+
name: p[1],
|
|
671
|
+
tempGpu: pn(p[2]),
|
|
672
|
+
tempMem: pn(p[3]),
|
|
673
|
+
powerDraw: strip(p[4], ' W'),
|
|
674
|
+
powerLimit: strip(p[5], ' W'),
|
|
675
|
+
utilGpu: strip(p[6], ' %'),
|
|
676
|
+
utilMem: strip(p[7], ' %'),
|
|
677
|
+
memUsed: strip(p[8], ' MiB'),
|
|
678
|
+
memTotal: strip(p[10], ' MiB'),
|
|
679
|
+
eccCorrected: pn(p[11]),
|
|
680
|
+
eccUncorrected: pn(p[12]),
|
|
681
|
+
throttleRaw: (p[13] || '').trim(),
|
|
682
|
+
};
|
|
683
|
+
});
|
|
684
|
+
|
|
685
|
+
function tempCls(t) { return t === null ? '' : t >= 85 ? 'hv-crit' : t >= 70 ? 'hv-warn' : 'hv-ok'; }
|
|
686
|
+
function pctCls(v) { return v === null ? '' : v >= 90 ? 'hv-crit' : v >= 70 ? 'hv-warn' : 'hv-ok'; }
|
|
687
|
+
function powerCls(d,l) { if (d === null || !l) return 'hv-ok'; const r = d/l; return r >= 0.95 ? 'hv-crit' : r >= 0.80 ? 'hv-warn' : 'hv-ok'; }
|
|
688
|
+
|
|
689
|
+
function decodeThrottle(raw) {
|
|
690
|
+
if (!raw || raw === 'N/A') return [];
|
|
691
|
+
const val = parseInt(raw, 16);
|
|
692
|
+
if (isNaN(val) || val === 0 || val === 1) return [];
|
|
693
|
+
return THROTTLE_REASONS.filter(([mask]) => val & mask).map(([, name]) => name);
|
|
694
|
+
}
|
|
695
|
+
|
|
696
|
+
function bar(pct, cls) {
|
|
697
|
+
return `<div class="hv-gauge-bar gpu-health-bar"><div class="hv-gauge-fill ${cls}" style="width:${pct}%"></div></div>`;
|
|
698
|
+
}
|
|
699
|
+
|
|
700
|
+
const wrap = document.createElement('div');
|
|
701
|
+
wrap.className = 'hv-wrap gpu-health-grid';
|
|
702
|
+
|
|
703
|
+
wrap.innerHTML = gpus.map(g => {
|
|
704
|
+
const memPct = (g.memUsed !== null && g.memTotal) ? Math.min(Math.round(g.memUsed / g.memTotal * 100), 100) : null;
|
|
705
|
+
const pwrPct = (g.powerDraw !== null && g.powerLimit) ? Math.min(Math.round(g.powerDraw / g.powerLimit * 100), 100) : null;
|
|
706
|
+
const memCls = pctCls(memPct);
|
|
707
|
+
const pwrCls = powerCls(g.powerDraw, g.powerLimit);
|
|
708
|
+
const throttled = decodeThrottle(g.throttleRaw);
|
|
709
|
+
const eccBad = g.eccUncorrected !== null && g.eccUncorrected > 0;
|
|
710
|
+
const eccWarn = !eccBad && g.eccCorrected !== null && g.eccCorrected > 0;
|
|
711
|
+
|
|
712
|
+
return `
|
|
713
|
+
<div class="gpu-health-card">
|
|
714
|
+
<div class="gpu-health-hdr">
|
|
715
|
+
<span class="gpu-proc-idx">GPU ${h(g.index)}</span>
|
|
716
|
+
<span class="gpu-health-name">${h(g.name)}</span>
|
|
717
|
+
</div>
|
|
718
|
+
|
|
719
|
+
<div class="gpu-health-row">
|
|
720
|
+
<div class="gpu-health-cell">
|
|
721
|
+
<span class="gpu-health-lbl">GPU temp</span>
|
|
722
|
+
<span class="gpu-health-val ${tempCls(g.tempGpu)}">${g.tempGpu !== null ? g.tempGpu + '°C' : '—'}</span>
|
|
723
|
+
</div>
|
|
724
|
+
<div class="gpu-health-cell">
|
|
725
|
+
<span class="gpu-health-lbl">Mem temp</span>
|
|
726
|
+
<span class="gpu-health-val ${tempCls(g.tempMem)}">${g.tempMem !== null ? g.tempMem + '°C' : '—'}</span>
|
|
727
|
+
</div>
|
|
728
|
+
<div class="gpu-health-cell">
|
|
729
|
+
<span class="gpu-health-lbl">GPU util</span>
|
|
730
|
+
<span class="gpu-health-val ${pctCls(g.utilGpu)}">${g.utilGpu !== null ? g.utilGpu + '%' : '—'}</span>
|
|
731
|
+
</div>
|
|
732
|
+
<div class="gpu-health-cell">
|
|
733
|
+
<span class="gpu-health-lbl">Mem util</span>
|
|
734
|
+
<span class="gpu-health-val ${pctCls(g.utilMem)}">${g.utilMem !== null ? g.utilMem + '%' : '—'}</span>
|
|
735
|
+
</div>
|
|
736
|
+
</div>
|
|
737
|
+
|
|
738
|
+
<div class="gpu-health-metric">
|
|
739
|
+
<div class="gpu-health-metric-hdr">
|
|
740
|
+
<span class="gpu-health-lbl">Memory</span>
|
|
741
|
+
<span class="gpu-health-val ${memCls}">${memPct !== null ? memPct + '%' : '—'}</span>
|
|
742
|
+
</div>
|
|
743
|
+
${memPct !== null ? bar(memPct, memCls) : ''}
|
|
744
|
+
<div class="gpu-health-sub">${g.memUsed !== null ? Math.round(g.memUsed) + ' MiB used' : ''} ${g.memTotal ? '· ' + Math.round(g.memTotal) + ' MiB total' : ''}</div>
|
|
745
|
+
</div>
|
|
746
|
+
|
|
747
|
+
<div class="gpu-health-metric">
|
|
748
|
+
<div class="gpu-health-metric-hdr">
|
|
749
|
+
<span class="gpu-health-lbl">Power</span>
|
|
750
|
+
<span class="gpu-health-val ${pwrCls}">${g.powerDraw !== null ? g.powerDraw.toFixed(1) + ' W' : '—'}${g.powerLimit ? ' / ' + g.powerLimit.toFixed(0) + ' W' : ''}</span>
|
|
751
|
+
</div>
|
|
752
|
+
${pwrPct !== null ? bar(pwrPct, pwrCls) : ''}
|
|
753
|
+
</div>
|
|
754
|
+
|
|
755
|
+
<div class="gpu-health-ecc ${eccBad ? 'gpu-health-ecc-bad' : eccWarn ? 'gpu-health-ecc-warn' : 'gpu-health-ecc-ok'}">
|
|
756
|
+
<span class="gpu-health-lbl">ECC errors</span>
|
|
757
|
+
<span class="gpu-health-ecc-vals">
|
|
758
|
+
<span title="Corrected (volatile)">${g.eccCorrected ?? '—'} corrected</span>
|
|
759
|
+
<span class="${eccBad ? 'hv-crit' : ''}" title="Uncorrected (volatile)">${g.eccUncorrected ?? '—'} uncorrected</span>
|
|
760
|
+
</span>
|
|
761
|
+
</div>
|
|
762
|
+
|
|
763
|
+
${throttled.length ? `
|
|
764
|
+
<div class="gpu-health-throttle">
|
|
765
|
+
<span class="gpu-health-lbl gpu-health-throttle-lbl">Clock throttled</span>
|
|
766
|
+
<div class="gpu-health-throttle-tags">${throttled.map(r => `<span class="gpu-health-throttle-tag">${h(r)}</span>`).join('')}</div>
|
|
767
|
+
</div>` : ''}
|
|
768
|
+
</div>`;
|
|
769
|
+
}).join('');
|
|
770
|
+
|
|
771
|
+
container.innerHTML = '';
|
|
772
|
+
container.className = '';
|
|
773
|
+
container.appendChild(wrap);
|
|
774
|
+
}
|
|
775
|
+
|
|
776
|
+
/* ══════════════════════════════════════════════════════════════════════
|
|
777
|
+
* GPU processes — nvidia-smi pmon or --query-compute-apps
|
|
778
|
+
* ══════════════════════════════════════════════════════════════════════ */
|
|
779
|
+
function renderGpuProcessesView(raw, container) {
|
|
780
|
+
const lines = raw.split('\n').map(l => l.trim()).filter(l => l);
|
|
781
|
+
if (!lines.length) { container.textContent = raw; return; }
|
|
782
|
+
|
|
783
|
+
const wrap = document.createElement('div');
|
|
784
|
+
wrap.className = 'hv-wrap';
|
|
785
|
+
|
|
786
|
+
// pmon format: header lines start with '#'
|
|
787
|
+
if (lines[0].startsWith('# gpu')) {
|
|
788
|
+
const dataLines = lines.filter(l => !l.startsWith('#'));
|
|
789
|
+
const active = dataLines.filter(l => {
|
|
790
|
+
const parts = l.split(/\s+/);
|
|
791
|
+
return parts[1] && parts[1] !== '-';
|
|
792
|
+
});
|
|
793
|
+
|
|
794
|
+
if (!active.length) {
|
|
795
|
+
const idleHtml = dataLines.map(l => {
|
|
796
|
+
const parts = l.split(/\s+/);
|
|
797
|
+
return `<div class="gpu-proc-idle-row">
|
|
798
|
+
<span class="gpu-proc-idx">GPU ${h(parts[0] || '?')}</span>
|
|
799
|
+
<span class="gpu-proc-idle-lbl">No active processes</span>
|
|
800
|
+
</div>`;
|
|
801
|
+
}).join('');
|
|
802
|
+
wrap.innerHTML = `<div class="gpu-proc-idle">${idleHtml}</div>`;
|
|
803
|
+
} else {
|
|
804
|
+
function metricCell(v) {
|
|
805
|
+
const n = parseFloat(v);
|
|
806
|
+
const cls = (!isNaN(n) && n > 0)
|
|
807
|
+
? (n >= 80 ? 'hv-crit' : n >= 40 ? 'hv-warn' : 'gpu-proc-active') : '';
|
|
808
|
+
return `<td class="${cls}">${h(v === '-' ? '—' : v + '%')}</td>`;
|
|
809
|
+
}
|
|
810
|
+
const tableRows = active.map(l => {
|
|
811
|
+
const [gpu, pid, type, sm, mem, enc, dec, , , ...cmdParts] = l.split(/\s+/);
|
|
812
|
+
const cmd = cmdParts.join(' ') || '—';
|
|
813
|
+
return `<tr>
|
|
814
|
+
<td><span class="gpu-proc-idx">GPU ${h(gpu)}</span></td>
|
|
815
|
+
<td class="gpu-proc-pid">${h(pid)}</td>
|
|
816
|
+
<td><span class="gpu-proc-type gpu-proc-type-${h((type || '').toLowerCase())}">${h(type || '—')}</span></td>
|
|
817
|
+
${metricCell(sm)} ${metricCell(mem)} ${metricCell(enc)} ${metricCell(dec)}
|
|
818
|
+
<td class="gpu-proc-cmd">${h(cmd)}</td>
|
|
819
|
+
</tr>`;
|
|
820
|
+
}).join('');
|
|
821
|
+
wrap.innerHTML = `
|
|
822
|
+
<div class="hv-top-table-wrap">
|
|
823
|
+
<table class="hv-top-table">
|
|
824
|
+
<thead><tr>
|
|
825
|
+
<th>GPU</th><th>PID</th><th>Type</th>
|
|
826
|
+
<th>SM %</th><th>Mem %</th><th>Enc %</th><th>Dec %</th>
|
|
827
|
+
<th>Process</th>
|
|
828
|
+
</tr></thead>
|
|
829
|
+
<tbody>${tableRows}</tbody>
|
|
830
|
+
</table>
|
|
831
|
+
</div>`;
|
|
832
|
+
}
|
|
833
|
+
|
|
834
|
+
} else {
|
|
835
|
+
// --query-compute-apps CSV: pid, used_gpu_memory, name
|
|
836
|
+
const rows = lines
|
|
837
|
+
.map(l => { const p = l.split(',').map(s => s.trim()); return { pid: p[0], mem: p[1], name: p[2] }; })
|
|
838
|
+
.filter(r => r.pid && r.pid !== '-');
|
|
839
|
+
|
|
840
|
+
if (!rows.length) {
|
|
841
|
+
wrap.innerHTML = '<div class="gpu-proc-idle"><div class="gpu-proc-idle-row"><span class="gpu-proc-idle-lbl">No GPU compute processes running.</span></div></div>';
|
|
842
|
+
} else {
|
|
843
|
+
const tableRows = rows.map(r => `<tr>
|
|
844
|
+
<td class="gpu-proc-pid">${h(r.pid)}</td>
|
|
845
|
+
<td class="gpu-proc-mem">${h(r.mem)}</td>
|
|
846
|
+
<td class="gpu-proc-cmd">${h(r.name)}</td>
|
|
847
|
+
</tr>`).join('');
|
|
848
|
+
wrap.innerHTML = `
|
|
849
|
+
<div class="hv-top-table-wrap">
|
|
850
|
+
<table class="hv-top-table">
|
|
851
|
+
<thead><tr><th>PID</th><th>GPU Memory</th><th>Process</th></tr></thead>
|
|
852
|
+
<tbody>${tableRows}</tbody>
|
|
853
|
+
</table>
|
|
854
|
+
</div>`;
|
|
855
|
+
}
|
|
856
|
+
}
|
|
857
|
+
|
|
858
|
+
container.innerHTML = '';
|
|
859
|
+
container.className = '';
|
|
860
|
+
container.appendChild(wrap);
|
|
861
|
+
}
|
|
862
|
+
|
|
454
863
|
/* ── Exports ─────────────────────────────────────────────────────────── */
|
|
455
864
|
window.renderMemInfoView = renderMemInfoView;
|
|
456
865
|
window.renderMemPressureView = renderMemPressureView;
|
|
@@ -458,5 +867,8 @@
|
|
|
458
867
|
window.renderKubeletLogsView = renderKubeletLogsView;
|
|
459
868
|
window.renderDiskView = renderDiskView;
|
|
460
869
|
window.renderCpuView = renderCpuView;
|
|
870
|
+
window.renderGpuInfoView = renderGpuInfoView;
|
|
871
|
+
window.renderGpuHealthView = renderGpuHealthView;
|
|
872
|
+
window.renderGpuProcessesView = renderGpuProcessesView;
|
|
461
873
|
|
|
462
874
|
})();
|
package/public/style.css
CHANGED
|
@@ -864,3 +864,53 @@ kbd {
|
|
|
864
864
|
.conn-empty { color: var(--fg-dim); font-style: italic; font-size: 13px; padding: 6px 0; }
|
|
865
865
|
.conn-loading { color: var(--accent); font-size: 14px; padding: 20px; text-align: center; }
|
|
866
866
|
.conn-error { color: var(--err); font-size: 13px; padding: 10px; }
|
|
867
|
+
|
|
868
|
+
/* ── GPU info view (nvidia-smi table) ──────────────────────────────────── */
|
|
869
|
+
.gpu-info-versions { display: flex; gap: 24px; padding: 12px 16px; background: var(--bg-2); border: 1px solid var(--border); border-radius: 8px; flex-wrap: wrap; }
|
|
870
|
+
.gpu-info-ver-item { display: flex; flex-direction: column; gap: 3px; }
|
|
871
|
+
.gpu-info-ver-val { font-family: var(--mono); font-size: 14px; font-weight: 600; color: var(--accent); }
|
|
872
|
+
.gpu-info-meta { display: grid; grid-template-columns: repeat(auto-fill, minmax(160px, 1fr)); gap: 8px; padding: 10px 12px; background: var(--bg-3); border-radius: 6px; border: 1px solid var(--border); }
|
|
873
|
+
.gpu-info-meta-row { display: flex; flex-direction: column; gap: 3px; }
|
|
874
|
+
.gpu-info-meta-val { font-family: var(--mono); font-size: 12px; color: var(--fg); }
|
|
875
|
+
.gpu-info-procs-section { display: flex; flex-direction: column; gap: 8px; }
|
|
876
|
+
.gpu-info-procs-title { font-size: 11px; font-weight: 600; text-transform: uppercase; letter-spacing: .08em; color: var(--fg-dim); }
|
|
877
|
+
.gpu-info-no-procs { font-size: 13px; color: var(--fg-dim); padding: 10px 14px; background: var(--bg-2); border: 1px solid var(--border); border-radius: 6px; }
|
|
878
|
+
|
|
879
|
+
/* ── GPU health view ────────────────────────────────────────────────────── */
|
|
880
|
+
.gpu-health-grid { display: flex; flex-direction: column; gap: 16px; }
|
|
881
|
+
.gpu-health-card { background: var(--bg-2); border: 1px solid var(--border); border-radius: 10px; padding: 18px 20px; display: flex; flex-direction: column; gap: 14px; }
|
|
882
|
+
.gpu-health-hdr { display: flex; align-items: center; gap: 10px; }
|
|
883
|
+
.gpu-health-name { font-size: 14px; font-weight: 600; color: var(--fg); }
|
|
884
|
+
.gpu-health-row { display: flex; gap: 0; flex-wrap: wrap; background: var(--bg-3); border-radius: 7px; overflow: hidden; border: 1px solid var(--border); }
|
|
885
|
+
.gpu-health-cell { flex: 1; min-width: 80px; display: flex; flex-direction: column; align-items: center; padding: 10px 8px; gap: 4px; border-right: 1px solid var(--border); }
|
|
886
|
+
.gpu-health-cell:last-child { border-right: none; }
|
|
887
|
+
.gpu-health-lbl { font-size: 10px; font-weight: 600; text-transform: uppercase; letter-spacing: .06em; color: var(--fg-dim); }
|
|
888
|
+
.gpu-health-val { font-size: 18px; font-weight: 700; font-family: var(--mono); }
|
|
889
|
+
.gpu-health-metric { display: flex; flex-direction: column; gap: 5px; }
|
|
890
|
+
.gpu-health-metric-hdr { display: flex; justify-content: space-between; align-items: baseline; }
|
|
891
|
+
.gpu-health-metric .gpu-health-lbl { font-size: 11px; }
|
|
892
|
+
.gpu-health-metric .gpu-health-val { font-size: 14px; }
|
|
893
|
+
.gpu-health-bar { height: 8px; }
|
|
894
|
+
.gpu-health-sub { font-size: 11px; color: var(--fg-dim); font-family: var(--mono); }
|
|
895
|
+
.gpu-health-ecc { display: flex; align-items: center; justify-content: space-between; padding: 8px 10px; border-radius: 6px; font-size: 12px; }
|
|
896
|
+
.gpu-health-ecc-ok { background: #0d2b16; border: 1px solid #1e5c3a; }
|
|
897
|
+
.gpu-health-ecc-warn { background: #2b2000; border: 1px solid #5a4500; }
|
|
898
|
+
.gpu-health-ecc-bad { background: #2b0d0d; border: 1px solid #5c2020; }
|
|
899
|
+
.gpu-health-ecc-vals { display: flex; gap: 14px; font-family: var(--mono); color: var(--fg-dim); }
|
|
900
|
+
.gpu-health-throttle { display: flex; flex-direction: column; gap: 6px; padding: 8px 10px; background: #2b2000; border: 1px solid #5a4500; border-radius: 6px; }
|
|
901
|
+
.gpu-health-throttle-lbl { color: #d29922; }
|
|
902
|
+
.gpu-health-throttle-tags { display: flex; gap: 6px; flex-wrap: wrap; }
|
|
903
|
+
.gpu-health-throttle-tag { padding: 2px 8px; background: #3d2e00; border: 1px solid #5a4500; border-radius: 4px; font-size: 11px; color: #d29922; font-family: var(--mono); }
|
|
904
|
+
|
|
905
|
+
/* ── GPU processes view ─────────────────────────────────────────────────── */
|
|
906
|
+
.gpu-proc-idle { display: flex; flex-direction: column; gap: 8px; }
|
|
907
|
+
.gpu-proc-idle-row { display: flex; align-items: center; gap: 12px; padding: 10px 14px; background: var(--bg-2); border: 1px solid var(--border); border-radius: 8px; }
|
|
908
|
+
.gpu-proc-idle-lbl { font-size: 13px; color: var(--fg-dim); }
|
|
909
|
+
.gpu-proc-idx { display: inline-block; padding: 2px 8px; border-radius: 5px; font-size: 11px; font-weight: 700; font-family: var(--mono); background: #0d1f3c; color: var(--accent); border: 1px solid #1e3a6e; }
|
|
910
|
+
.gpu-proc-pid { font-family: var(--mono); font-size: 12px; color: var(--fg-dim); }
|
|
911
|
+
.gpu-proc-mem { font-family: var(--mono); font-size: 12px; }
|
|
912
|
+
.gpu-proc-type { display: inline-block; padding: 1px 6px; border-radius: 4px; font-size: 11px; font-weight: 600; font-family: var(--mono); background: var(--bg-3); color: var(--fg-dim); border: 1px solid var(--border); }
|
|
913
|
+
.gpu-proc-type-c { background: #0d2b16; color: #3fb950; border-color: #1e5c3a; }
|
|
914
|
+
.gpu-proc-type-g { background: #0d1f3c; color: var(--accent); border-color: #1e3a6e; }
|
|
915
|
+
.gpu-proc-cmd { color: var(--fg-dim); font-size: 12px; font-family: var(--mono); }
|
|
916
|
+
.gpu-proc-active { color: var(--ok); font-family: var(--mono); }
|
package/src/probes.js
CHANGED
|
@@ -229,6 +229,7 @@ const PROBES = [
|
|
|
229
229
|
commands: [
|
|
230
230
|
'nvidia-smi',
|
|
231
231
|
'nsenter --mount=/proc/1/ns/mnt -- nvidia-smi 2>/dev/null',
|
|
232
|
+
'echo "nvidia-smi not available — no GPU detected on this node."',
|
|
232
233
|
],
|
|
233
234
|
},
|
|
234
235
|
{
|
|
@@ -238,16 +239,21 @@ const PROBES = [
|
|
|
238
239
|
desc: 'Processes currently consuming GPU memory.',
|
|
239
240
|
commands: [
|
|
240
241
|
'nvidia-smi --query-compute-apps=pid,used_gpu_memory,name --format=csv,noheader 2>/dev/null | sort -t, -k2 -rn | head -30',
|
|
242
|
+
'nsenter --mount=/proc/1/ns/mnt -- nvidia-smi --query-compute-apps=pid,used_gpu_memory,name --format=csv,noheader | sort -t, -k2 -rn | head -30',
|
|
241
243
|
'nvidia-smi pmon -s u -c 1 2>/dev/null',
|
|
244
|
+
'nsenter --mount=/proc/1/ns/mnt -- nvidia-smi pmon -s u -c 1',
|
|
245
|
+
'echo "nvidia-smi not available — no GPU detected on this node."',
|
|
242
246
|
],
|
|
243
247
|
},
|
|
244
248
|
{
|
|
245
|
-
id: 'gpu-
|
|
246
|
-
label: '
|
|
249
|
+
id: 'gpu-health',
|
|
250
|
+
label: 'GPU health',
|
|
247
251
|
group: 'GPU',
|
|
248
|
-
desc: '
|
|
252
|
+
desc: 'Per-GPU temperature, power, utilization, memory, ECC errors, and clock throttle reasons.',
|
|
249
253
|
commands: [
|
|
250
|
-
'
|
|
254
|
+
'nvidia-smi --query-gpu=index,name,temperature.gpu,temperature.memory,power.draw,power.limit,utilization.gpu,utilization.memory,memory.used,memory.free,memory.total,ecc.errors.corrected.volatile.total,ecc.errors.uncorrected.volatile.total,clocks_throttle_reasons.active --format=csv,noheader 2>/dev/null',
|
|
255
|
+
'nsenter --mount=/proc/1/ns/mnt -- nvidia-smi --query-gpu=index,name,temperature.gpu,temperature.memory,power.draw,power.limit,utilization.gpu,utilization.memory,memory.used,memory.free,memory.total,ecc.errors.corrected.volatile.total,ecc.errors.uncorrected.volatile.total,clocks_throttle_reasons.active --format=csv,noheader',
|
|
256
|
+
'echo "nvidia-smi not available — no GPU detected on this node."',
|
|
251
257
|
],
|
|
252
258
|
},
|
|
253
259
|
];
|