@gluip/chart-canvas-mcp 0.1.4 → 0.1.5
This diff represents the content of publicly available package versions that have been released to one of the supported registries. The information contained in this diff is provided for informational purposes only and reflects changes between package versions as they appear in their respective public registries.
- package/LICENSE +21 -0
- package/README.md +174 -0
- package/package.json +2 -1
package/LICENSE
ADDED
|
@@ -0,0 +1,21 @@
|
|
|
1
|
+
MIT License
|
|
2
|
+
|
|
3
|
+
Copyright (c) 2026 Martijn
|
|
4
|
+
|
|
5
|
+
Permission is hereby granted, free of charge, to any person obtaining a copy
|
|
6
|
+
of this software and associated documentation files (the "Software"), to deal
|
|
7
|
+
in the Software without restriction, including without limitation the rights
|
|
8
|
+
to use, copy, modify, merge, publish, distribute, sublicense, and/or sell
|
|
9
|
+
copies of the Software, and to permit persons to whom the Software is
|
|
10
|
+
furnished to do so, subject to the following conditions:
|
|
11
|
+
|
|
12
|
+
The above copyright notice and this permission notice shall be included in all
|
|
13
|
+
copies or substantial portions of the Software.
|
|
14
|
+
|
|
15
|
+
THE SOFTWARE IS PROVIDED "AS IS", WITHOUT WARRANTY OF ANY KIND, EXPRESS OR
|
|
16
|
+
IMPLIED, INCLUDING BUT NOT LIMITED TO THE WARRANTIES OF MERCHANTABILITY,
|
|
17
|
+
FITNESS FOR A PARTICULAR PURPOSE AND NONINFRINGEMENT. IN NO EVENT SHALL THE
|
|
18
|
+
AUTHORS OR COPYRIGHT HOLDERS BE LIABLE FOR ANY CLAIM, DAMAGES OR OTHER
|
|
19
|
+
LIABILITY, WHETHER IN AN ACTION OF CONTRACT, TORT OR OTHERWISE, ARISING FROM,
|
|
20
|
+
OUT OF OR IN CONNECTION WITH THE SOFTWARE OR THE USE OR OTHER DEALINGS IN THE
|
|
21
|
+
SOFTWARE.
|
package/README.md
ADDED
|
@@ -0,0 +1,174 @@
|
|
|
1
|
+
# Chart Canvas MCP Server
|
|
2
|
+
|
|
3
|
+
> Interactive visualization dashboard for AI assistants via Model Context Protocol
|
|
4
|
+
|
|
5
|
+
Create beautiful charts, diagrams, and tables directly from your AI conversations. Chart Canvas provides a real-time dashboard that displays visualizations as you work with LLMs like Claude.
|
|
6
|
+
|
|
7
|
+
## Demo
|
|
8
|
+
|
|
9
|
+
[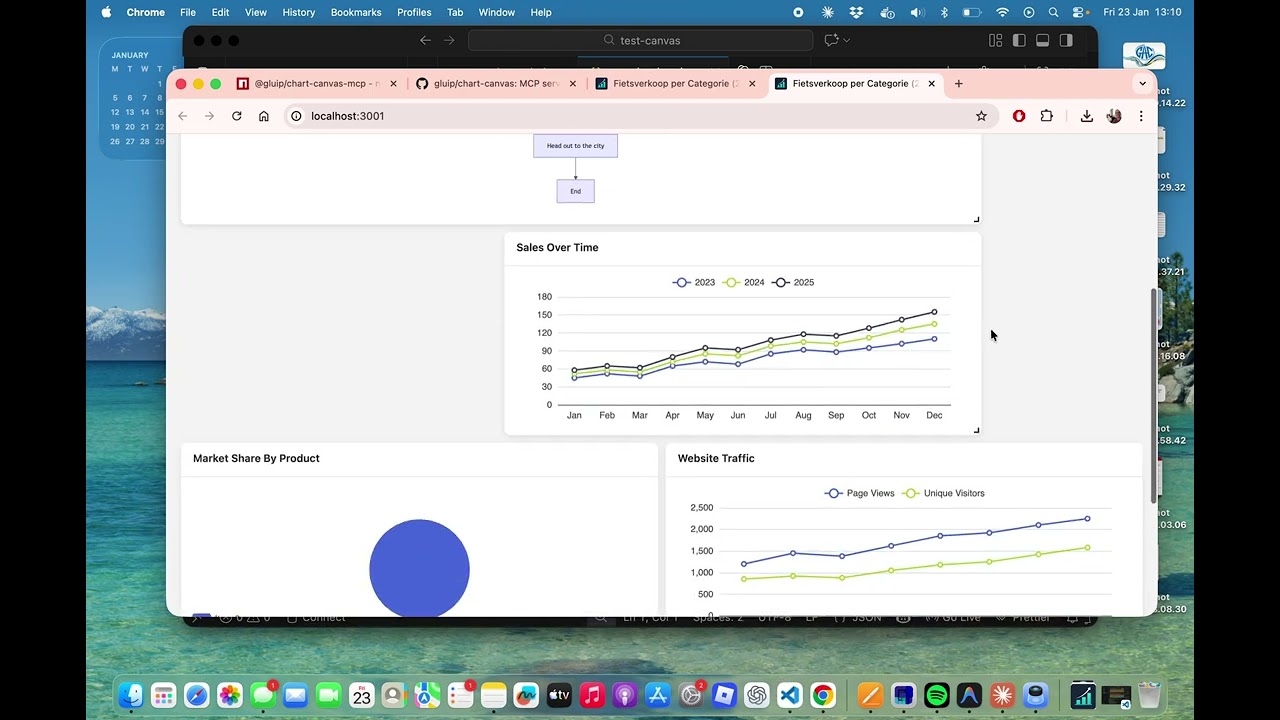](https://www.youtube.com/watch?v=XVucQstPisc)
|
|
10
|
+
|
|
11
|
+
Watch the [full demo on YouTube](https://www.youtube.com/watch?v=XVucQstPisc) to see Chart Canvas in action!
|
|
12
|
+
|
|
13
|
+
## Features
|
|
14
|
+
|
|
15
|
+
✨ **Multiple Chart Types**: Line, bar, scatter, pie charts, tables, and Mermaid diagrams
|
|
16
|
+
🎨 **Interactive Dashboard**: Drag-and-drop grid layout with real-time updates
|
|
17
|
+
🔄 **Live Synchronization**: Changes appear instantly in your browser
|
|
18
|
+
📊 **Rich Visualizations**: Powered by ECharts and Mermaid
|
|
19
|
+
🚀 **Easy Setup**: One command to get started
|
|
20
|
+
🌐 **Production Ready**: Built-in production mode with optimized builds
|
|
21
|
+
|
|
22
|
+
## Quick Start
|
|
23
|
+
|
|
24
|
+
### Installation
|
|
25
|
+
|
|
26
|
+
```bash
|
|
27
|
+
npm install -g @gluip/chart-canvas-mcp
|
|
28
|
+
```
|
|
29
|
+
|
|
30
|
+
Or use directly with npx (no installation needed):
|
|
31
|
+
|
|
32
|
+
```bash
|
|
33
|
+
npx @gluip/chart-canvas-mcp
|
|
34
|
+
```
|
|
35
|
+
|
|
36
|
+
### Configuration
|
|
37
|
+
|
|
38
|
+
Add to your MCP client configuration (e.g., Claude Desktop):
|
|
39
|
+
|
|
40
|
+
**macOS**: `~/Library/Application Support/Claude/claude_desktop_config.json`
|
|
41
|
+
**Windows**: `%APPDATA%/Claude/claude_desktop_config.json`
|
|
42
|
+
|
|
43
|
+
```json
|
|
44
|
+
{
|
|
45
|
+
"mcpServers": {
|
|
46
|
+
"chart-canvas": {
|
|
47
|
+
"command": "npx",
|
|
48
|
+
"args": ["-y", "@gluip/chart-canvas-mcp"]
|
|
49
|
+
}
|
|
50
|
+
}
|
|
51
|
+
}
|
|
52
|
+
```
|
|
53
|
+
|
|
54
|
+
### Usage
|
|
55
|
+
|
|
56
|
+
1. Start your MCP client (e.g., Claude Desktop)
|
|
57
|
+
2. The server will automatically start on port 3000
|
|
58
|
+
3. Use the `showCanvas` tool to open the dashboard in your browser
|
|
59
|
+
4. Ask the AI to create visualizations!
|
|
60
|
+
|
|
61
|
+
## Example Prompts
|
|
62
|
+
|
|
63
|
+
```
|
|
64
|
+
"Show me a line chart comparing sales data for 2023 and 2024"
|
|
65
|
+
|
|
66
|
+
"Create a pie chart showing market share by region"
|
|
67
|
+
|
|
68
|
+
"Draw a flowchart for the user authentication process"
|
|
69
|
+
|
|
70
|
+
"Make a table with team member information"
|
|
71
|
+
```
|
|
72
|
+
|
|
73
|
+
## MCP Tools
|
|
74
|
+
|
|
75
|
+
### addVisualization
|
|
76
|
+
|
|
77
|
+
Create charts, diagrams, and tables on the canvas.
|
|
78
|
+
|
|
79
|
+
**Supported Types**:
|
|
80
|
+
- `line` - Line charts with multiple series
|
|
81
|
+
- `bar` - Bar charts for comparisons
|
|
82
|
+
- `scatter` - Scatter plots for data distribution
|
|
83
|
+
- `pie` - Pie charts with labels
|
|
84
|
+
- `table` - Data tables with headers
|
|
85
|
+
- `flowchart` - Mermaid diagrams (flowcharts, sequence diagrams, Gantt charts, etc.)
|
|
86
|
+
|
|
87
|
+
**Example**:
|
|
88
|
+
```typescript
|
|
89
|
+
{
|
|
90
|
+
type: "line",
|
|
91
|
+
title: "Monthly Sales",
|
|
92
|
+
series: [
|
|
93
|
+
{ name: "2023", data: [[1, 120], [2, 132], [3, 101]] },
|
|
94
|
+
{ name: "2024", data: [[1, 220], [2, 182], [3, 191]] }
|
|
95
|
+
],
|
|
96
|
+
xLabels: ["Jan", "Feb", "Mar"]
|
|
97
|
+
}
|
|
98
|
+
```
|
|
99
|
+
|
|
100
|
+
### removeVisualization
|
|
101
|
+
|
|
102
|
+
Remove a specific visualization by ID.
|
|
103
|
+
|
|
104
|
+
### clearCanvas
|
|
105
|
+
|
|
106
|
+
Remove all visualizations from the canvas.
|
|
107
|
+
|
|
108
|
+
### showCanvas
|
|
109
|
+
|
|
110
|
+
Open the dashboard in your default browser.
|
|
111
|
+
|
|
112
|
+
## Architecture
|
|
113
|
+
|
|
114
|
+
- **Backend**: Node.js + TypeScript + Express + MCP SDK
|
|
115
|
+
- **Frontend**: Vue 3 + ECharts + Mermaid + Grid Layout
|
|
116
|
+
- **Communication**: Real-time polling for instant updates
|
|
117
|
+
|
|
118
|
+
## Development
|
|
119
|
+
|
|
120
|
+
### Local Development
|
|
121
|
+
|
|
122
|
+
```bash
|
|
123
|
+
# Clone repository
|
|
124
|
+
git clone https://github.com/gluip/chart-canvas.git
|
|
125
|
+
cd chart-canvas
|
|
126
|
+
|
|
127
|
+
# Install backend dependencies
|
|
128
|
+
cd backend
|
|
129
|
+
npm install
|
|
130
|
+
|
|
131
|
+
# Install frontend dependencies
|
|
132
|
+
cd ../frontend
|
|
133
|
+
npm install
|
|
134
|
+
|
|
135
|
+
# Development mode (backend + frontend separate)
|
|
136
|
+
# Terminal 1 - Backend
|
|
137
|
+
cd backend
|
|
138
|
+
npm run dev
|
|
139
|
+
|
|
140
|
+
# Terminal 2 - Frontend
|
|
141
|
+
cd frontend
|
|
142
|
+
npm run dev
|
|
143
|
+
|
|
144
|
+
# Production mode (single server)
|
|
145
|
+
cd backend
|
|
146
|
+
npm run build:all
|
|
147
|
+
npm run start:prod
|
|
148
|
+
```
|
|
149
|
+
|
|
150
|
+
### MCP Configuration for Local Development
|
|
151
|
+
|
|
152
|
+
```json
|
|
153
|
+
{
|
|
154
|
+
"mcpServers": {
|
|
155
|
+
"chart-canvas": {
|
|
156
|
+
"command": "/path/to/node",
|
|
157
|
+
"args": [
|
|
158
|
+
"/path/to/chart-canvas/backend/node_modules/.bin/tsx",
|
|
159
|
+
"/path/to/chart-canvas/backend/src/index.ts"
|
|
160
|
+
]
|
|
161
|
+
}
|
|
162
|
+
}
|
|
163
|
+
}
|
|
164
|
+
```
|
|
165
|
+
|
|
166
|
+
## License
|
|
167
|
+
|
|
168
|
+
MIT © 2026 Martijn
|
|
169
|
+
|
|
170
|
+
## Links
|
|
171
|
+
|
|
172
|
+
- [NPM Package](https://www.npmjs.com/package/@gluip/chart-canvas-mcp)
|
|
173
|
+
- [GitHub Repository](https://github.com/gluip/chart-canvas)
|
|
174
|
+
- [Model Context Protocol](https://modelcontextprotocol.io)
|
package/package.json
CHANGED
|
@@ -1,6 +1,6 @@
|
|
|
1
1
|
{
|
|
2
2
|
"name": "@gluip/chart-canvas-mcp",
|
|
3
|
-
"version": "0.1.
|
|
3
|
+
"version": "0.1.5",
|
|
4
4
|
"description": "MCP server for creating interactive visualizations (charts, diagrams, tables) through AI assistants",
|
|
5
5
|
"author": "Martijn",
|
|
6
6
|
"license": "MIT",
|
|
@@ -31,6 +31,7 @@
|
|
|
31
31
|
"scripts": {
|
|
32
32
|
"build": "tsc",
|
|
33
33
|
"build:all": "npm run build && cd ../frontend && npm run build",
|
|
34
|
+
"prepublishOnly": "cp ../README.md . && cp ../LICENSE .",
|
|
34
35
|
"dev": "tsx src/index.ts",
|
|
35
36
|
"dev:api": "tsx src/api-server.ts",
|
|
36
37
|
"start": "node dist/index.js",
|