@extend-ai/react-pptx 0.2.1 → 0.2.3
This diff represents the content of publicly available package versions that have been released to one of the supported registries. The information contained in this diff is provided for informational purposes only and reflects changes between package versions as they appear in their respective public registries.
- package/CHANGELOG.md +14 -0
- package/README.md +10 -0
- package/THIRD_PARTY_LICENSES/extend-office.txt +21 -0
- package/THIRD_PARTY_NOTICES.md +7 -4
- package/dist/index.d.ts +2 -0
- package/dist/index.js +67 -6
- package/dist/index.js.map +1 -1
- package/dist/pptx_wasm_bg.wasm +0 -0
- package/package.json +3 -3
package/CHANGELOG.md
CHANGED
|
@@ -1,5 +1,19 @@
|
|
|
1
1
|
# @extend-ai/react-pptx
|
|
2
2
|
|
|
3
|
+
## 0.2.3
|
|
4
|
+
|
|
5
|
+
- Use the Rust Office crates by Extend and refresh the bundled WebAssembly.
|
|
6
|
+
|
|
7
|
+
## 0.2.2
|
|
8
|
+
|
|
9
|
+
### Patch Changes
|
|
10
|
+
|
|
11
|
+
- f4cb3b0: Fix paragraph styling in placeholders and render PowerPoint's default table style.
|
|
12
|
+
|
|
13
|
+
- Slide paragraphs no longer take their `lvl`/`marL` from the layout placeholder's prompt paragraphs ("Click to edit Master text styles", "Second level", …). They inherit only through `a:lstStyle`, which stops plain bullet lists from stair-stepping.
|
|
14
|
+
- A placeholder without a `type` (e.g. `<p:ph idx="1"/>`) defaults to `obj` per ECMA-376 and now uses the master's `bodyStyle` instead of `otherStyle`, restoring its bullets, indents and size.
|
|
15
|
+
- When `ppt/tableStyles.xml` doesn't define the requested style, the built-in "Medium Style 2 - Accent 1" (`{5C22544A-7EE6-4342-B048-85BDC9FD1C3A}`, PowerPoint's default) is used, so its fills, banding and borders render.
|
|
16
|
+
|
|
3
17
|
## 0.2.1
|
|
4
18
|
|
|
5
19
|
### Patch Changes
|
package/README.md
CHANGED
|
@@ -118,6 +118,16 @@ the parser worker. A `Response` is supported on the main thread because it canno
|
|
|
118
118
|
reliably to a worker. `initWasm()` optionally accepts the same source when eager initialization
|
|
119
119
|
is useful.
|
|
120
120
|
|
|
121
|
+
## Examples
|
|
122
|
+
|
|
123
|
+
See `@extend-ai/react-pptx` in action in these live [Extend UI](https://www.extend.ai/ui) examples. Click a screenshot to open the demo and integration docs.
|
|
124
|
+
|
|
125
|
+
### [PowerPoint Viewer](https://www.extend.ai/ui/docs/components/pptx-viewer)
|
|
126
|
+
|
|
127
|
+
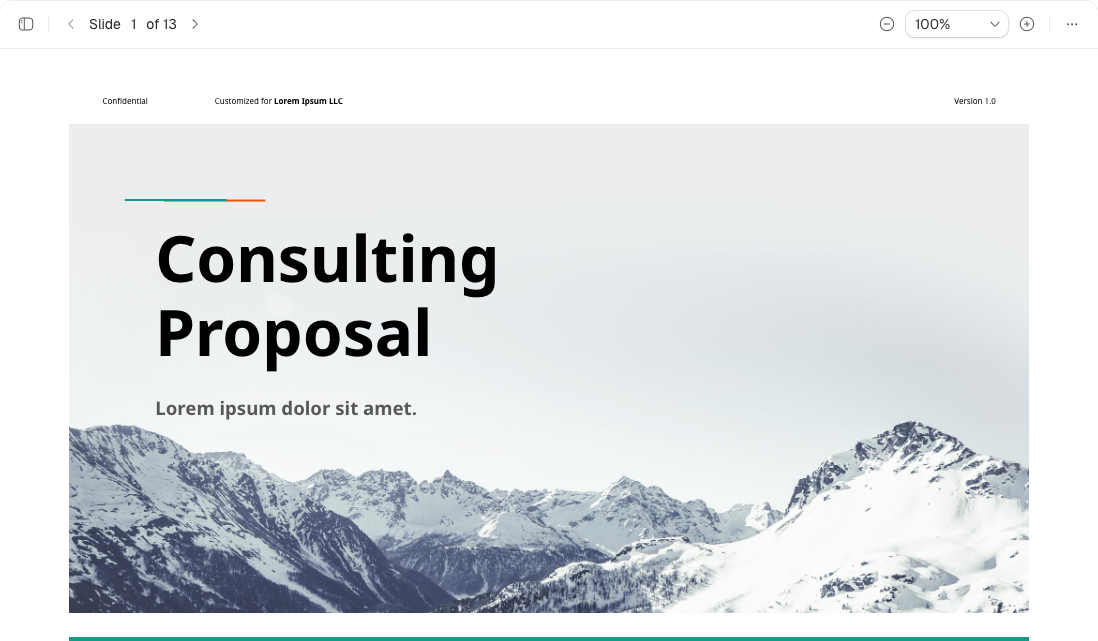
Explore slide navigation, zoom, and presentation previews.
|
|
128
|
+
|
|
129
|
+
[](https://www.extend.ai/ui/docs/components/pptx-viewer)
|
|
130
|
+
|
|
121
131
|
## Fonts
|
|
122
132
|
|
|
123
133
|
Fonts embedded in a `.pptx` are decoded by the Rust parser and registered before the first
|
|
@@ -0,0 +1,21 @@
|
|
|
1
|
+
MIT License
|
|
2
|
+
|
|
3
|
+
Copyright (c) 2026 CrowdView Inc, dba Extend
|
|
4
|
+
|
|
5
|
+
Permission is hereby granted, free of charge, to any person obtaining a copy
|
|
6
|
+
of this software and associated documentation files (the "Software"), to deal
|
|
7
|
+
in the Software without restriction, including without limitation the rights
|
|
8
|
+
to use, copy, modify, merge, publish, distribute, sublicense, and/or sell
|
|
9
|
+
copies of the Software, and to permit persons to whom the Software is
|
|
10
|
+
furnished to do so, subject to the following conditions:
|
|
11
|
+
|
|
12
|
+
The above copyright notice and this permission notice shall be included in all
|
|
13
|
+
copies or substantial portions of the Software.
|
|
14
|
+
|
|
15
|
+
THE SOFTWARE IS PROVIDED "AS IS", WITHOUT WARRANTY OF ANY KIND, EXPRESS OR
|
|
16
|
+
IMPLIED, INCLUDING BUT NOT LIMITED TO THE WARRANTIES OF MERCHANTABILITY,
|
|
17
|
+
FITNESS FOR A PARTICULAR PURPOSE AND NONINFRINGEMENT. IN NO EVENT SHALL THE
|
|
18
|
+
AUTHORS OR COPYRIGHT HOLDERS BE LIABLE FOR ANY CLAIM, DAMAGES OR OTHER
|
|
19
|
+
LIABILITY, WHETHER IN AN ACTION OF CONTRACT, TORT OR OTHERWISE, ARISING FROM,
|
|
20
|
+
OUT OF OR IN CONNECTION WITH THE SOFTWARE OR THE USE OR OTHER DEALINGS IN THE
|
|
21
|
+
SOFTWARE.
|
package/THIRD_PARTY_NOTICES.md
CHANGED
|
@@ -1,10 +1,13 @@
|
|
|
1
1
|
# Third-party notices
|
|
2
2
|
|
|
3
|
-
##
|
|
3
|
+
## PowerPoint parsing and chart rendering
|
|
4
4
|
|
|
5
|
-
The
|
|
6
|
-
[
|
|
7
|
-
|
|
5
|
+
The browser runtime bundles the PowerPoint parser and chart renderer from
|
|
6
|
+
[rust-office](https://github.com/extend-hq/rust-office). Its MIT license
|
|
7
|
+
is included in the published package at `THIRD_PARTY_LICENSES/rust-office.txt`.
|
|
8
|
+
|
|
9
|
+
The React chart renderer and chart model builder used for fallback rendering
|
|
10
|
+
are vendored from [`@extend-ai/react-xlsx`](https://github.com/extend-hq/react-xlsx) (MIT).
|
|
8
11
|
|
|
9
12
|
The chart libraries `d3-scale`, `d3-shape`, `d3-hierarchy`, `d3-geo` (ISC,
|
|
10
13
|
Copyright Mike Bostock), `topojson-client` (ISC), and
|
package/dist/index.d.ts
CHANGED
|
@@ -273,6 +273,8 @@ interface ChartNode extends BaseSlideNode {
|
|
|
273
273
|
* fields above remain available for search and fallbacks.
|
|
274
274
|
*/
|
|
275
275
|
chartXml?: string;
|
|
276
|
+
/** Chart artwork at the dimensions of the slide frame. */
|
|
277
|
+
chartSvg?: string;
|
|
276
278
|
/** Companion Microsoft chart style part (`style*.xml`), when present. */
|
|
277
279
|
chartStyleXml?: string;
|
|
278
280
|
/** Companion Microsoft chart color style part (`colors*.xml`), when present. */
|
package/dist/index.js
CHANGED
|
@@ -278,11 +278,11 @@ var PptxFontManager = class {
|
|
|
278
278
|
this.options.onFontsReady?.();
|
|
279
279
|
}
|
|
280
280
|
applyTo(root, slideIndex) {
|
|
281
|
-
const
|
|
281
|
+
const elements2 = [
|
|
282
282
|
root,
|
|
283
283
|
...root.querySelectorAll('[style*="font-family"], [font-family]')
|
|
284
284
|
];
|
|
285
|
-
for (const element of
|
|
285
|
+
for (const element of elements2) {
|
|
286
286
|
const raw = (element instanceof HTMLElement || element instanceof SVGElement ? element.style.fontFamily : "") || element.getAttribute("font-family");
|
|
287
287
|
if (!raw) continue;
|
|
288
288
|
const primary = parseFamilyList(raw)[0];
|
|
@@ -8457,6 +8457,64 @@ var MemoChartSvg = React2.memo(function MemoChartSvg2({
|
|
|
8457
8457
|
);
|
|
8458
8458
|
}, (prev, next) => prev.chart === next.chart && prev.onChartElementDoubleClick === next.onChartElementDoubleClick && prev.onChartElementPointerDown === next.onChartElementPointerDown && prev.palette === next.palette && prev.rect.height === next.rect.height && prev.rect.width === next.rect.width && prev.rect.left === next.rect.left && prev.rect.top === next.rect.top && prev.selectedChartElement === next.selectedChartElement);
|
|
8459
8459
|
|
|
8460
|
+
// src/charts/shared-chart-svg.ts
|
|
8461
|
+
var svgNamespace = "http://www.w3.org/2000/svg";
|
|
8462
|
+
var elements = new Set(
|
|
8463
|
+
"svg g rect circle ellipse path polygon polyline line text tspan defs clipPath linearGradient radialGradient stop pattern filter feDropShadow".split(
|
|
8464
|
+
" "
|
|
8465
|
+
)
|
|
8466
|
+
);
|
|
8467
|
+
var attributes = new Set(
|
|
8468
|
+
"width height viewBox x y x1 y1 x2 y2 cx cy rx ry r d points transform id dx dy fill fill-opacity fill-rule stroke stroke-opacity stroke-width stroke-dasharray stroke-linecap stroke-linejoin clip-path filter opacity font-family font-size font-weight font-style text-anchor textLength lengthAdjust offset stop-color stop-opacity gradientUnits gradientTransform fx fy fr patternUnits patternContentUnits shape-rendering stdDeviation flood-color flood-opacity overflow data-chart-kind data-chart-series data-chart-point data-chart-x data-chart-y data-docx-series data-docx-point".split(" ")
|
|
8469
|
+
);
|
|
8470
|
+
var paints = /* @__PURE__ */ new Set(["fill", "stroke", "filter", "clip-path", "stop-color", "flood-color"]);
|
|
8471
|
+
var sequence = 0;
|
|
8472
|
+
function mountSharedChart(container, markup, label) {
|
|
8473
|
+
if (markup.includes("<!") || markup.includes("<?")) return false;
|
|
8474
|
+
const svg = new DOMParser().parseFromString(markup, "image/svg+xml").documentElement;
|
|
8475
|
+
if (svg.localName !== "svg") return false;
|
|
8476
|
+
const prefix = `rpv-chart-${++sequence}-`;
|
|
8477
|
+
for (const element of [svg, ...Array.from(svg.querySelectorAll("*"))]) {
|
|
8478
|
+
if (element.namespaceURI !== svgNamespace || !elements.has(element.localName)) return false;
|
|
8479
|
+
for (const attribute of Array.from(element.attributes)) {
|
|
8480
|
+
const { name, value } = attribute;
|
|
8481
|
+
if (name === "xmlns" && element === svg && value === svgNamespace) continue;
|
|
8482
|
+
if (attribute.namespaceURI || !attributes.has(name)) return false;
|
|
8483
|
+
if (name === "id") {
|
|
8484
|
+
if (!/^[a-zA-Z_][\w.-]*$/.test(value)) return false;
|
|
8485
|
+
element.id = prefix + value;
|
|
8486
|
+
} else if (paints.has(name)) {
|
|
8487
|
+
const reference = /^url\(#([\w.-]+)\)$/.exec(value);
|
|
8488
|
+
if (reference) element.setAttribute(name, `url(#${prefix}${reference[1]})`);
|
|
8489
|
+
else if (!/^(?:#[\da-fA-F]{3,8}|[a-zA-Z]+|rgba?\([\d.% ,]+\))$/.test(value)) return false;
|
|
8490
|
+
}
|
|
8491
|
+
}
|
|
8492
|
+
const series = element.getAttribute("data-chart-series");
|
|
8493
|
+
if (series === null) continue;
|
|
8494
|
+
element.setAttribute("data-xlsx-chart-series-index", series);
|
|
8495
|
+
const point = element.getAttribute("data-chart-point");
|
|
8496
|
+
if (point !== null) element.setAttribute("data-xlsx-chart-point-index", point);
|
|
8497
|
+
const kind = element.getAttribute("data-chart-kind");
|
|
8498
|
+
if (kind === "bar") element.setAttribute("data-xlsx-chart-selection-mode", "seriesFirst");
|
|
8499
|
+
if (kind === "legendEntry") element.setAttribute("data-xlsx-chart-element-kind", "legendEntry");
|
|
8500
|
+
if (kind === "point") {
|
|
8501
|
+
const hit = svg.ownerDocument.createElementNS(svgNamespace, "circle");
|
|
8502
|
+
hit.setAttribute("cx", element.getAttribute("data-chart-x") ?? "0");
|
|
8503
|
+
hit.setAttribute("cy", element.getAttribute("data-chart-y") ?? "0");
|
|
8504
|
+
hit.setAttribute("r", "5");
|
|
8505
|
+
hit.setAttribute("fill", "transparent");
|
|
8506
|
+
element.append(hit);
|
|
8507
|
+
}
|
|
8508
|
+
element.setAttribute("cursor", "pointer");
|
|
8509
|
+
}
|
|
8510
|
+
const view = container.ownerDocument.importNode(svg, true);
|
|
8511
|
+
view.style.cssText = "width:100%;height:100%;display:block;";
|
|
8512
|
+
view.setAttribute("role", "img");
|
|
8513
|
+
view.setAttribute("aria-label", label);
|
|
8514
|
+
container.replaceChildren(view);
|
|
8515
|
+
return true;
|
|
8516
|
+
}
|
|
8517
|
+
|
|
8460
8518
|
// src/charts/chart-host.tsx
|
|
8461
8519
|
var CHART_HOST_PALETTE = {
|
|
8462
8520
|
border: "#e4e4e7",
|
|
@@ -8469,6 +8527,9 @@ function chartNeedsRegionMapAtlas(chart) {
|
|
|
8469
8527
|
}
|
|
8470
8528
|
function renderChartInto(container, node, theme) {
|
|
8471
8529
|
try {
|
|
8530
|
+
if (node.chartSvg && mountSharedChart(container, node.chartSvg, node.title ?? node.name ?? "Chart")) {
|
|
8531
|
+
return true;
|
|
8532
|
+
}
|
|
8472
8533
|
const themePalette = buildThemePaletteFromPresentationTheme(theme);
|
|
8473
8534
|
const chart = buildPptxChart(node, themePalette);
|
|
8474
8535
|
const render = () => {
|
|
@@ -12596,12 +12657,12 @@ async function inlineResources(root, signal) {
|
|
|
12596
12657
|
}
|
|
12597
12658
|
return pending;
|
|
12598
12659
|
};
|
|
12599
|
-
const
|
|
12660
|
+
const elements2 = [root, ...root.querySelectorAll("*")];
|
|
12600
12661
|
await Promise.all(
|
|
12601
|
-
|
|
12662
|
+
elements2.flatMap((element) => {
|
|
12602
12663
|
const attributeNames = ["src", "poster", ...element.localName === "image" ? ["href"] : []];
|
|
12603
|
-
const
|
|
12604
|
-
const attributeTasks =
|
|
12664
|
+
const attributes2 = attributeNames.map((name) => ({ name, value: element.getAttribute(name) })).filter((entry) => Boolean(entry.value));
|
|
12665
|
+
const attributeTasks = attributes2.map(async ({ name, value }) => {
|
|
12605
12666
|
element.setAttribute(name, await inline(value));
|
|
12606
12667
|
});
|
|
12607
12668
|
const styleTasks = Array.from(
|