@backtest-kit/pinets 14.1.0 → 15.0.0
This diff represents the content of publicly available package versions that have been released to one of the supported registries. The information contained in this diff is provided for informational purposes only and reflects changes between package versions as they appear in their respective public registries.
- package/README.md +245 -245
- package/build/index.cjs +106 -85
- package/build/index.mjs +106 -85
- package/package.json +90 -90
- package/types.d.ts +6 -0
package/README.md
CHANGED
|
@@ -1,245 +1,245 @@
|
|
|
1
|
-
<img src="https://github.com/tripolskypetr/backtest-kit/raw/refs/heads/master/assets/heraldry.svg" height="45px" align="right">
|
|
2
|
-
|
|
3
|
-
# 📜 @backtest-kit/pinets
|
|
4
|
-
|
|
5
|
-
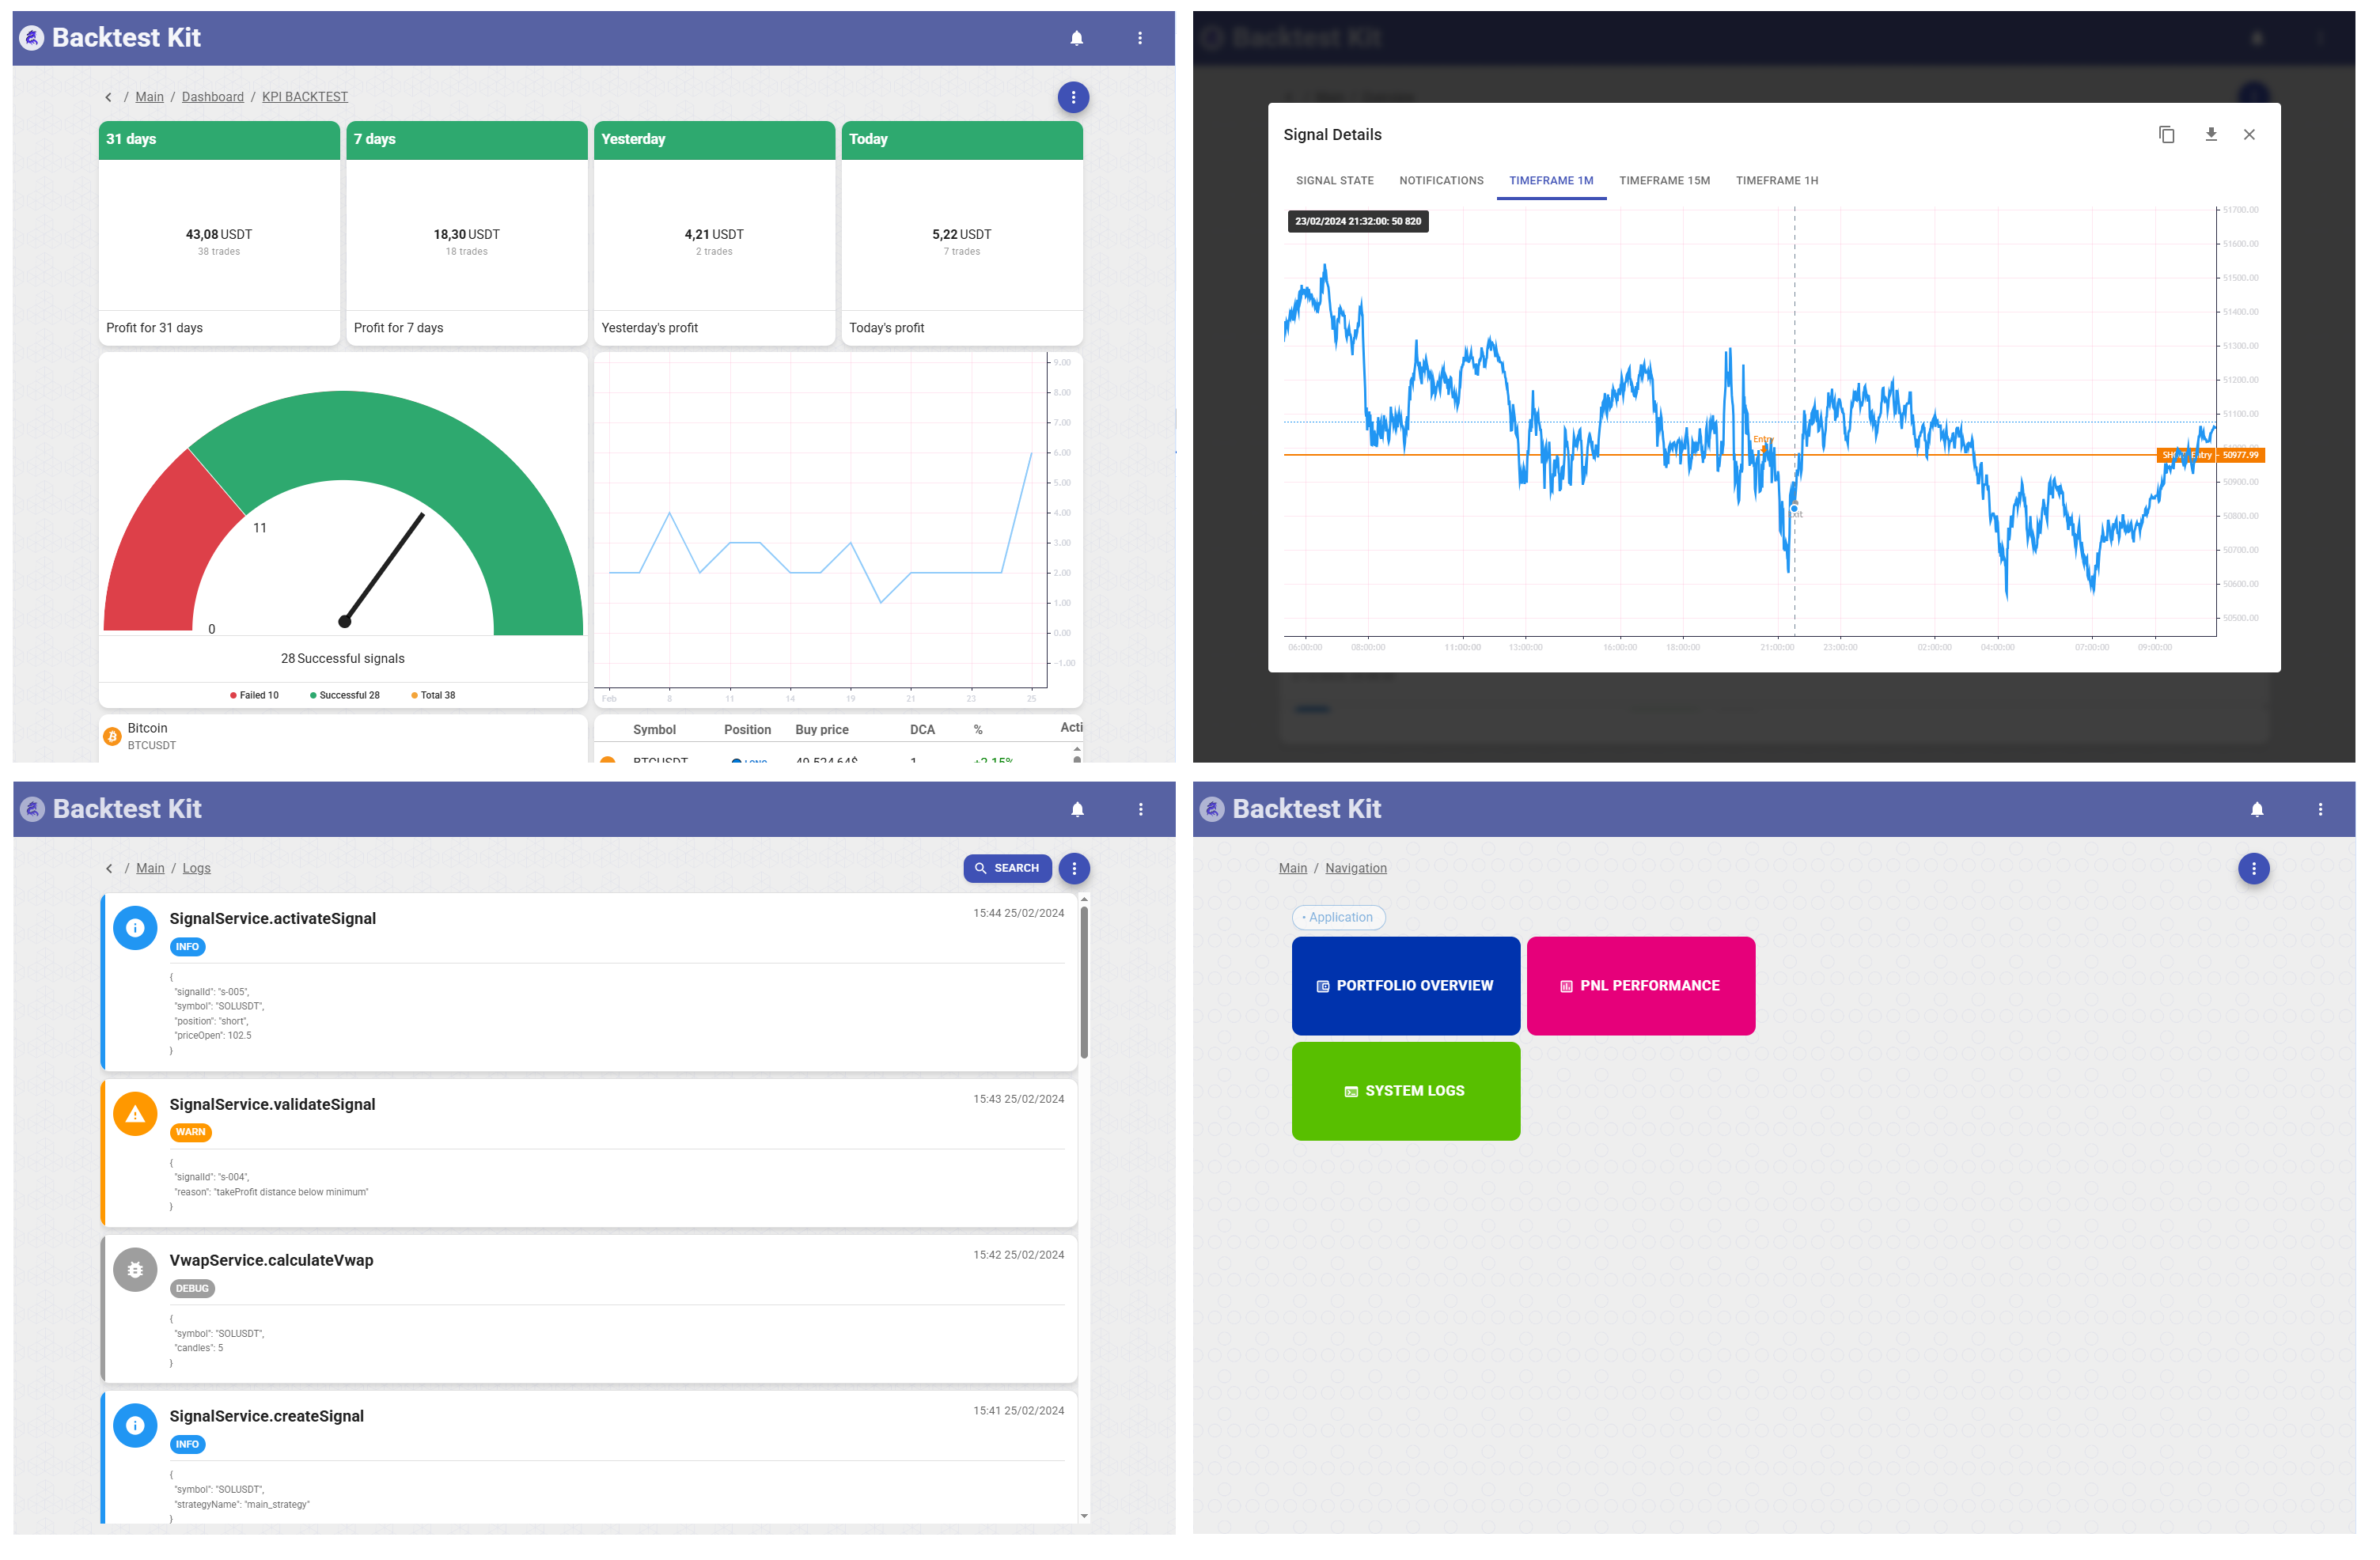
> Run TradingView Pine Script v5/v6 in a self-hosted Node.js environment for [backtest-kit](https://www.npmjs.com/package/backtest-kit). Execute your existing `.pine` indicators with 1:1 syntax compatibility and extract structured trading signals — no TradingView account, no rewrite.
|
|
6
|
-
|
|
7
|
-
|
|
8
|
-
|
|
9
|
-
[](https://deepwiki.com/tripolskypetr/backtest-kit)
|
|
10
|
-
[](https://npmjs.org/package/@backtest-kit/pinets)
|
|
11
|
-
[]()
|
|
12
|
-
|
|
13
|
-
Powered by [PineTS](https://github.com/QuantForgeOrg/PineTS) — an open-source Pine Script transpiler & runtime.
|
|
14
|
-
|
|
15
|
-
📚 **[Docs](https://backtest-kit.github.io/documents/article_07_ai_news_trading_signals.html)** · 🌟 **[Reference implementation](https://github.com/tripolskypetr/backtest-kit/tree/master/example)** · 📜 **[PineTS Docs](https://quantforgeorg.github.io/PineTS/)** · 🐙 **[GitHub](https://github.com/tripolskypetr/backtest-kit)**
|
|
16
|
-
|
|
17
|
-
```bash
|
|
18
|
-
npm install @backtest-kit/pinets pinets backtest-kit
|
|
19
|
-
```
|
|
20
|
-
|
|
21
|
-
---
|
|
22
|
-
|
|
23
|
-
## Why
|
|
24
|
-
|
|
25
|
-
Your edge already exists as a TradingView Pine Script — rewriting it in JavaScript is error-prone busywork that drifts from the original. This package runs the `.pine` **as-is** inside backtest-kit's execution context: `getCandles` feeds it look-ahead-safe data, 60+ indicators are built in (no manual TA math), and the same script powers both backtest and live. You map its `plot()` outputs to a structured signal and you're done.
|
|
26
|
-
|
|
27
|
-
- 📜 **Pine Script v5/v6** — native TradingView syntax, 1:1 compatibility.
|
|
28
|
-
- 🎯 **60+ indicators** — SMA, EMA, RSI, MACD, Bollinger Bands, ATR, Stochastic, ADX, …
|
|
29
|
-
- 🔌 **Engine integration** — runs on backtest-kit's temporal context (no look-ahead).
|
|
30
|
-
- 📁 **File or inline** — load a `.pine` file or pass a code string.
|
|
31
|
-
- 🗺️ **Flexible extraction** — map any `plot()` to typed data, with lookback & transforms.
|
|
32
|
-
- ⚡ **Cached execution** — memoized file reads for repeated runs.
|
|
33
|
-
- 🛡️ **Type-safe** — full generics on extracted data.
|
|
34
|
-
|
|
35
|
-
---
|
|
36
|
-
|
|
37
|
-
## Quick start
|
|
38
|
-
|
|
39
|
-
A Pine Script just needs to expose a few named plots; `getSignal` maps them to an `ISignalDto`.
|
|
40
|
-
|
|
41
|
-
<details>
|
|
42
|
-
<summary>strategy.pine + getSignal</summary>
|
|
43
|
-
|
|
44
|
-
```pine
|
|
45
|
-
//@version=5
|
|
46
|
-
indicator("EMA cross — 1H, 100 candles")
|
|
47
|
-
|
|
48
|
-
rsi = ta.rsi(close, 10)
|
|
49
|
-
atr = ta.atr(10)
|
|
50
|
-
ema_fast = ta.ema(close, 7)
|
|
51
|
-
ema_slow = ta.ema(close, 16)
|
|
52
|
-
|
|
53
|
-
long_cond = ta.crossover(ema_fast, ema_slow) and rsi < 65
|
|
54
|
-
short_cond = ta.crossunder(ema_fast, ema_slow) and rsi > 35
|
|
55
|
-
|
|
56
|
-
plot(close, "Close")
|
|
57
|
-
plot(long_cond ? 1 : short_cond ? -1 : 0, "Signal")
|
|
58
|
-
plot(long_cond ? close - atr*1.5 : close + atr*1.5, "StopLoss")
|
|
59
|
-
plot(long_cond ? close + atr*3 : close - atr*3, "TakeProfit")
|
|
60
|
-
plot(60, "EstimatedTime") // minutes
|
|
61
|
-
```
|
|
62
|
-
|
|
63
|
-
```typescript
|
|
64
|
-
import { File, getSignal } from '@backtest-kit/pinets';
|
|
65
|
-
import { addStrategy } from 'backtest-kit';
|
|
66
|
-
|
|
67
|
-
addStrategy({
|
|
68
|
-
strategyName: 'pine-ema-cross', interval: '5m', riskName: 'demo',
|
|
69
|
-
getSignal: async (symbol) =>
|
|
70
|
-
getSignal(File.fromPath('strategy.pine'), { symbol, timeframe: '1h', limit: 100 }),
|
|
71
|
-
});
|
|
72
|
-
```
|
|
73
|
-
|
|
74
|
-
Inline code needs no file:
|
|
75
|
-
|
|
76
|
-
```typescript
|
|
77
|
-
import { Code, getSignal } from '@backtest-kit/pinets';
|
|
78
|
-
const signal = await getSignal(
|
|
79
|
-
Code.fromString(`//@version=5\nindicator("RSI")\nrsi=ta.rsi(close,14)\natr=ta.atr(14)\nplot(close,"Close")\nplot(rsi<30?1:rsi>70?-1:0,"Signal")\nplot(close-atr*2,"StopLoss")\nplot(close+atr*3,"TakeProfit")`),
|
|
80
|
-
{ symbol: 'BTCUSDT', timeframe: '15m', limit: 100 });
|
|
81
|
-
```
|
|
82
|
-
|
|
83
|
-
</details>
|
|
84
|
-
|
|
85
|
-
### Required plots for `getSignal()`
|
|
86
|
-
|
|
87
|
-
| Plot name | Value | Meaning |
|
|
88
|
-
|-----------|-------|---------|
|
|
89
|
-
| `"Signal"` | `1` / `-1` / `0` | Long / Short / no signal |
|
|
90
|
-
| `"Close"` | `close` | Entry price |
|
|
91
|
-
| `"StopLoss"` | price | Stop-loss level |
|
|
92
|
-
| `"TakeProfit"` | price | Take-profit level |
|
|
93
|
-
| `"EstimatedTime"` | minutes | Hold duration (optional, default 240) |
|
|
94
|
-
|
|
95
|
-
Custom plots are fine too — use `run` + `extract` to remap them (below).
|
|
96
|
-
|
|
97
|
-
---
|
|
98
|
-
|
|
99
|
-
## Custom extraction
|
|
100
|
-
|
|
101
|
-
`run()` returns raw plot data; `extract()` / `extractRows()` pull it into typed shapes with optional lookback and transforms.
|
|
102
|
-
|
|
103
|
-
<details>
|
|
104
|
-
<summary>extract() — latest bar values</summary>
|
|
105
|
-
|
|
106
|
-
```typescript
|
|
107
|
-
import { File, run, extract } from '@backtest-kit/pinets';
|
|
108
|
-
|
|
109
|
-
const plots = await run(File.fromPath('indicators.pine'), { symbol: 'ETHUSDT', timeframe: '1h', limit: 200 });
|
|
110
|
-
const data = await extract(plots, {
|
|
111
|
-
rsi: 'RSI', macd: 'MACD', // plot name → number
|
|
112
|
-
prevRsi: { plot: 'RSI', barsBack: 1 }, // previous bar
|
|
113
|
-
trendStrength: { plot: 'ADX', transform: (v) => v > 25 ? 'strong' : 'weak' },
|
|
114
|
-
});
|
|
115
|
-
// { rsi: 55.2, macd: 12.5, prevRsi: 52.1, trendStrength: 'strong' }
|
|
116
|
-
```
|
|
117
|
-
|
|
118
|
-
</details>
|
|
119
|
-
|
|
120
|
-
<details>
|
|
121
|
-
<summary>extractRows() — every bar, timestamped</summary>
|
|
122
|
-
|
|
123
|
-
```typescript
|
|
124
|
-
import { File, run, extractRows } from '@backtest-kit/pinets';
|
|
125
|
-
|
|
126
|
-
const plots = await run(File.fromPath('indicators.pine'), { symbol: 'ETHUSDT', timeframe: '1h', limit: 200 });
|
|
127
|
-
const rows = await extractRows(plots, {
|
|
128
|
-
rsi: 'RSI', macd: 'MACD',
|
|
129
|
-
prevRsi: { plot: 'RSI', barsBack: 1 },
|
|
130
|
-
trend: { plot: 'ADX', transform: (v) => v > 25 ? 'strong' : 'weak' },
|
|
131
|
-
});
|
|
132
|
-
// rows[1] = { timestamp: '2024-01-01T01:00:00.000Z', rsi: 52.1, macd: -1.5, prevRsi: 48.3, trend: 'weak' }
|
|
133
|
-
```
|
|
134
|
-
|
|
135
|
-
`extract()` vs `extractRows()`: single latest object vs array of all bars; missing value `0` vs `null`; no timestamp vs ISO `timestamp`; `barsBack` from the last bar vs from each bar's own index. Use `extract` for signal generation at the current bar, `extractRows` for dataset export / historical analysis.
|
|
136
|
-
|
|
137
|
-
</details>
|
|
138
|
-
|
|
139
|
-
<details>
|
|
140
|
-
<summary>toSignalDto() — turn extracted values into a signal</summary>
|
|
141
|
-
|
|
142
|
-
The helper `getSignal` uses internally, exposed for custom graphs (e.g. multi-timeframe via `@backtest-kit/graph`). Maps `position` `1`/`-1`/`0` → `long`/`short`/`null`, carrying TP/SL/estimated-time, with an optional explicit `priceOpen`:
|
|
143
|
-
|
|
144
|
-
```typescript
|
|
145
|
-
import { run, extract, toSignalDto } from '@backtest-kit/pinets';
|
|
146
|
-
import { randomString } from 'functools-kit';
|
|
147
|
-
|
|
148
|
-
const plots = await run(File.fromPath('strategy.pine'), { symbol, timeframe: '15m', limit: 100 });
|
|
149
|
-
const data = await extract(plots, { position: 'Signal', priceTakeProfit: 'TakeProfit', priceStopLoss: 'StopLoss', minuteEstimatedTime: 'EstimatedTime' });
|
|
150
|
-
const signal = toSignalDto(randomString(), data, null); // ISignalDto | null
|
|
151
|
-
```
|
|
152
|
-
|
|
153
|
-
</details>
|
|
154
|
-
|
|
155
|
-
---
|
|
156
|
-
|
|
157
|
-
## Debugging & customization
|
|
158
|
-
|
|
159
|
-
<details>
|
|
160
|
-
<summary>dumpPlotData / markdown — inspect plot output</summary>
|
|
161
|
-
|
|
162
|
-
```typescript
|
|
163
|
-
import { File, run, dumpPlotData, toMarkdown } from '@backtest-kit/pinets';
|
|
164
|
-
const plots = await run(File.fromPath('strategy.pine'), { symbol: 'BTCUSDT', timeframe: '1h', limit: 100 });
|
|
165
|
-
await dumpPlotData('signal-001', plots, 'ema-cross', './dump/ta'); // → markdown files
|
|
166
|
-
const md = await toMarkdown(plots); // markdown table as a string
|
|
167
|
-
```
|
|
168
|
-
|
|
169
|
-
</details>
|
|
170
|
-
|
|
171
|
-
<details>
|
|
172
|
-
<summary>usePine / useIndicator / setLogger — swap internals</summary>
|
|
173
|
-
|
|
174
|
-
```typescript
|
|
175
|
-
import { usePine, useIndicator, setLogger } from '@backtest-kit/pinets';
|
|
176
|
-
import { Pine } from 'pinets';
|
|
177
|
-
|
|
178
|
-
usePine(Pine); // register a custom Pine constructor
|
|
179
|
-
useIndicator(MyIndicatorCtor); // register a custom indicator constructor
|
|
180
|
-
setLogger({ log: (m, d) => console.log(`[${m}]`, d), info: () => {}, error: console.error });
|
|
181
|
-
```
|
|
182
|
-
|
|
183
|
-
</details>
|
|
184
|
-
|
|
185
|
-
---
|
|
186
|
-
|
|
187
|
-
## Why not just rewrite it in JS?
|
|
188
|
-
|
|
189
|
-
<details>
|
|
190
|
-
<summary>The difference</summary>
|
|
191
|
-
|
|
192
|
-
```typescript
|
|
193
|
-
// ❌ Manual rewrite — re-derive every indicator, drift from the original
|
|
194
|
-
const candles = await getCandles('BTCUSDT', '5m', 100);
|
|
195
|
-
const closes = candles.map(c => c.close);
|
|
196
|
-
const rsi = RSI.calculate({ values: closes, period: 14 });
|
|
197
|
-
const emaFast = EMA.calculate({ values: closes, period: 9 });
|
|
198
|
-
// …port all the Pine logic by hand
|
|
199
|
-
|
|
200
|
-
// ✅ With pinets — copy the .pine straight from TradingView
|
|
201
|
-
const signal = await getSignal(File.fromPath('strategy.pine'), { symbol: 'BTCUSDT', timeframe: '5m', limit: 100 });
|
|
202
|
-
```
|
|
203
|
-
|
|
204
|
-
Use existing scripts as-is · 60+ indicators with no manual math · same code backtest & live · full time-series lookback semantics · type-safe extraction.
|
|
205
|
-
|
|
206
|
-
</details>
|
|
207
|
-
|
|
208
|
-
---
|
|
209
|
-
|
|
210
|
-
## API reference
|
|
211
|
-
|
|
212
|
-
| Export | Description |
|
|
213
|
-
|--------|-------------|
|
|
214
|
-
| `getSignal(source, opts)` | Run Pine Script → structured `ISignalDto` (position, TP/SL, estimated time) |
|
|
215
|
-
| `run(source, opts)` | Run Pine Script → raw plot data |
|
|
216
|
-
| `extract(plots, mapping)` | Latest-bar values with custom mapping (missing → `0`) |
|
|
217
|
-
| `extractRows(plots, mapping)` | All bars as timestamped rows (missing → `null`) |
|
|
218
|
-
| `toSignalDto(id, data, priceOpen?)` | Map extracted `{ position, … }` → `ISignalDto \| null` |
|
|
219
|
-
| `dumpPlotData(id, plots, name, dir)` | Dump plot data to markdown files |
|
|
220
|
-
| `toMarkdown(plots)` · `markdown(...)` | Render plots as a markdown table |
|
|
221
|
-
| `File.fromPath(path)` | Load Pine Script from a `.pine` file (memoized) |
|
|
222
|
-
| `Code.fromString(code)` | Use inline Pine Script |
|
|
223
|
-
| `usePine(ctor)` · `useIndicator(ctor)` | Register a custom Pine / indicator constructor |
|
|
224
|
-
| `setLogger(logger)` | Custom logger |
|
|
225
|
-
| `lib` | The internal IoC container for advanced use |
|
|
226
|
-
| `AXIS_SYMBOL` | Axis provider symbol token |
|
|
227
|
-
|
|
228
|
-
**Options** (`run`/`getSignal`): `symbol`, `timeframe` (Pine candle interval), `limit` (candles to fetch — must cover indicator warmup; pre-warmup bars are `N/A`).
|
|
229
|
-
|
|
230
|
-
**Types:** `PlotExtractConfig`, `PlotMapping`, `ExtractedData`, `ExtractedDataRow`, `CandleModel`, `PlotModel`, `PlotRecord`, `SymbolInfoModel`, `ILogger`, `IPine`/`TPineCtor`, `IIndicator`/`TIndicatorCtor`, `IProvider`.
|
|
231
|
-
|
|
232
|
-
<details>
|
|
233
|
-
<summary>Complete source map</summary>
|
|
234
|
-
|
|
235
|
-
`classes/{Code,File}.ts` · `function/{pine,indicator,run,extract,setup,strategy,dump,markdown}.function.ts` · `helpers/toSignalDto.ts` · `model/{Candle,Plot,SymbolInfo}.model.ts` · `interface/{Logger,Pine,Indicator,Provider}.interface.ts` · `lib/` IoC (`core/{di,provide,types}`, `services/{base/LoggerService, cache/PineCacheService, connection/{Pine,Indicator}ConnectionService, context/ExchangeContextService, data/PineDataService, job/PineJobService, markdown/PineMarkdownService, provider/{Axis,Candle}ProviderService}`). Every export above maps to one of these — nothing in `src/` is undocumented.
|
|
236
|
-
|
|
237
|
-
</details>
|
|
238
|
-
|
|
239
|
-
## 🤝 Contribute
|
|
240
|
-
|
|
241
|
-
Fork / PR on [GitHub](https://github.com/tripolskypetr/backtest-kit).
|
|
242
|
-
|
|
243
|
-
## 📜 License
|
|
244
|
-
|
|
245
|
-
MIT © [tripolskypetr](https://github.com/tripolskypetr)
|
|
1
|
+
<img src="https://github.com/tripolskypetr/backtest-kit/raw/refs/heads/master/assets/heraldry.svg" height="45px" align="right">
|
|
2
|
+
|
|
3
|
+
# 📜 @backtest-kit/pinets
|
|
4
|
+
|
|
5
|
+
> Run TradingView Pine Script v5/v6 in a self-hosted Node.js environment for [backtest-kit](https://www.npmjs.com/package/backtest-kit). Execute your existing `.pine` indicators with 1:1 syntax compatibility and extract structured trading signals — no TradingView account, no rewrite.
|
|
6
|
+
|
|
7
|
+

|
|
8
|
+
|
|
9
|
+
[](https://deepwiki.com/tripolskypetr/backtest-kit)
|
|
10
|
+
[](https://npmjs.org/package/@backtest-kit/pinets)
|
|
11
|
+
[]()
|
|
12
|
+
|
|
13
|
+
Powered by [PineTS](https://github.com/QuantForgeOrg/PineTS) — an open-source Pine Script transpiler & runtime.
|
|
14
|
+
|
|
15
|
+
📚 **[Docs](https://backtest-kit.github.io/documents/article_07_ai_news_trading_signals.html)** · 🌟 **[Reference implementation](https://github.com/tripolskypetr/backtest-kit/tree/master/example)** · 📜 **[PineTS Docs](https://quantforgeorg.github.io/PineTS/)** · 🐙 **[GitHub](https://github.com/tripolskypetr/backtest-kit)**
|
|
16
|
+
|
|
17
|
+
```bash
|
|
18
|
+
npm install @backtest-kit/pinets pinets backtest-kit
|
|
19
|
+
```
|
|
20
|
+
|
|
21
|
+
---
|
|
22
|
+
|
|
23
|
+
## Why
|
|
24
|
+
|
|
25
|
+
Your edge already exists as a TradingView Pine Script — rewriting it in JavaScript is error-prone busywork that drifts from the original. This package runs the `.pine` **as-is** inside backtest-kit's execution context: `getCandles` feeds it look-ahead-safe data, 60+ indicators are built in (no manual TA math), and the same script powers both backtest and live. You map its `plot()` outputs to a structured signal and you're done.
|
|
26
|
+
|
|
27
|
+
- 📜 **Pine Script v5/v6** — native TradingView syntax, 1:1 compatibility.
|
|
28
|
+
- 🎯 **60+ indicators** — SMA, EMA, RSI, MACD, Bollinger Bands, ATR, Stochastic, ADX, …
|
|
29
|
+
- 🔌 **Engine integration** — runs on backtest-kit's temporal context (no look-ahead).
|
|
30
|
+
- 📁 **File or inline** — load a `.pine` file or pass a code string.
|
|
31
|
+
- 🗺️ **Flexible extraction** — map any `plot()` to typed data, with lookback & transforms.
|
|
32
|
+
- ⚡ **Cached execution** — memoized file reads for repeated runs.
|
|
33
|
+
- 🛡️ **Type-safe** — full generics on extracted data.
|
|
34
|
+
|
|
35
|
+
---
|
|
36
|
+
|
|
37
|
+
## Quick start
|
|
38
|
+
|
|
39
|
+
A Pine Script just needs to expose a few named plots; `getSignal` maps them to an `ISignalDto`.
|
|
40
|
+
|
|
41
|
+
<details>
|
|
42
|
+
<summary>strategy.pine + getSignal</summary>
|
|
43
|
+
|
|
44
|
+
```pine
|
|
45
|
+
//@version=5
|
|
46
|
+
indicator("EMA cross — 1H, 100 candles")
|
|
47
|
+
|
|
48
|
+
rsi = ta.rsi(close, 10)
|
|
49
|
+
atr = ta.atr(10)
|
|
50
|
+
ema_fast = ta.ema(close, 7)
|
|
51
|
+
ema_slow = ta.ema(close, 16)
|
|
52
|
+
|
|
53
|
+
long_cond = ta.crossover(ema_fast, ema_slow) and rsi < 65
|
|
54
|
+
short_cond = ta.crossunder(ema_fast, ema_slow) and rsi > 35
|
|
55
|
+
|
|
56
|
+
plot(close, "Close")
|
|
57
|
+
plot(long_cond ? 1 : short_cond ? -1 : 0, "Signal")
|
|
58
|
+
plot(long_cond ? close - atr*1.5 : close + atr*1.5, "StopLoss")
|
|
59
|
+
plot(long_cond ? close + atr*3 : close - atr*3, "TakeProfit")
|
|
60
|
+
plot(60, "EstimatedTime") // minutes
|
|
61
|
+
```
|
|
62
|
+
|
|
63
|
+
```typescript
|
|
64
|
+
import { File, getSignal } from '@backtest-kit/pinets';
|
|
65
|
+
import { addStrategy } from 'backtest-kit';
|
|
66
|
+
|
|
67
|
+
addStrategy({
|
|
68
|
+
strategyName: 'pine-ema-cross', interval: '5m', riskName: 'demo',
|
|
69
|
+
getSignal: async (symbol) =>
|
|
70
|
+
getSignal(File.fromPath('strategy.pine'), { symbol, timeframe: '1h', limit: 100 }),
|
|
71
|
+
});
|
|
72
|
+
```
|
|
73
|
+
|
|
74
|
+
Inline code needs no file:
|
|
75
|
+
|
|
76
|
+
```typescript
|
|
77
|
+
import { Code, getSignal } from '@backtest-kit/pinets';
|
|
78
|
+
const signal = await getSignal(
|
|
79
|
+
Code.fromString(`//@version=5\nindicator("RSI")\nrsi=ta.rsi(close,14)\natr=ta.atr(14)\nplot(close,"Close")\nplot(rsi<30?1:rsi>70?-1:0,"Signal")\nplot(close-atr*2,"StopLoss")\nplot(close+atr*3,"TakeProfit")`),
|
|
80
|
+
{ symbol: 'BTCUSDT', timeframe: '15m', limit: 100 });
|
|
81
|
+
```
|
|
82
|
+
|
|
83
|
+
</details>
|
|
84
|
+
|
|
85
|
+
### Required plots for `getSignal()`
|
|
86
|
+
|
|
87
|
+
| Plot name | Value | Meaning |
|
|
88
|
+
|-----------|-------|---------|
|
|
89
|
+
| `"Signal"` | `1` / `-1` / `0` | Long / Short / no signal |
|
|
90
|
+
| `"Close"` | `close` | Entry price |
|
|
91
|
+
| `"StopLoss"` | price | Stop-loss level |
|
|
92
|
+
| `"TakeProfit"` | price | Take-profit level |
|
|
93
|
+
| `"EstimatedTime"` | minutes | Hold duration (optional, default 240) |
|
|
94
|
+
|
|
95
|
+
Custom plots are fine too — use `run` + `extract` to remap them (below).
|
|
96
|
+
|
|
97
|
+
---
|
|
98
|
+
|
|
99
|
+
## Custom extraction
|
|
100
|
+
|
|
101
|
+
`run()` returns raw plot data; `extract()` / `extractRows()` pull it into typed shapes with optional lookback and transforms.
|
|
102
|
+
|
|
103
|
+
<details>
|
|
104
|
+
<summary>extract() — latest bar values</summary>
|
|
105
|
+
|
|
106
|
+
```typescript
|
|
107
|
+
import { File, run, extract } from '@backtest-kit/pinets';
|
|
108
|
+
|
|
109
|
+
const plots = await run(File.fromPath('indicators.pine'), { symbol: 'ETHUSDT', timeframe: '1h', limit: 200 });
|
|
110
|
+
const data = await extract(plots, {
|
|
111
|
+
rsi: 'RSI', macd: 'MACD', // plot name → number
|
|
112
|
+
prevRsi: { plot: 'RSI', barsBack: 1 }, // previous bar
|
|
113
|
+
trendStrength: { plot: 'ADX', transform: (v) => v > 25 ? 'strong' : 'weak' },
|
|
114
|
+
});
|
|
115
|
+
// { rsi: 55.2, macd: 12.5, prevRsi: 52.1, trendStrength: 'strong' }
|
|
116
|
+
```
|
|
117
|
+
|
|
118
|
+
</details>
|
|
119
|
+
|
|
120
|
+
<details>
|
|
121
|
+
<summary>extractRows() — every bar, timestamped</summary>
|
|
122
|
+
|
|
123
|
+
```typescript
|
|
124
|
+
import { File, run, extractRows } from '@backtest-kit/pinets';
|
|
125
|
+
|
|
126
|
+
const plots = await run(File.fromPath('indicators.pine'), { symbol: 'ETHUSDT', timeframe: '1h', limit: 200 });
|
|
127
|
+
const rows = await extractRows(plots, {
|
|
128
|
+
rsi: 'RSI', macd: 'MACD',
|
|
129
|
+
prevRsi: { plot: 'RSI', barsBack: 1 },
|
|
130
|
+
trend: { plot: 'ADX', transform: (v) => v > 25 ? 'strong' : 'weak' },
|
|
131
|
+
});
|
|
132
|
+
// rows[1] = { timestamp: '2024-01-01T01:00:00.000Z', rsi: 52.1, macd: -1.5, prevRsi: 48.3, trend: 'weak' }
|
|
133
|
+
```
|
|
134
|
+
|
|
135
|
+
`extract()` vs `extractRows()`: single latest object vs array of all bars; missing value `0` vs `null`; no timestamp vs ISO `timestamp`; `barsBack` from the last bar vs from each bar's own index. Use `extract` for signal generation at the current bar, `extractRows` for dataset export / historical analysis.
|
|
136
|
+
|
|
137
|
+
</details>
|
|
138
|
+
|
|
139
|
+
<details>
|
|
140
|
+
<summary>toSignalDto() — turn extracted values into a signal</summary>
|
|
141
|
+
|
|
142
|
+
The helper `getSignal` uses internally, exposed for custom graphs (e.g. multi-timeframe via `@backtest-kit/graph`). Maps `position` `1`/`-1`/`0` → `long`/`short`/`null`, carrying TP/SL/estimated-time, with an optional explicit `priceOpen`:
|
|
143
|
+
|
|
144
|
+
```typescript
|
|
145
|
+
import { run, extract, toSignalDto } from '@backtest-kit/pinets';
|
|
146
|
+
import { randomString } from 'functools-kit';
|
|
147
|
+
|
|
148
|
+
const plots = await run(File.fromPath('strategy.pine'), { symbol, timeframe: '15m', limit: 100 });
|
|
149
|
+
const data = await extract(plots, { position: 'Signal', priceTakeProfit: 'TakeProfit', priceStopLoss: 'StopLoss', minuteEstimatedTime: 'EstimatedTime' });
|
|
150
|
+
const signal = toSignalDto(randomString(), data, null); // ISignalDto | null
|
|
151
|
+
```
|
|
152
|
+
|
|
153
|
+
</details>
|
|
154
|
+
|
|
155
|
+
---
|
|
156
|
+
|
|
157
|
+
## Debugging & customization
|
|
158
|
+
|
|
159
|
+
<details>
|
|
160
|
+
<summary>dumpPlotData / markdown — inspect plot output</summary>
|
|
161
|
+
|
|
162
|
+
```typescript
|
|
163
|
+
import { File, run, dumpPlotData, toMarkdown } from '@backtest-kit/pinets';
|
|
164
|
+
const plots = await run(File.fromPath('strategy.pine'), { symbol: 'BTCUSDT', timeframe: '1h', limit: 100 });
|
|
165
|
+
await dumpPlotData('signal-001', plots, 'ema-cross', './dump/ta'); // → markdown files
|
|
166
|
+
const md = await toMarkdown(plots); // markdown table as a string
|
|
167
|
+
```
|
|
168
|
+
|
|
169
|
+
</details>
|
|
170
|
+
|
|
171
|
+
<details>
|
|
172
|
+
<summary>usePine / useIndicator / setLogger — swap internals</summary>
|
|
173
|
+
|
|
174
|
+
```typescript
|
|
175
|
+
import { usePine, useIndicator, setLogger } from '@backtest-kit/pinets';
|
|
176
|
+
import { Pine } from 'pinets';
|
|
177
|
+
|
|
178
|
+
usePine(Pine); // register a custom Pine constructor
|
|
179
|
+
useIndicator(MyIndicatorCtor); // register a custom indicator constructor
|
|
180
|
+
setLogger({ log: (m, d) => console.log(`[${m}]`, d), info: () => {}, error: console.error });
|
|
181
|
+
```
|
|
182
|
+
|
|
183
|
+
</details>
|
|
184
|
+
|
|
185
|
+
---
|
|
186
|
+
|
|
187
|
+
## Why not just rewrite it in JS?
|
|
188
|
+
|
|
189
|
+
<details>
|
|
190
|
+
<summary>The difference</summary>
|
|
191
|
+
|
|
192
|
+
```typescript
|
|
193
|
+
// ❌ Manual rewrite — re-derive every indicator, drift from the original
|
|
194
|
+
const candles = await getCandles('BTCUSDT', '5m', 100);
|
|
195
|
+
const closes = candles.map(c => c.close);
|
|
196
|
+
const rsi = RSI.calculate({ values: closes, period: 14 });
|
|
197
|
+
const emaFast = EMA.calculate({ values: closes, period: 9 });
|
|
198
|
+
// …port all the Pine logic by hand
|
|
199
|
+
|
|
200
|
+
// ✅ With pinets — copy the .pine straight from TradingView
|
|
201
|
+
const signal = await getSignal(File.fromPath('strategy.pine'), { symbol: 'BTCUSDT', timeframe: '5m', limit: 100 });
|
|
202
|
+
```
|
|
203
|
+
|
|
204
|
+
Use existing scripts as-is · 60+ indicators with no manual math · same code backtest & live · full time-series lookback semantics · type-safe extraction.
|
|
205
|
+
|
|
206
|
+
</details>
|
|
207
|
+
|
|
208
|
+
---
|
|
209
|
+
|
|
210
|
+
## API reference
|
|
211
|
+
|
|
212
|
+
| Export | Description |
|
|
213
|
+
|--------|-------------|
|
|
214
|
+
| `getSignal(source, opts)` | Run Pine Script → structured `ISignalDto` (position, TP/SL, estimated time) |
|
|
215
|
+
| `run(source, opts)` | Run Pine Script → raw plot data |
|
|
216
|
+
| `extract(plots, mapping)` | Latest-bar values with custom mapping (missing → `0`) |
|
|
217
|
+
| `extractRows(plots, mapping)` | All bars as timestamped rows (missing → `null`) |
|
|
218
|
+
| `toSignalDto(id, data, priceOpen?)` | Map extracted `{ position, … }` → `ISignalDto \| null` |
|
|
219
|
+
| `dumpPlotData(id, plots, name, dir)` | Dump plot data to markdown files |
|
|
220
|
+
| `toMarkdown(plots)` · `markdown(...)` | Render plots as a markdown table |
|
|
221
|
+
| `File.fromPath(path)` | Load Pine Script from a `.pine` file (memoized) |
|
|
222
|
+
| `Code.fromString(code)` | Use inline Pine Script |
|
|
223
|
+
| `usePine(ctor)` · `useIndicator(ctor)` | Register a custom Pine / indicator constructor |
|
|
224
|
+
| `setLogger(logger)` | Custom logger |
|
|
225
|
+
| `lib` | The internal IoC container for advanced use |
|
|
226
|
+
| `AXIS_SYMBOL` | Axis provider symbol token |
|
|
227
|
+
|
|
228
|
+
**Options** (`run`/`getSignal`): `symbol`, `timeframe` (Pine candle interval), `limit` (candles to fetch — must cover indicator warmup; pre-warmup bars are `N/A`).
|
|
229
|
+
|
|
230
|
+
**Types:** `PlotExtractConfig`, `PlotMapping`, `ExtractedData`, `ExtractedDataRow`, `CandleModel`, `PlotModel`, `PlotRecord`, `SymbolInfoModel`, `ILogger`, `IPine`/`TPineCtor`, `IIndicator`/`TIndicatorCtor`, `IProvider`.
|
|
231
|
+
|
|
232
|
+
<details>
|
|
233
|
+
<summary>Complete source map</summary>
|
|
234
|
+
|
|
235
|
+
`classes/{Code,File}.ts` · `function/{pine,indicator,run,extract,setup,strategy,dump,markdown}.function.ts` · `helpers/toSignalDto.ts` · `model/{Candle,Plot,SymbolInfo}.model.ts` · `interface/{Logger,Pine,Indicator,Provider}.interface.ts` · `lib/` IoC (`core/{di,provide,types}`, `services/{base/LoggerService, cache/PineCacheService, connection/{Pine,Indicator}ConnectionService, context/ExchangeContextService, data/PineDataService, job/PineJobService, markdown/PineMarkdownService, provider/{Axis,Candle}ProviderService}`). Every export above maps to one of these — nothing in `src/` is undocumented.
|
|
236
|
+
|
|
237
|
+
</details>
|
|
238
|
+
|
|
239
|
+
## 🤝 Contribute
|
|
240
|
+
|
|
241
|
+
Fork / PR on [GitHub](https://github.com/tripolskypetr/backtest-kit).
|
|
242
|
+
|
|
243
|
+
## 📜 License
|
|
244
|
+
|
|
245
|
+
MIT © [tripolskypetr](https://github.com/tripolskypetr)
|