@arcgis/common-components 5.2.0-next.11 → 5.2.0-next.110
This diff represents the content of publicly available package versions that have been released to one of the supported registries. The information contained in this diff is provided for informational purposes only and reflects changes between package versions as they appear in their respective public registries.
- package/LICENSE.md +4 -2
- package/README.md +2 -2
- package/dist/cdn/24BY6E4U.js +2 -0
- package/dist/cdn/{MCZBUYS5.js → 26TPKYHY.js} +2 -2
- package/dist/cdn/2P3QKSBJ.js +2 -0
- package/dist/cdn/3ENYIWMV.js +2 -0
- package/dist/cdn/3YTGG7RF.js +2 -0
- package/dist/cdn/{VQLI4IE7.js → 6YKEQTXQ.js} +2 -2
- package/dist/cdn/{L5RMOAO3.js → 73AR55J2.js} +2 -2
- package/dist/cdn/746MUQGB.js +2 -0
- package/dist/cdn/{Y5Y7IXOV.js → 74MDECVO.js} +1 -1
- package/dist/cdn/AHWD5KV4.js +2 -0
- package/dist/cdn/ALOLCOFN.js +2 -0
- package/dist/cdn/B2QFPLR5.js +2 -0
- package/dist/cdn/{WEKRF34E.js → B6QUU35R.js} +2 -2
- package/dist/cdn/BGN6KRHS.js +2 -0
- package/dist/cdn/BQD6UQIB.js +2 -0
- package/dist/cdn/{JLPZ3OR2.js → BSSCT4Z5.js} +2 -2
- package/dist/cdn/CT3ZUD4C.js +2 -0
- package/dist/cdn/D2RCMLMS.js +2 -0
- package/dist/cdn/{5KS7T5BY.js → D2YGEFGL.js} +2 -2
- package/dist/cdn/DICEO27I.js +2 -0
- package/dist/cdn/{ECNI2A4K.js → E4NVOXNZ.js} +1 -1
- package/dist/cdn/{GVOQ2CB7.js → EY5CL247.js} +2 -2
- package/dist/cdn/EZH7L65E.js +2 -0
- package/dist/cdn/{LKUOAV7B.js → F2XLHROQ.js} +2 -2
- package/dist/cdn/F3UPNSY4.js +2 -0
- package/dist/cdn/F7ZMTKDL.js +2 -0
- package/dist/cdn/GAXWOAWM.js +2 -0
- package/dist/cdn/GV62Q7D7.js +2 -0
- package/dist/cdn/H4MYODDU.js +2 -0
- package/dist/cdn/{OBIWQRXY.js → IUQEF23H.js} +2 -2
- package/dist/cdn/KIWPQY6T.js +4 -0
- package/dist/cdn/KMWJCWRS.js +2 -0
- package/dist/cdn/{L2JNUMXB.js → KOQXEMEM.js} +2 -2
- package/dist/cdn/LE43VGSR.js +2 -0
- package/dist/cdn/NMDESY3T.js +2 -0
- package/dist/cdn/NXUTEL5Q.js +2 -0
- package/dist/cdn/P3DCEHGK.js +2 -0
- package/dist/cdn/P6IUT6XO.js +2 -0
- package/dist/cdn/P7I4EXSU.js +2 -0
- package/dist/cdn/Q7STPO4U.js +2 -0
- package/dist/cdn/QJJFF4PI.js +2 -0
- package/dist/cdn/{4W7JZPB6.js → SHMWZ2AY.js} +2 -2
- package/dist/cdn/{3P53QRGS.js → ST5VEH7P.js} +2 -2
- package/dist/cdn/U2K7ABGL.js +2 -0
- package/dist/cdn/VIUFXHPL.js +2 -0
- package/dist/cdn/{UGWLCTVM.js → YJTI6KPW.js} +1 -1
- package/dist/cdn/{XRARFMJ7.js → ZBSOCWIQ.js} +2 -2
- package/dist/cdn/{3V5M7OHL.js → ZZGYCYHP.js} +4 -4
- package/dist/cdn/assets/field-pick-list/t9n/messages.en.json +1 -1
- package/dist/cdn/assets/slider-field/t9n/messages.en.json +1 -0
- package/dist/cdn/assets/slider-histogram-range/t9n/messages.en.json +1 -0
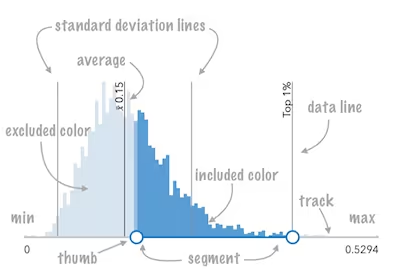
- package/dist/cdn/index.js +2 -2
- package/dist/cdn/main.css +1 -1
- package/dist/chunks/element-reference-controller.js +19 -0
- package/dist/chunks/{commonFunctions.js → general.js} +1 -1
- package/dist/chunks/internal-types.js +1 -1
- package/dist/chunks/layer-utils.js +53 -41
- package/dist/chunks/locale.js +15 -7
- package/dist/chunks/resources.js +1 -1
- package/dist/chunks/runtime.js +1 -1
- package/dist/chunks/strategies.js +287 -0
- package/dist/chunks/toolbar.js +9 -0
- package/dist/chunks/types.js +16 -0
- package/dist/chunks/useT9n.js +1 -1
- package/dist/chunks/utils.js +59 -0
- package/dist/chunks/utils2.js +20 -0
- package/dist/chunks/utils3.js +7 -0
- package/dist/components/arcgis-ckeditor5/customElement.d.ts +23 -0
- package/dist/components/arcgis-ckeditor5/customElement.js +3 -3
- package/dist/components/arcgis-ckeditor5-popover/customElement.js +2 -2
- package/dist/components/arcgis-color-input/customElement.d.ts +2 -1
- package/dist/components/arcgis-color-input/customElement.js +2 -2
- package/dist/components/arcgis-coordinate-system-picker/customElement.d.ts +23 -0
- package/dist/components/arcgis-coordinate-system-picker/customElement.js +2 -2
- package/dist/components/arcgis-coordinate-system-picker-tree/customElement.js +1 -1
- package/dist/components/arcgis-field-info/customElement.d.ts +1 -1
- package/dist/components/arcgis-field-info/customElement.js +249 -226
- package/dist/components/arcgis-field-info/index.js +1 -0
- package/dist/components/arcgis-field-info/utils/basic.d.ts +3 -1
- package/dist/components/arcgis-field-pick-list/customElement.d.ts +15 -12
- package/dist/components/arcgis-field-pick-list/customElement.js +206 -123
- package/dist/components/arcgis-field-pick-list/index.js +4 -3
- package/dist/components/arcgis-field-pick-list/utils/types.d.ts +3 -1
- package/dist/components/arcgis-histogram/customElement.d.ts +39 -2
- package/dist/components/arcgis-histogram/customElement.js +106 -91
- package/dist/components/arcgis-label-input/customElement.js +19 -15
- package/dist/components/arcgis-picker-input/customElement.js +1 -1
- package/dist/components/arcgis-ramp-color/customElement.js +1 -1
- package/dist/components/arcgis-ramp-color-break/customElement.js +1 -1
- package/dist/components/arcgis-ramp-opacity/customElement.js +1 -1
- package/dist/components/arcgis-slider/customElement.d.ts +11 -3
- package/dist/components/arcgis-slider/customElement.js +372 -349
- package/dist/components/arcgis-slider-field/customElement.d.ts +298 -0
- package/dist/components/arcgis-slider-field/customElement.js +96 -0
- package/dist/components/arcgis-slider-field/index.d.ts +1 -0
- package/dist/components/arcgis-slider-field/index.js +2 -0
- package/dist/components/arcgis-slider-histogram-range/customElement.d.ts +390 -0
- package/dist/components/arcgis-slider-histogram-range/customElement.js +120 -0
- package/dist/components/arcgis-slider-histogram-range/index.d.ts +1 -0
- package/dist/components/arcgis-slider-histogram-range/index.js +3 -0
- package/dist/components/arcgis-slider-histogram-range/types.d.ts +6 -0
- package/dist/components/arcgis-slider-input/customElement.js +1 -1
- package/dist/components/arcgis-ticks/customElement.d.ts +11 -3
- package/dist/components/arcgis-ticks/customElement.js +101 -80
- package/dist/components/arcgis-toolbar/customElement.d.ts +67 -0
- package/dist/components/arcgis-toolbar/customElement.js +108 -0
- package/dist/components/arcgis-toolbar/index.d.ts +1 -0
- package/dist/components/arcgis-toolbar/index.js +2 -0
- package/dist/components/arcgis-toolbar/types.d.ts +41 -0
- package/dist/components/arcgis-toolbar-action/customElement.d.ts +97 -0
- package/dist/components/arcgis-toolbar-action/customElement.js +52 -0
- package/dist/components/arcgis-toolbar-action/index.d.ts +1 -0
- package/dist/components/arcgis-toolbar-action/index.js +3 -0
- package/dist/components/arcgis-toolbar-group/customElement.d.ts +38 -0
- package/dist/components/arcgis-toolbar-group/customElement.js +48 -0
- package/dist/components/arcgis-toolbar-group/index.d.ts +1 -0
- package/dist/components/arcgis-toolbar-group/index.js +2 -0
- package/dist/components/arcgis-toolbar-item/customElement.d.ts +83 -0
- package/dist/components/arcgis-toolbar-item/customElement.js +42 -0
- package/dist/components/arcgis-toolbar-item/index.d.ts +1 -0
- package/dist/components/arcgis-toolbar-item/index.js +4 -0
- package/dist/components/arcgis-toolbar-more-button/customElement.d.ts +52 -0
- package/dist/components/arcgis-toolbar-more-button/customElement.js +68 -0
- package/dist/components/arcgis-toolbar-more-button/index.d.ts +1 -0
- package/dist/components/arcgis-toolbar-more-button/index.js +6 -0
- package/dist/components/arcgis-toolbar-split-button/customElement.d.ts +51 -0
- package/dist/components/arcgis-toolbar-split-button/customElement.js +67 -0
- package/dist/components/arcgis-toolbar-split-button/index.d.ts +1 -0
- package/dist/components/arcgis-toolbar-split-button/index.js +6 -0
- package/dist/components/arcgis-toolbar-stack/customElement.d.ts +48 -0
- package/dist/components/arcgis-toolbar-stack/customElement.js +174 -0
- package/dist/components/arcgis-toolbar-stack/index.d.ts +1 -0
- package/dist/components/arcgis-toolbar-stack/index.js +1 -0
- package/dist/components/arcgis-unique-values-list/customElement.js +116 -96
- package/dist/components/arcgis-value-picker/customElement.js +6 -6
- package/dist/components/arcgis-value-picker-collection/customElement.js +1 -1
- package/dist/components/arcgis-value-picker-combobox/customElement.js +1 -1
- package/dist/components/arcgis-value-picker-label/customElement.js +1 -1
- package/dist/components/arcgis-value-picker-slider/customElement.js +1 -1
- package/dist/docs/api.json +1 -1
- package/dist/docs/docs.json +1 -1
- package/dist/docs/vscode.css-custom-data.json +1 -1
- package/dist/docs/vscode.html-custom-data.json +1 -1
- package/dist/docs/web-types.json +1 -1
- package/dist/index.d.ts +62 -0
- package/dist/index.js +3 -1
- package/dist/loader.js +14 -5
- package/dist/types/lumina.d.ts +58 -2
- package/dist/types/preact.d.ts +67 -2
- package/dist/types/react.d.ts +76 -2
- package/dist/types/stencil.d.ts +60 -4
- package/dist/utils/types.d.ts +14 -1
- package/package.json +6 -6
- package/dist/cdn/2XA6O2MP.js +0 -2
- package/dist/cdn/4BJYJUMR.js +0 -2
- package/dist/cdn/5U5NQ3F5.js +0 -2
- package/dist/cdn/77HZGUSC.js +0 -2
- package/dist/cdn/A3CISHRB.js +0 -2
- package/dist/cdn/AFBKMYU6.js +0 -4
- package/dist/cdn/IUJ4ILLQ.js +0 -2
- package/dist/cdn/JPD7Z3MB.js +0 -2
- package/dist/cdn/LB7I345F.js +0 -2
- package/dist/cdn/LBD3GPSD.js +0 -2
- package/dist/cdn/MCH3WQ4X.js +0 -2
- package/dist/cdn/N7C4DINF.js +0 -2
- package/dist/cdn/NKMDS2IH.js +0 -2
- package/dist/cdn/PSITQBDP.js +0 -2
- package/dist/cdn/TXYPZ6MB.js +0 -2
- package/dist/cdn/WLYFLEI6.js +0 -2
- package/dist/cdn/assets/coordinate-system-picker/t9n/messages.en-US.json +0 -1
|
@@ -0,0 +1,390 @@
|
|
|
1
|
+
/// <reference path="../../index.d.ts" />
|
|
2
|
+
import type Color from "@arcgis/core/Color.js";
|
|
3
|
+
import type { PublicLitElement as LitElement } from "@arcgis/lumina";
|
|
4
|
+
import type { LabelFormatter } from "./types.js";
|
|
5
|
+
import type { FieldSliderType } from "../arcgis-slider-field/customElement.js";
|
|
6
|
+
import type { DataLine } from "../arcgis-histogram/types.js";
|
|
7
|
+
import type { HistogramBin, HistogramResult, SummaryStatisticsResult } from "@arcgis/core/smartMapping/statistics/types.js";
|
|
8
|
+
import type { ArcgisSlider } from "../arcgis-slider/customElement.js";
|
|
9
|
+
import type { CssSyntax } from "@arcgis/lumina/utils/cssSyntax";
|
|
10
|
+
|
|
11
|
+
declare module "@arcgis/lumina" {
|
|
12
|
+
export interface DeclareCssProperties {
|
|
13
|
+
/**
|
|
14
|
+
* Specifies the height of the histogram.
|
|
15
|
+
*
|
|
16
|
+
* @since 5.2
|
|
17
|
+
*/
|
|
18
|
+
"--arcgis-slider-histogram-range-histogram-height": CssSyntax<"length">;
|
|
19
|
+
}
|
|
20
|
+
}
|
|
21
|
+
|
|
22
|
+
/**
|
|
23
|
+
* A slider component with a histogram that can be used for filtering data. This component uses its [fieldType](https://developers.arcgis.com/javascript/latest/references/common-components/components/arcgis-slider-histogram-range/#fieldType) property
|
|
24
|
+
* to support numeric and temporal datasets, where values associated with a given [fieldType](https://developers.arcgis.com/javascript/latest/references/common-components/components/arcgis-slider-histogram-range/#fieldType) are parsed into numbers
|
|
25
|
+
* that can be used for rendering the histogram and slider. Those values are then serialized back into strings for component properties and readable labels. Much of this work can be
|
|
26
|
+
* done by the component so the user does not have to manually set component properties. The resulting object from passing the target layer and field to the
|
|
27
|
+
* [histogram()](https://developers.arcgis.com/javascript/latest/references/core/smartMapping/statistics/histogram/#histogram) and
|
|
28
|
+
* [summaryStatistics()](https://developers.arcgis.com/javascript/latest/references/core/smartMapping/statistics/summaryStatistics/#summaryStatistics) functions can
|
|
29
|
+
* be passed to the [updateFromHistogramResult()](https://developers.arcgis.com/javascript/latest/references/common-components/components/arcgis-slider-histogram-range/#updateFromHistogramResult) method to automatically set the component's
|
|
30
|
+
* [bins](https://developers.arcgis.com/javascript/latest/references/common-components/components/arcgis-slider-histogram-range/#bins), [average](https://developers.arcgis.com/javascript/latest/references/common-components/components/arcgis-slider-histogram-range/#average), and [standardDeviation](https://developers.arcgis.com/javascript/latest/references/common-components/components/arcgis-slider-histogram-range/#standardDeviation)
|
|
31
|
+
* properties, as well as set the [min](https://developers.arcgis.com/javascript/latest/references/common-components/components/arcgis-slider-histogram-range/#min) and [max](https://developers.arcgis.com/javascript/latest/references/common-components/components/arcgis-slider-histogram-range/#max) bounds for the component.
|
|
32
|
+
*
|
|
33
|
+
* Note that when setting properties manually (such as setting the [values](https://developers.arcgis.com/javascript/latest/references/common-components/components/arcgis-slider-histogram-range/#values) property to place thumbs on the slider),
|
|
34
|
+
* the component expects the inputs to match the format that would be expected by the [fieldType](https://developers.arcgis.com/javascript/latest/references/common-components/components/arcgis-slider-histogram-range/#fieldType). Below are a few relevant examples
|
|
35
|
+
*
|
|
36
|
+
* @example
|
|
37
|
+
* ```js
|
|
38
|
+
* // fieldType === "double"
|
|
39
|
+
* histogramSlider.values = "20.5, 75.25";
|
|
40
|
+
*
|
|
41
|
+
* // fieldType === "date"
|
|
42
|
+
* histogramSlider.values = "1710028800000, 1726617600000";
|
|
43
|
+
*
|
|
44
|
+
* // fieldType === "date-only"
|
|
45
|
+
* histogramSlider.values = "2024-03-10, 2024-09-18";
|
|
46
|
+
*
|
|
47
|
+
* // fieldType === "time-only"
|
|
48
|
+
* histogramSlider.values = "08:15:00, 17:45:00";
|
|
49
|
+
*
|
|
50
|
+
* // fieldType === "timestamp-offset"
|
|
51
|
+
* histogramSlider.values = "2024-03-10T08:00:00-05:00, 2024-09-18T18:30:00-05:00";
|
|
52
|
+
* ```
|
|
53
|
+
*
|
|
54
|
+
* <span id="image-annotations"></span>
|
|
55
|
+
* See the image below for a summary of the configurable options available on this slider.
|
|
56
|
+
*
|
|
57
|
+
* 
|
|
58
|
+
* @see [arcgis-histogram](https://developers.arcgis.com/javascript/latest/references/common-components/components/arcgis-histogram/)
|
|
59
|
+
* @see [arcgis-slider](https://developers.arcgis.com/javascript/latest/references/common-components/components/arcgis-slider/)
|
|
60
|
+
* @see [updateFromHistogramResult()](https://developers.arcgis.com/javascript/latest/references/common-components/components/arcgis-slider-histogram-range/#updateFromHistogramResult)
|
|
61
|
+
* @see [Field.type](https://developers.arcgis.com/javascript/latest/references/core/layers/support/Field/#type)
|
|
62
|
+
* @since 5.2
|
|
63
|
+
*/
|
|
64
|
+
export abstract class ArcgisSliderHistogramRange extends LitElement {
|
|
65
|
+
/**
|
|
66
|
+
* The active value of the component, based on which thumb or range (segment) is active. This returns the stored value for the active thumb,
|
|
67
|
+
* so it may reflect the thumb’s last set position.
|
|
68
|
+
*
|
|
69
|
+
* It returns:
|
|
70
|
+
* - `undefined` when no value is active
|
|
71
|
+
* - a serialized string when a single value is active
|
|
72
|
+
* - `"all"` when the range (segment) is active
|
|
73
|
+
*
|
|
74
|
+
* Listen to [@arcgisActiveValueChange](https://developers.arcgis.com/javascript/latest/references/common-components/components/arcgis-slider-histogram-range/#event-arcgisActiveValueChange) to be notified when a value becomes active or inactive.
|
|
75
|
+
*/
|
|
76
|
+
get activeValue(): string | undefined;
|
|
77
|
+
/**
|
|
78
|
+
* The statistical average of the data in the histogram. You would typically get this value from the `avg` property of
|
|
79
|
+
* [SummaryStatisticsResult](https://developers.arcgis.com/javascript/latest/references/core/smartMapping/statistics/summaryStatistics/#SummaryStatisticsResult),
|
|
80
|
+
* which is the result of the
|
|
81
|
+
* [summaryStatistics](https://developers.arcgis.com/javascript/latest/references/core/smartMapping/statistics/summaryStatistics/#summaryStatistics) function.
|
|
82
|
+
*
|
|
83
|
+
* When set, this value will render on the histogram with a symbol indicating it is the average.
|
|
84
|
+
*
|
|
85
|
+
* @see [summaryStatistics](https://developers.arcgis.com/javascript/latest/references/core/smartMapping/statistics/summaryStatistics/#summaryStatistics)
|
|
86
|
+
* @example
|
|
87
|
+
* ```js
|
|
88
|
+
* // Uses the summaryStatistics() function to compute the average value of a field
|
|
89
|
+
* const params = { layer, field: "POPULATION" };
|
|
90
|
+
*
|
|
91
|
+
* const statistics = await summaryStatistics(params);
|
|
92
|
+
*
|
|
93
|
+
* histogramSlider.average = statistics.avg;
|
|
94
|
+
* ```
|
|
95
|
+
*/
|
|
96
|
+
accessor average: number | undefined;
|
|
97
|
+
/**
|
|
98
|
+
* An array of objects representing each bin in the histogram. This
|
|
99
|
+
* information is typically returned from the
|
|
100
|
+
* [histogram](https://developers.arcgis.com/javascript/latest/references/core/smartMapping/statistics/histogram/#histogram) function.
|
|
101
|
+
*
|
|
102
|
+
* @example
|
|
103
|
+
* ```js
|
|
104
|
+
* // Sets the bins of the histogram from the bins in the histogram() result
|
|
105
|
+
* const params = { layer, field: "POPULATION" };
|
|
106
|
+
*
|
|
107
|
+
* const histogramResult = await histogram(params);
|
|
108
|
+
*
|
|
109
|
+
* await histogramSlider.updateFromHistogramResult(histogramResult);
|
|
110
|
+
* ```
|
|
111
|
+
* @example
|
|
112
|
+
* ```js
|
|
113
|
+
* // Creates a histogram with 7 bins.
|
|
114
|
+
* histogramSlider.bins = [
|
|
115
|
+
* { minValue: 0, maxValue: 10, count: 4 },
|
|
116
|
+
* { minValue: 11, maxValue: 20, count: 14 },
|
|
117
|
+
* { minValue: 21, maxValue: 30, count: 9 },
|
|
118
|
+
* { minValue: 31, maxValue: 40, count: 34 },
|
|
119
|
+
* { minValue: 41, maxValue: 50, count: 351 },
|
|
120
|
+
* { minValue: 51, maxValue: 60, count: 100 },
|
|
121
|
+
* { minValue: 61, maxValue: 70, count: 1 }
|
|
122
|
+
* ];
|
|
123
|
+
* ```
|
|
124
|
+
* @see [histogram](https://developers.arcgis.com/javascript/latest/references/core/smartMapping/statistics/histogram/#histogram)
|
|
125
|
+
*/
|
|
126
|
+
accessor bins: HistogramBin[] | undefined;
|
|
127
|
+
/**
|
|
128
|
+
* Renders lines on the histogram that indicate important or meaningful values to the end user. Set the [average](https://developers.arcgis.com/javascript/latest/references/common-components/components/arcgis-slider-histogram-range/#average)
|
|
129
|
+
* and [standardDeviation](https://developers.arcgis.com/javascript/latest/references/common-components/components/arcgis-slider-histogram-range/#standardDeviation) properties to display unique data lines for the mean and each standard deviation interval
|
|
130
|
+
* defined by [standardDeviationCount](https://developers.arcgis.com/javascript/latest/references/common-components/components/arcgis-slider-histogram-range/#standardDeviationCount).
|
|
131
|
+
*
|
|
132
|
+
* @example
|
|
133
|
+
* ```js
|
|
134
|
+
* // Will render lines at the 25th, 50th, 75th, and 99th percentiles
|
|
135
|
+
* histogramSlider.dataLines = [{
|
|
136
|
+
* value: 30,
|
|
137
|
+
* label: "25 pctl"
|
|
138
|
+
* }, {
|
|
139
|
+
* value: 45,
|
|
140
|
+
* label: "50 pctl"
|
|
141
|
+
* }, {
|
|
142
|
+
* value: 65,
|
|
143
|
+
* label: "75 pctl"
|
|
144
|
+
* }, {
|
|
145
|
+
* value: 89,
|
|
146
|
+
* label: "99 pctl"
|
|
147
|
+
* }];
|
|
148
|
+
* ```
|
|
149
|
+
*/
|
|
150
|
+
accessor dataLines: DataLine[] | undefined;
|
|
151
|
+
/**
|
|
152
|
+
* Sets the color of the histogram bars that are excluded based on the specified
|
|
153
|
+
* [fillPlacement](https://developers.arcgis.com/javascript/latest/references/common-components/components/arcgis-slider-histogram-range/#fillPlacement). For example, when a fillPlacement of `between` is used,
|
|
154
|
+
* all bars **not** between the slider thumbs will be rendered with the color set here.
|
|
155
|
+
*
|
|
156
|
+
* To change the style of histogram bars representing included data based on the
|
|
157
|
+
* [fillPlacement](https://developers.arcgis.com/javascript/latest/references/common-components/components/arcgis-slider-histogram-range/#fillPlacement), use the [includedBarColor](https://developers.arcgis.com/javascript/latest/references/common-components/components/arcgis-slider-histogram-range/#includedBarColor) property.
|
|
158
|
+
*
|
|
159
|
+
* @example
|
|
160
|
+
* ```js
|
|
161
|
+
* histogramSlider.excludedBarColor = "black";
|
|
162
|
+
* ```
|
|
163
|
+
* @see [includedBarColor](https://developers.arcgis.com/javascript/latest/references/common-components/components/arcgis-slider-histogram-range/#includedBarColor)
|
|
164
|
+
* @see [fillPlacement](https://developers.arcgis.com/javascript/latest/references/common-components/components/arcgis-slider-histogram-range/#fillPlacement)
|
|
165
|
+
*/
|
|
166
|
+
accessor excludedBarColor: Color | undefined;
|
|
167
|
+
/**
|
|
168
|
+
* Defines the ArcGIS field type used to parse, format, and serialize slider values.
|
|
169
|
+
*
|
|
170
|
+
* Supported values:
|
|
171
|
+
* - Numeric: `small-integer`, `integer`, `big-integer`, `single`, `double`, `long`, `oid`
|
|
172
|
+
* - Temporal: `date`, `date-only`, `time-only`, `timestamp-offset`
|
|
173
|
+
*
|
|
174
|
+
* @default "double"
|
|
175
|
+
* @see [Field.type](https://developers.arcgis.com/javascript/latest/references/core/layers/support/Field/#type)
|
|
176
|
+
*/
|
|
177
|
+
accessor fieldType: FieldSliderType;
|
|
178
|
+
/**
|
|
179
|
+
* Controls where the filled segment is displayed on the slider track and histogram. Note that "between" and "not-between" will
|
|
180
|
+
* fall back to "start" if a single thumb slider is being used, and "start" and "end" will fall back to "between" for sliders with multiple thumbs.
|
|
181
|
+
*
|
|
182
|
+
* @default "start"
|
|
183
|
+
* @see [arcgis-slider.fillPlacement](https://developers.arcgis.com/javascript/latest/references/common-components/components/arcgis-slider/#fillPlacement)
|
|
184
|
+
*/
|
|
185
|
+
accessor fillPlacement: "between" | "end" | "none" | "not-between" | "start";
|
|
186
|
+
/**
|
|
187
|
+
* Sets the color of the histogram bars that are included based on the specified
|
|
188
|
+
* [fillPlacement](https://developers.arcgis.com/javascript/latest/references/common-components/components/arcgis-slider-histogram-range/#fillPlacement). For example, when a fillPlacement of `between` is used,
|
|
189
|
+
* all bars between the slider thumbs will be rendered with the color set here.
|
|
190
|
+
*
|
|
191
|
+
* To change the style of histogram bars representing included data based on the
|
|
192
|
+
* [fillPlacement](https://developers.arcgis.com/javascript/latest/references/common-components/components/arcgis-slider-histogram-range/#fillPlacement), use the [excludedBarColor](https://developers.arcgis.com/javascript/latest/references/common-components/components/arcgis-slider-histogram-range/#excludedBarColor) property.
|
|
193
|
+
*
|
|
194
|
+
* @example
|
|
195
|
+
* ```js
|
|
196
|
+
* histogramSlider.includedBarColor = "green";
|
|
197
|
+
* ```
|
|
198
|
+
* @see [excludedBarColor](https://developers.arcgis.com/javascript/latest/references/common-components/components/arcgis-slider-histogram-range/#excludedBarColor)
|
|
199
|
+
* @see [fillPlacement](https://developers.arcgis.com/javascript/latest/references/common-components/components/arcgis-slider-histogram-range/#fillPlacement)
|
|
200
|
+
*/
|
|
201
|
+
accessor includedBarColor: Color | undefined;
|
|
202
|
+
/** The component's default label. */
|
|
203
|
+
accessor label: string | undefined;
|
|
204
|
+
/**
|
|
205
|
+
* A function used to format labels. Overrides the default label formatter.
|
|
206
|
+
*
|
|
207
|
+
* @see [arcgis-slider.labelFormatter](https://developers.arcgis.com/javascript/latest/references/common-components/components/arcgis-slider/#labelFormatter)
|
|
208
|
+
* @see [arcgis-histogram.labelFormatter](https://developers.arcgis.com/javascript/latest/references/common-components/components/arcgis-histogram/#labelFormatter)
|
|
209
|
+
*/
|
|
210
|
+
accessor labelFormatter: LabelFormatter | undefined;
|
|
211
|
+
/**
|
|
212
|
+
* Determines the layout/orientation of the component. By default, the slider will render horizontally with the min value on the left side
|
|
213
|
+
* of the track.
|
|
214
|
+
*
|
|
215
|
+
* @default "horizontal"
|
|
216
|
+
*/
|
|
217
|
+
accessor layout: "horizontal" | "vertical";
|
|
218
|
+
/** The maximum value or upper bound of the slider. */
|
|
219
|
+
accessor max: string | undefined;
|
|
220
|
+
/** The minimum value or lower bound of the slider. */
|
|
221
|
+
accessor min: string | undefined;
|
|
222
|
+
/**
|
|
223
|
+
* When `true`, allows editing the min/max range labels with keyboard input.
|
|
224
|
+
*
|
|
225
|
+
* Applies only to: `small-integer`, `integer`, `big-integer`, `single`, `double`, `long`, `oid`.
|
|
226
|
+
*
|
|
227
|
+
* @default false
|
|
228
|
+
* @see [arcgis-slider.rangeLabelsEditingEnabled](https://developers.arcgis.com/javascript/latest/references/common-components/components/arcgis-slider/#rangeLabelsEditingEnabled)
|
|
229
|
+
*/
|
|
230
|
+
accessor rangeLabelsEditingEnabled: boolean;
|
|
231
|
+
/**
|
|
232
|
+
* Controls where min/max range labels are positioned relative to the track.
|
|
233
|
+
*
|
|
234
|
+
* @default "center"
|
|
235
|
+
* @see [arcgis-slider-field.showRangeLabels](https://developers.arcgis.com/javascript/latest/references/common-components/components/arcgis-slider-field/#showRangeLabels)
|
|
236
|
+
* @see [arcgis-slider.rangeLabelsPlacement](https://developers.arcgis.com/javascript/latest/references/common-components/components/arcgis-slider/#rangeLabelsPlacement)
|
|
237
|
+
*/
|
|
238
|
+
accessor rangeLabelsPlacement: ArcgisSlider["rangeLabelsPlacement"];
|
|
239
|
+
/**
|
|
240
|
+
* Indicates whether [min](https://developers.arcgis.com/javascript/latest/references/common-components/components/arcgis-slider-histogram-range/#min) and [max](https://developers.arcgis.com/javascript/latest/references/common-components/components/arcgis-slider-histogram-range/#max) range labels are visible on the slider.
|
|
241
|
+
*
|
|
242
|
+
* @default false
|
|
243
|
+
*/
|
|
244
|
+
accessor showRangeLabels: boolean;
|
|
245
|
+
/**
|
|
246
|
+
* The statistical standard deviation of the dataset. You would typically get this value from the `stddev` property of
|
|
247
|
+
* [SummaryStatisticsResult](https://developers.arcgis.com/javascript/latest/references/core/smartMapping/statistics/summaryStatistics/#SummaryStatisticsResult),
|
|
248
|
+
* which is the result of the
|
|
249
|
+
* [summaryStatistics](https://developers.arcgis.com/javascript/latest/references/core/smartMapping/statistics/summaryStatistics/#summaryStatistics) function.
|
|
250
|
+
*
|
|
251
|
+
* When set, multiples of this value will render on the histogram above and below the average with symbols indicating standard deviation intervals. The number of intervals
|
|
252
|
+
* rendered is determined by the [standardDeviationCount](https://developers.arcgis.com/javascript/latest/references/common-components/components/arcgis-slider-histogram-range/#standardDeviationCount) property.
|
|
253
|
+
*
|
|
254
|
+
* @see [summaryStatistics](https://developers.arcgis.com/javascript/latest/references/core/smartMapping/statistics/summaryStatistics/#summaryStatistics)
|
|
255
|
+
*/
|
|
256
|
+
accessor standardDeviation: number | undefined;
|
|
257
|
+
/**
|
|
258
|
+
* Indicates the number of standard deviation lines to render on the histogram from the [arcgis-histogram.average](https://developers.arcgis.com/javascript/latest/references/common-components/components/arcgis-histogram/#average).
|
|
259
|
+
*
|
|
260
|
+
* @default 1
|
|
261
|
+
* @example
|
|
262
|
+
* ```js
|
|
263
|
+
* // Will render lines for +σ, +2σ, +3σ, and -σ, -2σ, -3σ
|
|
264
|
+
* histogramSlider.standardDeviationCount = 3;
|
|
265
|
+
* ```
|
|
266
|
+
*/
|
|
267
|
+
accessor standardDeviationCount: number;
|
|
268
|
+
/**
|
|
269
|
+
* Controls when thumb value labels are displayed.
|
|
270
|
+
*
|
|
271
|
+
* - `"always"`: Always show labels.
|
|
272
|
+
* - `"auto"`: Show labels only during interaction.
|
|
273
|
+
* - `"hidden"`: Never show labels.
|
|
274
|
+
*
|
|
275
|
+
* @default "always"
|
|
276
|
+
* @see [arcgis-slider.valueLabelsDisplay](https://developers.arcgis.com/javascript/latest/references/common-components/components/arcgis-slider/#valueLabelsDisplay)
|
|
277
|
+
*/
|
|
278
|
+
accessor valueLabelsDisplay: ArcgisSlider["valueLabelsDisplay"];
|
|
279
|
+
/**
|
|
280
|
+
* When `true`, allows editing value labels with keyboard input.
|
|
281
|
+
*
|
|
282
|
+
* Applies only to: `small-integer`, `integer`, `big-integer`, `single`, `double`, `long`, `oid`.
|
|
283
|
+
*
|
|
284
|
+
* @default false
|
|
285
|
+
* @see [arcgis-slider.valueLabelsEditingEnabled](https://developers.arcgis.com/javascript/latest/references/common-components/components/arcgis-slider/#valueLabelsEditingEnabled)
|
|
286
|
+
*/
|
|
287
|
+
accessor valueLabelsEditingEnabled: boolean;
|
|
288
|
+
/**
|
|
289
|
+
* A comma delimited string representing absolute thumb positions on the slider.
|
|
290
|
+
* Each value must match the current format expected by the component's [fieldType](https://developers.arcgis.com/javascript/latest/references/common-components/components/arcgis-slider-histogram-range/#fieldType) property.
|
|
291
|
+
*
|
|
292
|
+
* @example
|
|
293
|
+
* ```js
|
|
294
|
+
* // fieldType === "double"
|
|
295
|
+
* histogramSlider.values = "20.5, 75.25";
|
|
296
|
+
* ```
|
|
297
|
+
*/
|
|
298
|
+
accessor values: string | undefined;
|
|
299
|
+
/** Permanently destroys the component. */
|
|
300
|
+
destroy(): Promise<void>;
|
|
301
|
+
/**
|
|
302
|
+
* Generates a SQL `WHERE` clause based on a given field and the slider's
|
|
303
|
+
* [fillPlacement](https://developers.arcgis.com/javascript/latest/references/common-components/components/arcgis-slider-histogram-range/#fillPlacement). This is a convenience function for data filtering
|
|
304
|
+
* or data queries. It is the user's responsibility to ensure that the [type](https://developers.arcgis.com/javascript/latest/references/core/layers/support/Field/#type)
|
|
305
|
+
* of the given field matches one of the available values of the component's [fieldType](https://developers.arcgis.com/javascript/latest/references/common-components/components/arcgis-slider-histogram-range/#fieldType).
|
|
306
|
+
*
|
|
307
|
+
* @param field
|
|
308
|
+
* @example
|
|
309
|
+
* ```js
|
|
310
|
+
* // Renders the component's histogram such that all bins between
|
|
311
|
+
* // the two slider thumbs are shaded with a blue color by default
|
|
312
|
+
* histogramSlider.fillPlacement = "between";
|
|
313
|
+
*
|
|
314
|
+
* // Filters the FeatureLayerView such that only features with
|
|
315
|
+
* // a particular field value that falls between the two slider thumbs are displayed
|
|
316
|
+
* layerView.filter = {
|
|
317
|
+
* where: await histogramSlider.generateWhereClause("POPULATION")
|
|
318
|
+
* }
|
|
319
|
+
* ```
|
|
320
|
+
*
|
|
321
|
+
* **Note:**
|
|
322
|
+
* If a single thumb slider has its [fillPlacement](https://developers.arcgis.com/javascript/latest/references/common-components/components/arcgis-slider-histogram-range/#fillPlacement) set to
|
|
323
|
+
* `"between"` or `"not-between"`, the generated clause will use `start` instead. Additionally, if a multi thumb slider has its
|
|
324
|
+
* [fillPlacement](https://developers.arcgis.com/javascript/latest/references/common-components/components/arcgis-slider-histogram-range/#fillPlacement) set to `"start"` or `"end"`, the generated clause will use `"between"` instead.
|
|
325
|
+
*/
|
|
326
|
+
generateWhereClause(field: string): Promise<string | undefined>;
|
|
327
|
+
/**
|
|
328
|
+
* A convenience function which allows the [bins](https://developers.arcgis.com/javascript/latest/references/common-components/components/arcgis-slider-histogram-range/#bins), [min](https://developers.arcgis.com/javascript/latest/references/common-components/components/arcgis-slider-histogram-range/#min),
|
|
329
|
+
* [max](https://developers.arcgis.com/javascript/latest/references/common-components/components/arcgis-slider-histogram-range/#max), [average](https://developers.arcgis.com/javascript/latest/references/common-components/components/arcgis-slider-histogram-range/#average), and
|
|
330
|
+
* [standardDeviation](https://developers.arcgis.com/javascript/latest/references/common-components/components/arcgis-slider-histogram-range/#standardDeviation) properties to be set automatically from the results of the
|
|
331
|
+
* [histogram()](https://developers.arcgis.com/javascript/latest/references/core/smartMapping/statistics/histogram/#histogram)
|
|
332
|
+
* and [summaryStatistics()](https://developers.arcgis.com/javascript/latest/references/core/smartMapping/statistics/summaryStatistics/#summaryStatistics) functions.
|
|
333
|
+
* The component will serialize these values based on the [fieldType](https://developers.arcgis.com/javascript/latest/references/common-components/components/arcgis-slider-histogram-range/#fieldType) property into a format that is expected by the slider.
|
|
334
|
+
*
|
|
335
|
+
* @param histogramResult
|
|
336
|
+
* @param statistics
|
|
337
|
+
* @example
|
|
338
|
+
* ```js
|
|
339
|
+
* const histogramResult = await histogram({
|
|
340
|
+
* layer,
|
|
341
|
+
* field: "POPULATION",
|
|
342
|
+
* numBins: 30,
|
|
343
|
+
* });
|
|
344
|
+
*
|
|
345
|
+
* const statistics = await summaryStatistics({
|
|
346
|
+
* layer,
|
|
347
|
+
* field: "POPULATION",
|
|
348
|
+
* });
|
|
349
|
+
*
|
|
350
|
+
* await histogramSlider.updateFromHistogramResult(histogramResult, statistics);
|
|
351
|
+
* ```
|
|
352
|
+
*/
|
|
353
|
+
updateFromHistogramResult(histogramResult: HistogramResult, statistics?: SummaryStatisticsResult): Promise<void>;
|
|
354
|
+
/**
|
|
355
|
+
* Fires when the [activeValue](https://developers.arcgis.com/javascript/latest/references/common-components/components/arcgis-slider-histogram-range/#activeValue) changes as a thumb or the range gains or loses focus.
|
|
356
|
+
* This event does not fire when [values](https://developers.arcgis.com/javascript/latest/references/common-components/components/arcgis-slider-histogram-range/#values) change.
|
|
357
|
+
* Use [@arcgisInput](https://developers.arcgis.com/javascript/latest/references/common-components/components/arcgis-slider-histogram-range/#event-arcgisInput) for continuous updates or
|
|
358
|
+
* [@arcgisChange](https://developers.arcgis.com/javascript/latest/references/common-components/components/arcgis-slider-histogram-range/#event-arcgisChange) when the interaction is committed.
|
|
359
|
+
*
|
|
360
|
+
* @see [arcgis-slider.activeValue](https://developers.arcgis.com/javascript/latest/references/common-components/components/arcgis-slider/#activeValue)
|
|
361
|
+
*/
|
|
362
|
+
readonly arcgisActiveValueChange: import("@arcgis/lumina").TargetedEvent<this, void>;
|
|
363
|
+
/**
|
|
364
|
+
* Fires when a thumb or range is released on the slider. Use [@arcgisInput](https://developers.arcgis.com/javascript/latest/references/common-components/components/arcgis-slider-histogram-range/#event-arcgisInput) for continuous updates during a drag.
|
|
365
|
+
*
|
|
366
|
+
* @see [arcgis-slider.@arcgisChange](https://developers.arcgis.com/javascript/latest/references/common-components/components/arcgis-slider/#event-arcgisChange)
|
|
367
|
+
*/
|
|
368
|
+
readonly arcgisChange: import("@arcgis/lumina").TargetedEvent<this, void>;
|
|
369
|
+
/**
|
|
370
|
+
* Fires continuously while the thumb or range is being dragged.
|
|
371
|
+
* This event can fire frequently; consider debouncing or throttling expensive work.
|
|
372
|
+
*
|
|
373
|
+
* @see [arcgis-slider.@arcgisInput](https://developers.arcgis.com/javascript/latest/references/common-components/components/arcgis-slider/#event-arcgisInput)
|
|
374
|
+
*/
|
|
375
|
+
readonly arcgisInput: import("@arcgis/lumina").TargetedEvent<this, void>;
|
|
376
|
+
/**
|
|
377
|
+
* Fires when the slider's range changes.
|
|
378
|
+
* This occurs when the user edits the [min](https://developers.arcgis.com/javascript/latest/references/common-components/components/arcgis-slider-histogram-range/#min) or
|
|
379
|
+
* [max](https://developers.arcgis.com/javascript/latest/references/common-components/components/arcgis-slider-histogram-range/#max) range labels (when enabled).
|
|
380
|
+
*
|
|
381
|
+
* @see [arcgis-slider.@arcgisRangeChange](https://developers.arcgis.com/javascript/latest/references/common-components/components/arcgis-slider/#event-arcgisRangeChange)
|
|
382
|
+
*/
|
|
383
|
+
readonly arcgisRangeChange: import("@arcgis/lumina").TargetedEvent<this, void>;
|
|
384
|
+
readonly "@eventTypes": {
|
|
385
|
+
arcgisActiveValueChange: ArcgisSliderHistogramRange["arcgisActiveValueChange"]["detail"];
|
|
386
|
+
arcgisChange: ArcgisSliderHistogramRange["arcgisChange"]["detail"];
|
|
387
|
+
arcgisInput: ArcgisSliderHistogramRange["arcgisInput"]["detail"];
|
|
388
|
+
arcgisRangeChange: ArcgisSliderHistogramRange["arcgisRangeChange"]["detail"];
|
|
389
|
+
};
|
|
390
|
+
}
|
|
@@ -0,0 +1,120 @@
|
|
|
1
|
+
/* COPYRIGHT Esri - https://js.arcgis.com/1.0/LICENSE.txt */
|
|
2
|
+
import { c } from "../../chunks/runtime.js";
|
|
3
|
+
import { sqlName as p, sqlLiteral as b } from "@arcgis/core/core/sql.js";
|
|
4
|
+
import { LitElement as v, createEvent as d, safeStyleMap as f } from "@arcgis/lumina";
|
|
5
|
+
import { css as $, html as y } from "lit";
|
|
6
|
+
import { createRef as V, ref as x } from "lit/directives/ref.js";
|
|
7
|
+
import { g as u } from "../../chunks/strategies.js";
|
|
8
|
+
import { u as E } from "../../chunks/useT9n.js";
|
|
9
|
+
const L = $`:host{display:block;height:100%;width:100%}arcgis-histogram{align-self:flex-end;height:var(--arcgis-slider-histogram-range-histogram-height, 100%);width:100%}`;
|
|
10
|
+
class C extends v {
|
|
11
|
+
constructor() {
|
|
12
|
+
super(...arguments), this.#e = V(), this.#a = (e, i, o) => {
|
|
13
|
+
const h = (a) => u(this.fieldType).format(this.#t._lang, a, "value", o) ?? o(a);
|
|
14
|
+
return this.labelFormatter?.(e, i, h) ?? h(e);
|
|
15
|
+
}, this.#t = E(), this.fieldType = "double", this.fillPlacement = "start", this.layout = "horizontal", this.rangeLabelsEditingEnabled = !1, this.rangeLabelsPlacement = "center", this.showRangeLabels = !1, this.standardDeviationCount = 1, this.valueLabelsDisplay = "always", this.valueLabelsEditingEnabled = !1, this.arcgisActiveValueChange = d({ cancelable: !1 }), this.arcgisChange = d({ cancelable: !1 }), this.arcgisInput = d({ cancelable: !1 }), this.arcgisRangeChange = d({ cancelable: !1 });
|
|
16
|
+
}
|
|
17
|
+
static {
|
|
18
|
+
this.properties = { activeValue: 32, average: 9, bins: 0, dataLines: 0, excludedBarColor: 0, fieldType: 1, fillPlacement: 1, includedBarColor: 0, label: 1, labelFormatter: 0, layout: 1, max: 1, min: 1, rangeLabelsEditingEnabled: 5, rangeLabelsPlacement: 1, showRangeLabels: 5, standardDeviation: 9, standardDeviationCount: 9, valueLabelsDisplay: 1, valueLabelsEditingEnabled: 5, values: 1 };
|
|
19
|
+
}
|
|
20
|
+
static {
|
|
21
|
+
this.styles = L;
|
|
22
|
+
}
|
|
23
|
+
#e;
|
|
24
|
+
#a;
|
|
25
|
+
#t;
|
|
26
|
+
get activeValue() {
|
|
27
|
+
return this.#e.value?.activeValue;
|
|
28
|
+
}
|
|
29
|
+
async destroy() {
|
|
30
|
+
await this.manager.destroy();
|
|
31
|
+
}
|
|
32
|
+
async generateWhereClause(e) {
|
|
33
|
+
const { fillPlacement: i, values: o } = this;
|
|
34
|
+
if (!o?.length)
|
|
35
|
+
return;
|
|
36
|
+
const h = u(this.fieldType), a = o.split(",").map((m) => m.trim()).filter((m) => m.length > 0), n = p(e), l = (m) => {
|
|
37
|
+
const s = h.parse(m);
|
|
38
|
+
return typeof s == "number" ? b(h.toFieldType(s), { type: this.fieldType }) : void 0;
|
|
39
|
+
}, t = a[0] ? l(a[0]) : void 0, r = a.length > 1 && a.at(-1) ? l(a.at(-1)) : void 0;
|
|
40
|
+
if (!(t == null || a.length > 1 && r == null))
|
|
41
|
+
switch (i) {
|
|
42
|
+
case "start":
|
|
43
|
+
return a.length > 1 ? `${n} BETWEEN ${t} AND ${r}` : `${n} <= ${t}`;
|
|
44
|
+
case "end":
|
|
45
|
+
return a.length > 1 ? `${n} BETWEEN ${t} AND ${r}` : `${n} >= ${t}`;
|
|
46
|
+
case "between":
|
|
47
|
+
return a.length > 1 ? `${n} BETWEEN ${t} AND ${r}` : `${n} <= ${t}`;
|
|
48
|
+
case "not-between":
|
|
49
|
+
return a.length > 1 ? `${n} NOT BETWEEN ${t} AND ${r}` : `${n} <= ${t}`;
|
|
50
|
+
case "none":
|
|
51
|
+
return "1=0";
|
|
52
|
+
default:
|
|
53
|
+
return;
|
|
54
|
+
}
|
|
55
|
+
}
|
|
56
|
+
async updateFromHistogramResult(e, i) {
|
|
57
|
+
const o = u(this.fieldType);
|
|
58
|
+
this.bins = e.bins, e.minValue != null && (this.min = o.serialize(e.minValue)), e.maxValue != null && (this.max = o.serialize(e.maxValue)), i && (this.average = i.avg ?? void 0, this.standardDeviation = i.stddev ?? void 0);
|
|
59
|
+
}
|
|
60
|
+
willUpdate(e) {
|
|
61
|
+
(e.has("fieldType") || e.has("max") || e.has("min") || e.has("values")) && this.#s();
|
|
62
|
+
}
|
|
63
|
+
#i() {
|
|
64
|
+
const { bins: e, values: i, fillPlacement: o } = this, h = e?.[0], a = e?.at(-1);
|
|
65
|
+
if (h == null || a == null || !i)
|
|
66
|
+
return;
|
|
67
|
+
const n = u(this.fieldType), l = i.split(",").map((m) => n.parse(m)).filter((m) => Number.isFinite(m)).sort((m, s) => m - s), t = l.at(0), r = l.at(-1);
|
|
68
|
+
if (!(t == null || r == null))
|
|
69
|
+
switch (o) {
|
|
70
|
+
case "start":
|
|
71
|
+
return l.length > 1 ? [{ minValue: t, maxValue: r }] : [{ minValue: h.minValue, maxValue: t }];
|
|
72
|
+
case "end":
|
|
73
|
+
return l.length > 1 ? [{ minValue: t, maxValue: r }] : [{ minValue: r, maxValue: a.maxValue }];
|
|
74
|
+
case "between":
|
|
75
|
+
return l.length > 1 ? [{ minValue: t, maxValue: r }] : [{ minValue: h.minValue, maxValue: t }];
|
|
76
|
+
case "not-between":
|
|
77
|
+
return l.length > 1 ? [
|
|
78
|
+
{ minValue: h.minValue, maxValue: t },
|
|
79
|
+
{ minValue: t, maxValue: r, color: "var(--arcgis-histogram-bar-color)" },
|
|
80
|
+
{ minValue: r, maxValue: a.maxValue }
|
|
81
|
+
] : [{ minValue: h.minValue, maxValue: t }];
|
|
82
|
+
default:
|
|
83
|
+
return;
|
|
84
|
+
}
|
|
85
|
+
}
|
|
86
|
+
#s() {
|
|
87
|
+
const e = u(this.fieldType), i = (this.values ?? "").split(",").map((s) => s.trim()).filter((s) => s.length > 0).map((s) => e.parse(s)).filter((s) => Number.isFinite(s)), o = e.parse(this.min ?? ""), h = e.parse(this.max ?? "");
|
|
88
|
+
let a = Number.isFinite(o) ? o : void 0, n = Number.isFinite(h) ? h : void 0;
|
|
89
|
+
a != null && n != null && a >= n && (a = void 0, n = void 0);
|
|
90
|
+
let l = e.resolveRange(i, a, n);
|
|
91
|
+
l.min >= l.max && (l = e.resolveRange(i, void 0, void 0));
|
|
92
|
+
const t = e.serialize(l.min), r = e.serialize(l.max), m = i.map((s) => Math.min(l.max, Math.max(l.min, s))).sort((s, g) => s - g).map((s) => e.serialize(s)).join(",");
|
|
93
|
+
t !== this.min && (this.min = t), r !== this.max && (this.max = r), m !== this.values && (this.values = m);
|
|
94
|
+
}
|
|
95
|
+
#l(e) {
|
|
96
|
+
e.stopPropagation(), this.values = e.currentTarget.values, this.arcgisInput.emit();
|
|
97
|
+
}
|
|
98
|
+
#n(e) {
|
|
99
|
+
e.stopPropagation();
|
|
100
|
+
const i = e.currentTarget;
|
|
101
|
+
this.min = i.min, this.max = i.max, this.values = i.values, this.arcgisRangeChange.emit();
|
|
102
|
+
}
|
|
103
|
+
#r(e) {
|
|
104
|
+
e.stopPropagation(), this.values = e.currentTarget.values, this.arcgisChange.emit();
|
|
105
|
+
}
|
|
106
|
+
#o(e) {
|
|
107
|
+
e.stopPropagation(), this.arcgisActiveValueChange.emit();
|
|
108
|
+
}
|
|
109
|
+
render() {
|
|
110
|
+
const e = u(this.fieldType), i = e.parse(this.min ?? ""), o = e.parse(this.max ?? "");
|
|
111
|
+
return y`<arcgis-slider-field .fieldType=${this.fieldType} .fillPlacement=${this.fillPlacement} .label=${this.label} .labelFormatter=${this.labelFormatter} .max=${this.max ?? ""} .min=${this.min ?? ""} .layout=${this.layout} @arcgisActiveValueChange=${this.#o} @arcgisChange=${this.#r} @arcgisInput=${this.#l} @arcgisRangeChange=${this.#n} .rangeLabelsEditingEnabled=${this.rangeLabelsEditingEnabled} .valueLabelsEditingEnabled=${this.valueLabelsEditingEnabled} .rangeLabelsPlacement=${this.rangeLabelsPlacement} .valueLabelsDisplay=${this.valueLabelsDisplay} .showRangeLabels=${this.showRangeLabels} .values=${this.values ?? ""} .valueLabelsPlacement=${this.layout === "horizontal" ? "end" : "start"} ${x(this.#e)}><arcgis-histogram .slot=${this.layout === "horizontal" ? "content-start" : "content-end"} .average=${this.average} .bins=${this.bins} .dataLines=${this.dataLines} .max=${o} .min=${i} .label=${this.label} .layout=${this.layout} .standardDeviation=${this.standardDeviation} .standardDeviationCount=${this.standardDeviationCount} color-blending-enabled .colorStops=${this.#i()} style=${f({
|
|
112
|
+
...this.includedBarColor && { "--arcgis-histogram-stop-color": this.includedBarColor.toCss() },
|
|
113
|
+
...this.excludedBarColor && { "--arcgis-histogram-bar-color": this.excludedBarColor.toCss() }
|
|
114
|
+
})} .labelFormatter=${this.#a}></arcgis-histogram></arcgis-slider-field>`;
|
|
115
|
+
}
|
|
116
|
+
}
|
|
117
|
+
c("arcgis-slider-histogram-range", C);
|
|
118
|
+
export {
|
|
119
|
+
C as ArcgisSliderHistogramRange
|
|
120
|
+
};
|
|
@@ -0,0 +1 @@
|
|
|
1
|
+
export * from "./customElement.js";
|
|
@@ -1,4 +1,4 @@
|
|
|
1
|
-
/* COPYRIGHT Esri - https://js.arcgis.com/
|
|
1
|
+
/* COPYRIGHT Esri - https://js.arcgis.com/1.0/LICENSE.txt */
|
|
2
2
|
import { c as d } from "../../chunks/runtime.js";
|
|
3
3
|
import { css as m, html as o } from "lit";
|
|
4
4
|
import { LitElement as b, createEvent as p } from "@arcgis/lumina";
|
|
@@ -2,6 +2,17 @@
|
|
|
2
2
|
import type { PublicLitElement as LitElement } from "@arcgis/lumina";
|
|
3
3
|
import type { Layout, TickMode, TickValues } from "./types.js";
|
|
4
4
|
|
|
5
|
+
declare module "@arcgis/lumina" {
|
|
6
|
+
export interface DeclareCssProperties {
|
|
7
|
+
/** Specifies the length of the ticks. */
|
|
8
|
+
"--arcgis-ticks-tick-length": "*";
|
|
9
|
+
/** Specifies the color of the ticks. */
|
|
10
|
+
"--arcgis-ticks-tick-color": "*";
|
|
11
|
+
/** Specifies the gap between the ticks and labels. */
|
|
12
|
+
"--arcgis-ticks-gap": "*";
|
|
13
|
+
}
|
|
14
|
+
}
|
|
15
|
+
|
|
5
16
|
/**
|
|
6
17
|
* The ticks component displays visual markers along a line to indicate scale, intervals, or specific values. It is often used in conjunction with the
|
|
7
18
|
* [Slider component](https://developers.arcgis.com/javascript/latest/references/common-components/components/arcgis-slider/). Ticks help users understand the
|
|
@@ -12,9 +23,6 @@ import type { Layout, TickMode, TickValues } from "./types.js";
|
|
|
12
23
|
* [interpolationExponent](https://developers.arcgis.com/javascript/latest/references/common-components/components/arcgis-ticks/#interpolationExponent). Ticks can be displayed in vertical or horizontal [layout](https://developers.arcgis.com/javascript/latest/references/common-components/components/arcgis-ticks/#layout), with optional [showLabels](https://developers.arcgis.com/javascript/latest/references/common-components/components/arcgis-ticks/#showLabels) and a [showBaseline](https://developers.arcgis.com/javascript/latest/references/common-components/components/arcgis-ticks/#showBaseline).
|
|
13
24
|
* The component can also be made [interactive](https://developers.arcgis.com/javascript/latest/references/common-components/components/arcgis-ticks/#interactive) to respond to user clicks on individual ticks. The [labelFormatter](https://developers.arcgis.com/javascript/latest/references/common-components/components/arcgis-ticks/#labelFormatter) property allows customization of tick label formatting.
|
|
14
25
|
*
|
|
15
|
-
* @cssproperty [--arcgis-ticks-tick-length] - Specifies the length of the ticks.
|
|
16
|
-
* @cssproperty [--arcgis-ticks-tick-color] - Specifies the color of the ticks.
|
|
17
|
-
* @cssproperty [--arcgis-ticks-gap] - Specifies the gap between the ticks and labels.
|
|
18
26
|
* @since 5.0
|
|
19
27
|
* @example
|
|
20
28
|
* The following example creates a vertical slider with ticks.
|