@arcgis/charts-components 6.0.0-next.4 → 6.0.0-next.40
This diff represents the content of publicly available package versions that have been released to one of the supported registries. The information contained in this diff is provided for informational purposes only and reflects changes between package versions as they appear in their respective public registries.
- package/dist/cdn/25GQ2WOU.js +2 -0
- package/dist/cdn/2CNLZPFO.js +2 -0
- package/dist/cdn/{HMZRDWG2.js → 2HC3GCXA.js} +27 -27
- package/dist/cdn/2IRI6FP7.js +2 -0
- package/dist/cdn/{WKF53DYD.js → 2JY4BULO.js} +1 -1
- package/dist/cdn/{OYUTQX4U.js → 2POSDCZH.js} +1 -1
- package/dist/cdn/2S3IMV7O.js +2 -0
- package/dist/cdn/2W6EH2HT.js +2 -0
- package/dist/cdn/{FKES55PK.js → 35MV6UPM.js} +1 -1
- package/dist/cdn/3642CP3R.js +2 -0
- package/dist/cdn/{H5VCT3XP.js → 36MF6B63.js} +1 -1
- package/dist/cdn/3YSNYETN.js +2 -0
- package/dist/cdn/3ZFAYKJQ.js +2 -0
- package/dist/cdn/52TVDV6J.js +2 -0
- package/dist/cdn/6KL6DV3E.js +2 -0
- package/dist/cdn/73YNQF72.js +2 -0
- package/dist/cdn/AGCK7Y3J.js +2 -0
- package/dist/cdn/AHDUDHZR.js +2 -0
- package/dist/cdn/AHPDMFQQ.js +2 -0
- package/dist/cdn/AMVPRTNI.js +2 -0
- package/dist/cdn/B2VFTKK6.js +2 -0
- package/dist/cdn/BIBYAKIS.js +4 -0
- package/dist/cdn/CBWKTXC5.js +2 -0
- package/dist/cdn/D4CBXK5J.js +2 -0
- package/dist/cdn/{OZSHGMU6.js → DH3CD2VT.js} +1 -1
- package/dist/cdn/DKMYO4GP.js +2 -0
- package/dist/cdn/{LPLMRI3E.js → DPNQLXLE.js} +1 -1
- package/dist/cdn/{732AMNPK.js → DVEX52DB.js} +1 -1
- package/dist/cdn/DXIZZBC3.js +4 -0
- package/dist/cdn/ESZG2ICM.js +2 -0
- package/dist/cdn/EYBYOHDN.js +2 -0
- package/dist/cdn/{6RGTAMGU.js → F2UUETR2.js} +1 -1
- package/dist/cdn/FKHPICOV.js +2 -0
- package/dist/cdn/{FM6F6ZYW.js → FKWL3PHQ.js} +1 -1
- package/dist/cdn/FLVDCXI5.js +2 -0
- package/dist/cdn/FVJHFMGW.js +2 -0
- package/dist/cdn/FWB3GJHP.js +2 -0
- package/dist/cdn/FWETNIKF.js +2 -0
- package/dist/cdn/H5VGO7ZZ.js +2 -0
- package/dist/cdn/HAXUUJKD.js +2 -0
- package/dist/cdn/{CLCHZMZ5.js → HEJIMSEP.js} +1 -1
- package/dist/cdn/{GE7CLC6K.js → HNUEP5UH.js} +2 -2
- package/dist/cdn/HTLTED56.js +2 -0
- package/dist/cdn/HXIF6BYN.js +2 -0
- package/dist/cdn/HYPA7F2W.js +2 -0
- package/dist/cdn/{V5Z75IQI.js → IBB72HGQ.js} +5 -5
- package/dist/cdn/IMNOJDGS.js +2 -0
- package/dist/cdn/{33LWKOPD.js → IWIBZTFJ.js} +1 -1
- package/dist/cdn/J5O323AF.js +2 -0
- package/dist/cdn/{MXTS44AG.js → J6XOSXEE.js} +1 -1
- package/dist/cdn/JWNZPKX7.js +2 -0
- package/dist/cdn/JXUSPONB.js +2 -0
- package/dist/cdn/{FNXREQOE.js → KH3XGJ6Z.js} +1 -1
- package/dist/cdn/KIDN7AE6.js +2 -0
- package/dist/cdn/{27C6PCQ2.js → KISYJDGT.js} +1 -1
- package/dist/cdn/KPG4VSFN.js +2 -0
- package/dist/cdn/KQXIXHLV.js +2 -0
- package/dist/cdn/KXKSKVSJ.js +2 -0
- package/dist/cdn/LAVDVQYZ.js +2 -0
- package/dist/cdn/LHMYCCGG.js +2 -0
- package/dist/cdn/LHYIQG2Q.js +2 -0
- package/dist/cdn/LYVMSY65.js +2 -0
- package/dist/cdn/{PIGINE4M.js → M7MSRLEE.js} +1 -1
- package/dist/cdn/MCK5B2BZ.js +2 -0
- package/dist/cdn/{S2BGEXZV.js → MNETNH5F.js} +1 -1
- package/dist/cdn/MNHJXGWB.js +2 -0
- package/dist/cdn/{QQFMQAJ3.js → MUDUWLYM.js} +1 -1
- package/dist/cdn/{2WQNU554.js → N3IQELQL.js} +1 -1
- package/dist/cdn/N4VKOGCE.js +2 -0
- package/dist/cdn/N6IQLOCY.js +2 -0
- package/dist/cdn/NQBZWHCV.js +2 -0
- package/dist/cdn/OAQNKLKH.js +2 -0
- package/dist/cdn/OEYCWE7U.js +2 -0
- package/dist/cdn/ON6KUQYR.js +2 -0
- package/dist/cdn/{INYMF2BQ.js → PDBNCJTF.js} +1 -1
- package/dist/cdn/PLEMHP2B.js +2 -0
- package/dist/cdn/PNMVOOAS.js +2 -0
- package/dist/cdn/{563H5HEV.js → Q63KS3AS.js} +1 -1
- package/dist/cdn/QBZEEHY7.js +2 -0
- package/dist/cdn/QE2PCHA4.js +2 -0
- package/dist/cdn/RAXTWSX7.js +2 -0
- package/dist/cdn/RFI6U64E.js +2 -0
- package/dist/cdn/RYKZNNAE.js +2 -0
- package/dist/cdn/RYSNUM3A.js +2 -0
- package/dist/cdn/S5LVF5UL.js +2 -0
- package/dist/cdn/S6G2OZSX.js +2 -0
- package/dist/cdn/SEAGEOR3.js +2 -0
- package/dist/cdn/SQHNAWY2.js +2 -0
- package/dist/cdn/SWE5OVAM.js +2 -0
- package/dist/cdn/{CUMXC4O4.js → UHIFEXWJ.js} +1 -1
- package/dist/cdn/UQHIV37J.js +2 -0
- package/dist/cdn/V564QSU3.js +2 -0
- package/dist/cdn/W34R4JQD.js +2 -0
- package/dist/cdn/{KK445MLC.js → W7TD4Z24.js} +1 -1
- package/dist/cdn/WSHSXWLF.js +2 -0
- package/dist/cdn/WT6Y3ALM.js +2 -0
- package/dist/cdn/X6JMBWG7.js +2 -0
- package/dist/cdn/XBFYV6W2.js +2 -0
- package/dist/cdn/XFHCIQYP.js +2 -0
- package/dist/cdn/XSQEK2DR.js +2 -0
- package/dist/cdn/{PQ3XCNCP.js → YDKVGUUH.js} +1 -1
- package/dist/cdn/YO7YSHP3.js +2 -0
- package/dist/cdn/Z2LXXRNV.js +2 -0
- package/dist/cdn/ZJAOAKQP.js +2 -0
- package/dist/cdn/{VSKK65CP.js → ZYZASO4B.js} +1 -1
- package/dist/cdn/index.js +1 -1
- package/dist/cdn/model/shared/setup-utils.js +1 -1
- package/dist/chart-rendering/common/interfaces.d.ts +7 -0
- package/dist/chunks/action-bar-utils.js +21 -23
- package/dist/chunks/axis-lines-symbol.js +6 -6
- package/dist/chunks/bar-chart-model.js +6 -8
- package/dist/chunks/box-plot-data.js +172 -171
- package/dist/chunks/box-plot-model.js +41 -39
- package/dist/chunks/chart-model.js +18 -20
- package/dist/chunks/chart-ui-utils.js +61 -63
- package/dist/chunks/chart-ui-utils2.js +1 -1
- package/dist/chunks/class-breaks.js +5 -5
- package/dist/chunks/combo-bar-line-chart-model.js +15 -16
- package/dist/chunks/data-labels-symbol.js +1 -1
- package/dist/chunks/data-labels-visibility.js +1 -1
- package/dist/chunks/data.js +51 -53
- package/dist/chunks/gauge-model.js +66 -66
- package/dist/chunks/generate-x-axis-title.js +17 -17
- package/dist/chunks/heat-chart-model.js +13 -14
- package/dist/chunks/histogram-data.js +41 -42
- package/dist/chunks/histogram-model.js +5 -5
- package/dist/chunks/index.js +5433 -4273
- package/dist/chunks/index2.js +1165 -871
- package/dist/chunks/index3.js +10987 -1173
- package/dist/chunks/index4.js +65 -11086
- package/dist/chunks/line-chart-model.js +18 -19
- package/dist/chunks/model-setter.js +6 -6
- package/dist/chunks/model-with-x-guides.js +1 -1
- package/dist/chunks/model-with-y-guides.js +25 -25
- package/dist/chunks/negative-values-stacked-to-baseline.js +6 -6
- package/dist/chunks/pie-chart-data.js +25 -27
- package/dist/chunks/pie-chart-model.js +166 -165
- package/dist/chunks/radar-chart-model.js +6 -7
- package/dist/chunks/resource.js +1 -1
- package/dist/chunks/rest-js-object-literals.js +5 -41
- package/dist/chunks/rotated-state.js +1 -1
- package/dist/chunks/rounded-corners.js +6 -6
- package/dist/chunks/scatterplot-model.js +75 -76
- package/dist/chunks/serial-chart-data.js +514 -514
- package/dist/chunks/serial-chart-model.js +64 -61
- package/dist/chunks/series-length.js +14 -14
- package/dist/chunks/series.js +1 -1
- package/dist/chunks/type-guards.js +109 -55
- package/dist/chunks/utils.js +146 -212
- package/dist/chunks/web-component-utils.js +69 -70
- package/dist/chunks/x-bounds.js +32 -33
- package/dist/components/arcgis-chart/customElement.d.ts +77 -23
- package/dist/components/arcgis-chart/customElement.js +9974 -9746
- package/dist/components/arcgis-charts-action-bar/customElement.js +8 -8
- package/dist/components/arcgis-charts-config-bar-chart/customElement.js +18 -18
- package/dist/components/arcgis-charts-config-bar-chart-data/customElement.js +63 -58
- package/dist/components/arcgis-charts-config-bar-chart-data/index.js +0 -1
- package/dist/components/arcgis-charts-config-bar-chart-popover/customElement.js +10 -11
- package/dist/components/arcgis-charts-config-bar-chart-series/customElement.js +51 -45
- package/dist/components/arcgis-charts-config-bar-chart-series-popover/customElement.js +2 -2
- package/dist/components/arcgis-charts-config-box-plot/customElement.js +1 -1
- package/dist/components/arcgis-charts-config-box-plot-data/customElement.js +115 -113
- package/dist/components/arcgis-charts-config-box-plot-data/index.js +0 -1
- package/dist/components/arcgis-charts-config-box-plot-popover/customElement.js +11 -12
- package/dist/components/arcgis-charts-config-box-plot-series/customElement.js +61 -54
- package/dist/components/arcgis-charts-config-box-plot-series-popover/customElement.js +1 -1
- package/dist/components/arcgis-charts-config-colors/customElement.js +2 -2
- package/dist/components/arcgis-charts-config-create-flow/customElement.js +186 -185
- package/dist/components/arcgis-charts-config-font-style/customElement.js +7 -7
- package/dist/components/arcgis-charts-config-format/customElement.js +96 -95
- package/dist/components/arcgis-charts-config-general/customElement.js +2 -2
- package/dist/components/arcgis-charts-config-guide/customElement.js +51 -50
- package/dist/components/arcgis-charts-config-guides/customElement.js +1 -1
- package/dist/components/arcgis-charts-config-heat-chart/customElement.js +1 -1
- package/dist/components/arcgis-charts-config-heat-chart-data/customElement.js +13 -14
- package/dist/components/arcgis-charts-config-heat-chart-popover/customElement.js +32 -33
- package/dist/components/arcgis-charts-config-histogram/customElement.js +2 -3
- package/dist/components/arcgis-charts-config-histogram-data/customElement.js +35 -32
- package/dist/components/arcgis-charts-config-histogram-popover/customElement.js +8 -9
- package/dist/components/arcgis-charts-config-invalid-input-message/customElement.js +1 -1
- package/dist/components/arcgis-charts-config-line-chart/customElement.js +1 -1
- package/dist/components/arcgis-charts-config-line-chart-data/customElement.js +21 -22
- package/dist/components/arcgis-charts-config-line-chart-data/index.js +0 -1
- package/dist/components/arcgis-charts-config-line-chart-popover/customElement.js +7 -8
- package/dist/components/arcgis-charts-config-line-chart-series/customElement.js +48 -43
- package/dist/components/arcgis-charts-config-line-chart-series-popover/customElement.js +1 -1
- package/dist/components/arcgis-charts-config-pie-chart/customElement.js +38 -34
- package/dist/components/arcgis-charts-config-pie-chart-data/customElement.js +21 -22
- package/dist/components/arcgis-charts-config-pie-chart-data/index.js +1 -1
- package/dist/components/arcgis-charts-config-pie-chart-popover/customElement.js +9 -10
- package/dist/components/arcgis-charts-config-pie-chart-slices/customElement.js +2 -2
- package/dist/components/arcgis-charts-config-pie-chart-slices-popover/customElement.js +1 -1
- package/dist/components/arcgis-charts-config-scatter-plot/customElement.js +3 -4
- package/dist/components/arcgis-charts-config-scatter-plot-aoi/customElement.js +20 -24
- package/dist/components/arcgis-charts-config-scatter-plot-data/customElement.js +81 -81
- package/dist/components/arcgis-charts-config-scatter-plot-popover/customElement.js +3 -4
- package/dist/components/arcgis-charts-config-select-chart-type-popover/customElement.js +21 -25
- package/dist/components/arcgis-charts-config-view-charts/customElement.js +20 -21
- package/dist/components/arcgis-charts-info-modal/customElement.js +4 -4
- package/dist/docs/api.json +1 -1
- package/dist/docs/docs.json +1 -1
- package/dist/docs/vscode.html-custom-data.json +1 -1
- package/dist/docs/web-types.json +1 -1
- package/dist/index.d.ts +1 -1
- package/dist/index.js +409 -415
- package/dist/interfaces.d.ts +1 -15
- package/dist/json-schema/index.d.ts +38 -68
- package/dist/loader.js +3 -3
- package/dist/model/box-plot-model/box-plot-model.d.ts +6 -2
- package/dist/model/heat-chart-model/heat-chart-model.d.ts +1 -1
- package/dist/model/mixins/model-with-multi-axes.d.ts +53 -2
- package/dist/model/pie-chart-model/pie-chart-model.d.ts +6 -2
- package/dist/model/properties/layer.d.ts +2 -2
- package/dist/model/serial-chart-model/serial-chart-model.d.ts +6 -2
- package/dist/spec/rest-js-object-literals.d.ts +0 -66
- package/dist/spec/rest-js-types.d.ts +1 -5
- package/dist/spec/web-chart.d.ts +2 -2
- package/dist/types/lumina.d.ts +3 -1
- package/dist/types/preact.d.ts +3 -1
- package/dist/types/react.d.ts +3 -1
- package/dist/types/stencil.d.ts +3 -1
- package/dist/utils/chart-config/converter/index.js +97 -99
- package/dist/utils/chart-config/utils/index.d.ts +10 -3
- package/dist/utils/components/interfaces.d.ts +7 -0
- package/dist/utils/data/categorical-data/index.d.ts +1 -0
- package/dist/utils/layer/index.d.ts +6 -6
- package/dist/utils/layer/interfaces.d.ts +13 -3
- package/dist/utils/layer/query-parser/index.d.ts +2 -2
- package/dist/utils/layer/utils/index.d.ts +6 -18
- package/dist/utils/misc/index.d.ts +4 -4
- package/package.json +8 -8
- package/dist/cdn/23NH4HLE.js +0 -2
- package/dist/cdn/2DRKIHTI.js +0 -2
- package/dist/cdn/2E3WHSEW.js +0 -2
- package/dist/cdn/2RG5JCBW.js +0 -3
- package/dist/cdn/2X2QOEKX.js +0 -2
- package/dist/cdn/37WXQO5B.js +0 -2
- package/dist/cdn/3INTJJ4X.js +0 -2
- package/dist/cdn/3RJNZA24.js +0 -2
- package/dist/cdn/4CU5D5WQ.js +0 -2
- package/dist/cdn/4WQUPC2P.js +0 -2
- package/dist/cdn/5DAVFUDX.js +0 -2
- package/dist/cdn/5VCTFSTZ.js +0 -2
- package/dist/cdn/5XGX5QH2.js +0 -2
- package/dist/cdn/6XH6ZRHO.js +0 -2
- package/dist/cdn/7WD2VKG4.js +0 -2
- package/dist/cdn/7YN565O4.js +0 -2
- package/dist/cdn/A2BFOCSN.js +0 -2
- package/dist/cdn/A5TI5TEO.js +0 -2
- package/dist/cdn/AHB4IS7P.js +0 -2
- package/dist/cdn/B6ADEFC7.js +0 -2
- package/dist/cdn/B6APNE72.js +0 -3
- package/dist/cdn/BDIRQUQE.js +0 -2
- package/dist/cdn/BWZA3447.js +0 -2
- package/dist/cdn/BZTSUXUT.js +0 -2
- package/dist/cdn/CFACTMRG.js +0 -2
- package/dist/cdn/D2LNPCIA.js +0 -2
- package/dist/cdn/D6WQTOUC.js +0 -2
- package/dist/cdn/DTSX7SEI.js +0 -2
- package/dist/cdn/EPFEFHM2.js +0 -2
- package/dist/cdn/EW2P4QSN.js +0 -2
- package/dist/cdn/GDJDA5MG.js +0 -2
- package/dist/cdn/GEPIPU4G.js +0 -2
- package/dist/cdn/GSCC3FON.js +0 -2
- package/dist/cdn/GXYGXB4U.js +0 -2
- package/dist/cdn/IEOIKLLK.js +0 -2
- package/dist/cdn/ISSUAEJS.js +0 -2
- package/dist/cdn/KJNBURYA.js +0 -2
- package/dist/cdn/L3AKSDIB.js +0 -2
- package/dist/cdn/L5MTHGFZ.js +0 -2
- package/dist/cdn/LHLPK6TU.js +0 -2
- package/dist/cdn/LXFY54NF.js +0 -2
- package/dist/cdn/MJUCIYQN.js +0 -2
- package/dist/cdn/NGBBNBA7.js +0 -2
- package/dist/cdn/NIZC75X3.js +0 -2
- package/dist/cdn/OBKDR3MU.js +0 -2
- package/dist/cdn/OQKL344Q.js +0 -2
- package/dist/cdn/OZSOICXE.js +0 -2
- package/dist/cdn/PBQRZBQM.js +0 -2
- package/dist/cdn/PT66VVXN.js +0 -2
- package/dist/cdn/QOENPUSD.js +0 -2
- package/dist/cdn/QPVBVDRP.js +0 -2
- package/dist/cdn/RGMPFNUN.js +0 -2
- package/dist/cdn/RGSJ3JFI.js +0 -2
- package/dist/cdn/RVHNFMTN.js +0 -2
- package/dist/cdn/RVQPEB4W.js +0 -2
- package/dist/cdn/RXTO6RE2.js +0 -2
- package/dist/cdn/SCEFJRON.js +0 -2
- package/dist/cdn/SEILP6QP.js +0 -2
- package/dist/cdn/SKI5Z6UH.js +0 -2
- package/dist/cdn/SSEWUPML.js +0 -2
- package/dist/cdn/TCE6PLHN.js +0 -2
- package/dist/cdn/TOCU6UKM.js +0 -2
- package/dist/cdn/TSASF4ZC.js +0 -2
- package/dist/cdn/UDAJILEU.js +0 -2
- package/dist/cdn/UZOYADSB.js +0 -2
- package/dist/cdn/W2PTHYOT.js +0 -2
- package/dist/cdn/W53DMMGZ.js +0 -2
- package/dist/cdn/WAQJ7V62.js +0 -2
- package/dist/cdn/WEPXOYBS.js +0 -2
- package/dist/cdn/WLPUBXN7.js +0 -2
- package/dist/cdn/XPCXTKEY.js +0 -2
- package/dist/cdn/Y2S7EWZR.js +0 -2
- package/dist/cdn/YF6ML4P6.js +0 -4
- package/dist/cdn/YGLBPPXP.js +0 -2
- package/dist/cdn/YWUNLBCQ.js +0 -2
- package/dist/cdn/YYTAWATK.js +0 -2
- package/dist/cdn/ZDQWMMOA.js +0 -2
- package/dist/cdn/ZFHMGE36.js +0 -2
- package/dist/cdn/ZGNJFT7B.js +0 -2
- package/dist/cdn/ZMVIOIBB.js +0 -2
- package/dist/cdn/ZTHSDPEH.js +0 -2
- package/dist/chunks/index5.js +0 -69
- package/dist/chunks/type-guards2.js +0 -113
- package/dist/chunks/utils2.js +0 -63
- /package/dist/cdn/{XFEWDUTX.js → 2PUVZIJ6.js} +0 -0
- /package/dist/cdn/{UHSL7Y3B.js → 33NEGHM6.js} +0 -0
- /package/dist/cdn/{6FW2SXLC.js → 55OFHBXV.js} +0 -0
- /package/dist/cdn/{SMHUUBEU.js → 5OSVKP4N.js} +0 -0
- /package/dist/cdn/{VITUV4HV.js → 5QLZ66AU.js} +0 -0
- /package/dist/cdn/{UQRD2CTK.js → 5SOADBYD.js} +0 -0
- /package/dist/cdn/{55DRYT5X.js → 5ZZZKI7V.js} +0 -0
- /package/dist/cdn/{5ANJA54O.js → 6IIBIZJH.js} +0 -0
- /package/dist/cdn/{QLBO3URO.js → 6QY2OFUO.js} +0 -0
- /package/dist/cdn/{UITA7CSN.js → 7AWJIBMG.js} +0 -0
- /package/dist/cdn/{OTV3YYDU.js → 7JMZPDM5.js} +0 -0
- /package/dist/cdn/{373UZR4I.js → 7N2LSD5J.js} +0 -0
- /package/dist/cdn/{SCS4MWFN.js → A6DV5ILW.js} +0 -0
- /package/dist/cdn/{VT3NOR5A.js → BGHJMVNV.js} +0 -0
- /package/dist/cdn/{L4KDCWA7.js → BGVIOGAX.js} +0 -0
- /package/dist/cdn/{Z2IHEWWP.js → CYZPIC2B.js} +0 -0
- /package/dist/cdn/{AVRIN2FL.js → CZKZMSFJ.js} +0 -0
- /package/dist/cdn/{WMGJN3JL.js → D66GTKJ7.js} +0 -0
- /package/dist/cdn/{XR7RCGIT.js → DJGQM3EK.js} +0 -0
- /package/dist/cdn/{PQESGESY.js → FOHR4IFG.js} +0 -0
- /package/dist/cdn/{3DDSV3IF.js → GOVIUHKT.js} +0 -0
- /package/dist/cdn/{KE7XE22Z.js → H44RQIWN.js} +0 -0
- /package/dist/cdn/{W7VPVF72.js → HJUHYEJT.js} +0 -0
- /package/dist/cdn/{57RWTLRG.js → HL6ANDJH.js} +0 -0
- /package/dist/cdn/{HUU3QFFC.js → IDVYAUPY.js} +0 -0
- /package/dist/cdn/{XIE5EUIH.js → IQSNWDU6.js} +0 -0
- /package/dist/cdn/{K43DVQFC.js → JE32QM44.js} +0 -0
- /package/dist/cdn/{52PHJCYM.js → JETTF7E2.js} +0 -0
- /package/dist/cdn/{L26HYK34.js → JSOFN65T.js} +0 -0
- /package/dist/cdn/{LE3B3ATZ.js → KMZIRJIR.js} +0 -0
- /package/dist/cdn/{XUSFQDK4.js → KQ36C2RK.js} +0 -0
- /package/dist/cdn/{O6GVF76X.js → KRRYFLG4.js} +0 -0
- /package/dist/cdn/{4MSDOPVE.js → M4AD4UJU.js} +0 -0
- /package/dist/cdn/{2BPLDZAJ.js → NUH2GAPZ.js} +0 -0
- /package/dist/cdn/{Q4H5YVTW.js → OWEVDN6C.js} +0 -0
- /package/dist/cdn/{GCUOASRZ.js → QCFAV626.js} +0 -0
- /package/dist/cdn/{R4PFJLD2.js → QMBHZ5JE.js} +0 -0
- /package/dist/cdn/{J5VMBGYI.js → SWHSL245.js} +0 -0
- /package/dist/cdn/{C7VQM4TH.js → T7LKXFIZ.js} +0 -0
- /package/dist/cdn/{KCP6AJV7.js → XQTLPFTW.js} +0 -0
- /package/dist/cdn/{3VZK52LO.js → Z5DYKSTK.js} +0 -0
package/dist/interfaces.d.ts
CHANGED
|
@@ -10,20 +10,6 @@ import type { SupportedLocale } from "@arcgis/toolkit/intl";
|
|
|
10
10
|
import type { WebChartTemporalBinningUnits } from "./spec/chart-object-literals.js";
|
|
11
11
|
import type { List as List } from "@esri/calcite-components/components/calcite-list";
|
|
12
12
|
|
|
13
|
-
/**
|
|
14
|
-
* Supported layer types for feature charts.
|
|
15
|
-
*
|
|
16
|
-
* @deprecated since 5.2 - Use [ChartLayer](https://developers.arcgis.com/javascript/latest/references/charts-components/interfaces/#ChartLayer) or [ChartLayerInput](https://developers.arcgis.com/javascript/latest/references/charts-components/interfaces/#ChartLayerInput) instead.
|
|
17
|
-
*/
|
|
18
|
-
export type SupportedLayer = ChartLayer | SubtypeSublayer;
|
|
19
|
-
|
|
20
|
-
/**
|
|
21
|
-
* Supported layer types for imagery charts.
|
|
22
|
-
*
|
|
23
|
-
* @deprecated since 5.2 - use [ChartLayerInput](https://developers.arcgis.com/javascript/latest/references/charts-components/interfaces/#ChartLayerInput) instead.
|
|
24
|
-
*/
|
|
25
|
-
export type SupportedRasterLayer = ImageryLayer | ImageryTileLayer | WCSLayer;
|
|
26
|
-
|
|
27
13
|
/** FeatureLayer-like surface used by charts & model. */
|
|
28
14
|
export type ChartLayer = Layer
|
|
29
15
|
& {
|
|
@@ -58,7 +44,7 @@ export type ChartLayer = Layer
|
|
|
58
44
|
};
|
|
59
45
|
|
|
60
46
|
/** Layer input accepted by chart components and models. */
|
|
61
|
-
export type ChartLayerInput = ChartLayer | ChartLayerView | ImageryLayer | ImageryTileLayer | SubtypeSublayer |
|
|
47
|
+
export type ChartLayerInput = ChartLayer | ChartLayerView | ImageryLayer | ImageryTileLayer | SubtypeSublayer | WCSLayer;
|
|
62
48
|
|
|
63
49
|
/** Layer inputs accepted by chart models. Excludes ChartLayerView because models operate on layers rather than views. */
|
|
64
50
|
export type ChartLayerInputSansView = Exclude<ChartLayerInput, ChartLayerView>;
|
|
@@ -5271,72 +5271,6 @@
|
|
|
5271
5271
|
}[];
|
|
5272
5272
|
title: string;
|
|
5273
5273
|
};
|
|
5274
|
-
RESTFieldType: {
|
|
5275
|
-
type: string;
|
|
5276
|
-
enum: string[];
|
|
5277
|
-
title: string;
|
|
5278
|
-
};
|
|
5279
|
-
RESTSimpleLineSymbolStyle: {
|
|
5280
|
-
type: string;
|
|
5281
|
-
enum: string[];
|
|
5282
|
-
title: string;
|
|
5283
|
-
};
|
|
5284
|
-
RESTSimpleMarkerSymbolStyle: {
|
|
5285
|
-
type: string;
|
|
5286
|
-
enum: string[];
|
|
5287
|
-
title: string;
|
|
5288
|
-
};
|
|
5289
|
-
RESTSimpleFillSymbolStyle: {
|
|
5290
|
-
type: string;
|
|
5291
|
-
enum: string[];
|
|
5292
|
-
title: string;
|
|
5293
|
-
};
|
|
5294
|
-
RESTHorizontalAlignment: {
|
|
5295
|
-
type: string;
|
|
5296
|
-
enum: string[];
|
|
5297
|
-
deprecated: string;
|
|
5298
|
-
title: string;
|
|
5299
|
-
};
|
|
5300
|
-
RESTVerticalAlignment: {
|
|
5301
|
-
type: string;
|
|
5302
|
-
enum: string[];
|
|
5303
|
-
deprecated: string;
|
|
5304
|
-
title: string;
|
|
5305
|
-
};
|
|
5306
|
-
RESTFontStyle: {
|
|
5307
|
-
type: string;
|
|
5308
|
-
enum: string[];
|
|
5309
|
-
deprecated: string;
|
|
5310
|
-
title: string;
|
|
5311
|
-
};
|
|
5312
|
-
RESTFontWeight: {
|
|
5313
|
-
type: string;
|
|
5314
|
-
enum: string[];
|
|
5315
|
-
deprecated: string;
|
|
5316
|
-
title: string;
|
|
5317
|
-
};
|
|
5318
|
-
RESTFontDecoration: {
|
|
5319
|
-
type: string;
|
|
5320
|
-
enum: string[];
|
|
5321
|
-
deprecated: string;
|
|
5322
|
-
title: string;
|
|
5323
|
-
};
|
|
5324
|
-
RESTUnits: {
|
|
5325
|
-
type: string;
|
|
5326
|
-
enum: string[];
|
|
5327
|
-
deprecated: string;
|
|
5328
|
-
title: string;
|
|
5329
|
-
};
|
|
5330
|
-
RESTRendererType: {
|
|
5331
|
-
type: string;
|
|
5332
|
-
enum: string[];
|
|
5333
|
-
title: string;
|
|
5334
|
-
};
|
|
5335
|
-
RESTSymbolType: {
|
|
5336
|
-
type: string;
|
|
5337
|
-
enum: string[];
|
|
5338
|
-
title: string;
|
|
5339
|
-
};
|
|
5340
5274
|
ValueConversion: {
|
|
5341
5275
|
type: string;
|
|
5342
5276
|
properties: {
|
|
@@ -6483,6 +6417,12 @@
|
|
|
6483
6417
|
description: string;
|
|
6484
6418
|
title: string;
|
|
6485
6419
|
};
|
|
6420
|
+
QueryUnits: {
|
|
6421
|
+
type: string;
|
|
6422
|
+
enum: string[];
|
|
6423
|
+
description: string;
|
|
6424
|
+
title: string;
|
|
6425
|
+
};
|
|
6486
6426
|
WebChartSeriesQuery: {
|
|
6487
6427
|
$ref: string;
|
|
6488
6428
|
description: string;
|
|
@@ -8940,11 +8880,11 @@
|
|
|
8940
8880
|
description: string;
|
|
8941
8881
|
title: string;
|
|
8942
8882
|
};
|
|
8943
|
-
"Omit<(structure-1066060463-
|
|
8883
|
+
"Omit<(structure-1066060463-61841-63584-1066060463-61766-63585-1066060463-57871-64773-1066060463-0-67826|undefined)937098756,(\"data\"|\"orderByFields\")>": {
|
|
8944
8884
|
$ref: string;
|
|
8945
8885
|
title: string;
|
|
8946
8886
|
};
|
|
8947
|
-
"Pick<(structure-1066060463-
|
|
8887
|
+
"Pick<(structure-1066060463-61841-63584-1066060463-61766-63585-1066060463-57871-64773-1066060463-0-67826|undefined)937098756,Exclude<(\"series\"|\"data\"|\"orderByFields\"),(\"data\"|\"orderByFields\")>>": {
|
|
8948
8888
|
type: string;
|
|
8949
8889
|
properties: {
|
|
8950
8890
|
series: {
|
|
@@ -9016,6 +8956,36 @@
|
|
|
9016
8956
|
description: string;
|
|
9017
8957
|
title: string;
|
|
9018
8958
|
};
|
|
8959
|
+
RESTFieldType: {
|
|
8960
|
+
type: string;
|
|
8961
|
+
enum: string[];
|
|
8962
|
+
title: string;
|
|
8963
|
+
};
|
|
8964
|
+
RESTSimpleLineSymbolStyle: {
|
|
8965
|
+
type: string;
|
|
8966
|
+
enum: string[];
|
|
8967
|
+
title: string;
|
|
8968
|
+
};
|
|
8969
|
+
RESTSimpleMarkerSymbolStyle: {
|
|
8970
|
+
type: string;
|
|
8971
|
+
enum: string[];
|
|
8972
|
+
title: string;
|
|
8973
|
+
};
|
|
8974
|
+
RESTSimpleFillSymbolStyle: {
|
|
8975
|
+
type: string;
|
|
8976
|
+
enum: string[];
|
|
8977
|
+
title: string;
|
|
8978
|
+
};
|
|
8979
|
+
RESTRendererType: {
|
|
8980
|
+
type: string;
|
|
8981
|
+
enum: string[];
|
|
8982
|
+
title: string;
|
|
8983
|
+
};
|
|
8984
|
+
RESTSymbolType: {
|
|
8985
|
+
type: string;
|
|
8986
|
+
enum: string[];
|
|
8987
|
+
title: string;
|
|
8988
|
+
};
|
|
9019
8989
|
};
|
|
9020
8990
|
let $ref: string;
|
|
9021
8991
|
}
|
package/dist/loader.js
CHANGED
|
@@ -2,7 +2,7 @@
|
|
|
2
2
|
import { r as e } from "./chunks/runtime.js";
|
|
3
3
|
import { makeDefineCustomElements as t } from "@arcgis/lumina";
|
|
4
4
|
const a = t(e, {
|
|
5
|
-
"arcgis-chart": [() => import("./components/arcgis-chart/customElement.js"), "_commonStrings:,_messages:,actionMode,allowUsingObjectIdStat,animationEnabled,aria:,autoDestroyDisabled,autoDisposeChart,autoInverseDataLabelTextColor,calciteThemingCSSVariables:,chartIndex,chartLimits:,chartWillRender:,configurationEnabled,cursorRange,dataLabelFormatter:,disableInteractions,disableTogglingLegendItems,enableBetaFeatures,enableConfiguration,enableResponsiveFeatures,errorPolicy,featureIndex,filterByExtent,filterBySelection,filterByViewExtent,gaugeInnerLabelFormatter:,guideTooltipFormatter:,hideEmptySeries,hideLicenseWatermark,hideLoaderAnimation,hideUIMessages,hideZeroCountCategories,ignoreSmoothRenderingLimit,ignoreViewExtent,interactionsDisabled,layer:,layerFieldsChangePolicy,layerFilterChangePolicy,layerItemId,layerRendererChangePolicy,legendInteractionsDisabled,legendPosition,legendValueLabelFormatter:,legendVisibility,loaderColors:,mapLayerId,messageOverrides:,model:,nullAsValid,placeholder,popupTemplateFieldInfosEnabled,queueChartCreation,referenceElement,replaceNoValueCategoryWithZero,returnFeaturesExtent,returnSelectionIndexes,returnSelectionOIDs,rotated,rotation,runtimeDataFilters:,secondaryYAxisLabelFormatter:,selectionData:,selectionManager:,selectionTheme:,setTimeBinningInfoWhenNotProvided,showEmptySeries,showLicenseWatermark,showUIMessages,skipChartCreationQueue,syncChartsSelection,syncSelection,syncSelectionsBetweenChartAndLayerViewPolicy,syncViewSelection,syncViewTimeExtent,syncViewTimeZone,syncViewTimeZoneInclusionList:,timeZone,togglingLegendItemsDisabled,tooltipFormatter:,truncateLongTitles,updateSplitBySeries:,useAnimatedCharts,usePopupTemplateFieldsInfo,view:,viewTimeExtentChangePolicy,xAxisLabelFormatter:,yAxisLabelFormatter:,zeroCountAsValid;clearSelection,destroy,errorAlert,exportAsCSV,exportAsImage,loadModel,notify,refresh,resetZoom,switchSelection;applySelectionFromSelectionManager"],
|
|
5
|
+
"arcgis-chart": [() => import("./components/arcgis-chart/customElement.js"), "_commonStrings:,_messages:,actionMode,allowUsingObjectIdStat,animationEnabled,animationsEnabled,aria:,autoDestroyDisabled,autoDisposeChart,autoInverseDataLabelTextColor,calciteThemingCSSVariables:,chartIndex,chartLimits:,chartWillRender:,columnGapsEnabled,configurationEnabled,cursorRange,dataLabelFormatter:,disableInteractions,disableTogglingLegendItems,enableBetaFeatures,enableConfiguration,enableResponsiveFeatures,errorPolicy,featureIndex,filterByExtent,filterBySelection,filterByViewExtent,gaugeInnerLabelFormatter:,guideTooltipFormatter:,hideEmptySeries,hideLicenseWatermark,hideLoaderAnimation,hideUIMessages,hideZeroCountCategories,ignoreSmoothRenderingLimit,ignoreViewExtent,interactionsDisabled,layer:,layerFieldsChangePolicy,layerFilterChangePolicy,layerItemId,layerRendererChangePolicy,legendInteractionsDisabled,legendPosition,legendValueLabelFormatter:,legendVisibility,loaderColors:,mapLayerId,messageOverrides:,model:,nullAsValid,placeholder,popupTemplateFieldInfosEnabled,queueChartCreation,referenceElement,replaceNoValueCategoryWithZero,returnFeaturesExtent,returnSelectionIndexes,returnSelectionOIDs,rotated,rotation,runtimeDataFilters:,secondaryYAxisLabelFormatter:,selectionData:,selectionManager:,selectionTheme:,setTimeBinningInfoWhenNotProvided,showEmptySeries,showLicenseWatermark,showUIMessages,skipChartCreationQueue,syncChartsSelection,syncSelection,syncSelectionsBetweenChartAndLayerViewPolicy,syncViewSelection,syncViewTimeExtent,syncViewTimeZone,syncViewTimeZoneInclusionList:,timeZone,togglingLegendItemsDisabled,tooltipFormatter:,truncateLongTitles,updateSplitBySeries:,useAnimatedCharts,usePopupTemplateFieldsInfo,view:,viewTimeExtentChangePolicy,xAxisLabelFormatter:,yAxisLabelFormatter:,zeroCountAsValid;clearSelection,destroy,errorAlert,exportAsCSV,exportAsImage,loadModel,notify,refresh,resetZoom,switchSelection;applySelectionFromSelectionManager"],
|
|
6
6
|
"arcgis-charts-action-bar": [() => import("./components/arcgis-charts-action-bar/customElement.js"), "_messages:,actionBarSelectionMode,chartElement:,chartType,clearSelectionActive,clearSelectionDisabled,clearSelectionState,clearSelectionTitle,clearSelectionToggle,commonStrings:,csvExportExclusionList:,disableCSVExportForChartTypes:,editChartActive,editChartEnabled,editChartState,editChartTitle,editChartToggle,expanded,exportActionDisabled,exportActionState,exportAsCSVDisabled,exportAsCSVState,exportAsCSVTitle,exportAsImageDisabled,exportAsImageState,exportAsImageTitle,filterByExtentState,filterByExtentTitle,filterByExtentToggle,filterBySelectionActive,filterBySelectionDisabled,filterBySelectionState,filterBySelectionTitle,filterBySelectionToggle,filterByViewExtentActive,filterByViewExtentDisabled,filterByViewExtentTitle,forceDisableActions,fullExtentActive,fullExtentDisabled,fullExtentState,fullExtentTitle,fullExtentToggle,hiddenActions:,legendActive,legendDisabled,legendState,legendTitle,legendToggle,messageOverrides:,rotateChartActive,rotateChartDisabled,rotateChartState,rotateChartTitle,rotateChartToggle,selectionActive,selectionDisabled,selectionState,selectionTitle,selectionToggle,switchSelectionActive,switchSelectionDisabled,switchSelectionState,switchSelectionTitle,switchSelectionToggle,zoomActive,zoomDisabled,zoomState,zoomTitle,zoomToggle"],
|
|
7
7
|
"arcgis-charts-config-axes": [() => import("./components/arcgis-charts-config-axes/customElement.js"), "calculatedDataMinMaxBounds:,calculatedMinMaxBounds:,messageOverrides:,model:,open,showEnableXLogOption,showEnableYLogOption,showMaxXBoundOption,showMaxYBoundOption,showMinXBoundOption,showMinYBoundOption"],
|
|
8
8
|
"arcgis-charts-config-axis": [() => import("./components/arcgis-charts-config-axis/customElement.js"), "axisTitle,dataMaxValue,dataMinValue,initialMaxBound,initialMinBound,isXAxis,maxBoundMaxLimit,maxBoundMinLimit,messageOverrides:,minBoundMaxLimit,minBoundMinLimit,model:,showEnableLogOption,showMaxBoundOption,showMinBoundOption"],
|
|
@@ -50,10 +50,10 @@ const a = t(e, {
|
|
|
50
50
|
"arcgis-charts-config-pie-chart-slices": [() => import("./components/arcgis-charts-config-pie-chart-slices/customElement.js"), "chartData:,messageOverrides:,model:,popoverPlacement"],
|
|
51
51
|
"arcgis-charts-config-pie-chart-slices-popover": [() => import("./components/arcgis-charts-config-pie-chart-slices-popover/customElement.js"), "messageOverrides:,open,placement,referenceElement:,selectedColor:,selectedName,selectedSliceId;reposition"],
|
|
52
52
|
"arcgis-charts-config-scatter-plot": [() => import("./components/arcgis-charts-config-scatter-plot/customElement.js"), "calculatedDataMinMaxBounds:,calculatedMinMaxBounds:,layer:,model:,page,popoverPlacement,popupTemplateFieldInfosEnabled,r2,usePopupTemplateFieldsInfo,view:"],
|
|
53
|
-
"arcgis-charts-config-scatter-plot-aoi": [() => import("./components/arcgis-charts-config-scatter-plot-aoi/customElement.js"), "messageOverrides:,view:"],
|
|
53
|
+
"arcgis-charts-config-scatter-plot-aoi": [() => import("./components/arcgis-charts-config-scatter-plot-aoi/customElement.js"), "messageOverrides:,tool,view:"],
|
|
54
54
|
"arcgis-charts-config-scatter-plot-data": [() => import("./components/arcgis-charts-config-scatter-plot-data/customElement.js"), "isTableLayer,layerFieldsInfo:,messageOverrides:,model:,r2,view:"],
|
|
55
55
|
"arcgis-charts-config-scatter-plot-popover": [() => import("./components/arcgis-charts-config-scatter-plot-popover/customElement.js"), "contentKind,headingTitle,layerFieldsInfo:,messageOverrides:,open,placement,referenceElement:,selectedContent;reposition"],
|
|
56
|
-
"arcgis-charts-config-select-chart-type-popover": [() => import("./components/arcgis-charts-config-select-chart-type-popover/customElement.js"), "headerTitle,
|
|
56
|
+
"arcgis-charts-config-select-chart-type-popover": [() => import("./components/arcgis-charts-config-select-chart-type-popover/customElement.js"), "headerTitle,layerId,layerType,messageOverrides:,open,popoverPlacement,referenceElement:,selectedModelType,supportedChartTypes:;reposition"],
|
|
57
57
|
"arcgis-charts-config-view-charts": [() => import("./components/arcgis-charts-config-view-charts/customElement.js"), "disableEditing,layer:,messageOverrides:,modelList:,noGroup,selectedChartId"],
|
|
58
58
|
"arcgis-charts-info-modal": [() => import("./components/arcgis-charts-info-modal/customElement.js"), "calciteThemeColors:,heading,loaderColors:,message,showLoader"]
|
|
59
59
|
});
|
|
@@ -83,8 +83,12 @@ export class BoxPlotModel extends BoxPlotModelSuperclass {
|
|
|
83
83
|
generateChartTitle(): string;
|
|
84
84
|
/** Generate the proper y-axis title given the current config. */
|
|
85
85
|
generateYAxisTitle(): string;
|
|
86
|
-
/**
|
|
87
|
-
|
|
86
|
+
/**
|
|
87
|
+
* Gets the list of the category values for the chart.
|
|
88
|
+
*
|
|
89
|
+
* @param num - The maximum number of category values to fetch.
|
|
90
|
+
*/
|
|
91
|
+
getCustomSortValues(num?: number): Promise<string[]>;
|
|
88
92
|
/**
|
|
89
93
|
* Gets the data sort order of the box plot.
|
|
90
94
|
*
|
|
@@ -1,7 +1,7 @@
|
|
|
1
1
|
import type { ModelParams } from "../interfaces/chart-interfaces.js";
|
|
2
2
|
import type { ModelTypes, SerialChartDataSortingKinds, HeatChartDataSortingKinds } from "../interfaces/common.js";
|
|
3
3
|
import type { SerialChartModel } from "../serial-chart-model/serial-chart-model.js";
|
|
4
|
-
import type { SupportedRasterLayer } from "../../interfaces.js";
|
|
4
|
+
import type { SupportedRasterLayer } from "../../utils/layer/interfaces.js";
|
|
5
5
|
import type { WebChartCalendarDatePartsBinning, WebChartHeatChartEmptyCell, WebChartHeatChartGradient, WebChartNullCategory } from "../../spec/web-chart.js";
|
|
6
6
|
import type { WebChartStatisticType, WebChartClassBreakTypes, WebChartHeatChartHeatRulesTypes, WebChartHeatChartViewTypes, WebChartLegendPositions, WebChartNullPolicyTypes, WebChartStackedKinds } from "../../spec/chart-object-literals.js";
|
|
7
7
|
import type { ISimpleFillSymbol, ISimpleLineSymbol } from "../../spec/rest-js-types.js";
|
|
@@ -133,10 +133,38 @@ export abstract class ModelWithMultiAxes extends ChartModel {
|
|
|
133
133
|
*/
|
|
134
134
|
setAxisLabelsVisibility(isVisible: boolean, axisIndex?: number): void;
|
|
135
135
|
/**
|
|
136
|
-
* Sets the scrollbar configuration for the specified axis.
|
|
136
|
+
* Sets the scrollbar configuration for zooming and panning along the specified axis.
|
|
137
137
|
*
|
|
138
138
|
* @param scrollbar - The scrollbar configuration to set.
|
|
139
139
|
* @param axisIndex - Axis index for the chart: `0` for x-axis, `1` for primary y-axis, and `2` for secondary y-axis.
|
|
140
|
+
* @example
|
|
141
|
+
* ```ts
|
|
142
|
+
* // Sets the scrollbar for the x-axis
|
|
143
|
+
* chartModel.setAxisScrollbar(
|
|
144
|
+
* {
|
|
145
|
+
* visible: true,
|
|
146
|
+
* width: 20,
|
|
147
|
+
* color: [70, 174, 211, 255],
|
|
148
|
+
* gripSize: 32,
|
|
149
|
+
* margin: 8,
|
|
150
|
+
* },
|
|
151
|
+
* 0,
|
|
152
|
+
* );
|
|
153
|
+
*
|
|
154
|
+
* // Sets the scrollbar for the y-axis
|
|
155
|
+
* chartModel.setAxisScrollbar(
|
|
156
|
+
* {
|
|
157
|
+
* visible: true,
|
|
158
|
+
* width: 20,
|
|
159
|
+
* color: [158, 194, 49, 255],
|
|
160
|
+
* gripSize: 32,
|
|
161
|
+
* margin: 8,
|
|
162
|
+
* },
|
|
163
|
+
* 1,
|
|
164
|
+
* );
|
|
165
|
+
* ```
|
|
166
|
+
*
|
|
167
|
+
* <video src="https://developers.arcgis.com/javascript/latest/assets/references/components/chart/setAxisScrollbar.webm" aria-label="setAxisScrollbar" width="750" autoPlay loop muted playsInline/>
|
|
140
168
|
*/
|
|
141
169
|
setAxisScrollbar(scrollbar: WebChartAxisScrollBar, axisIndex: number): void;
|
|
142
170
|
/**
|
|
@@ -176,7 +204,11 @@ export abstract class ModelWithMultiAxes extends ChartModel {
|
|
|
176
204
|
setAxisVisibility(isVisible: boolean, axisIndex: number): void;
|
|
177
205
|
/**
|
|
178
206
|
* Sets the buffer for the specified axis.
|
|
179
|
-
* - This setting is only applicable to the axis of type `ValueAxis
|
|
207
|
+
* - This setting is only applicable to the axis of type `ValueAxis`
|
|
208
|
+
*
|
|
209
|
+
* | with `setBuffer` | without `setBuffer` |
|
|
210
|
+
* |-----------------|------------------|
|
|
211
|
+
* | 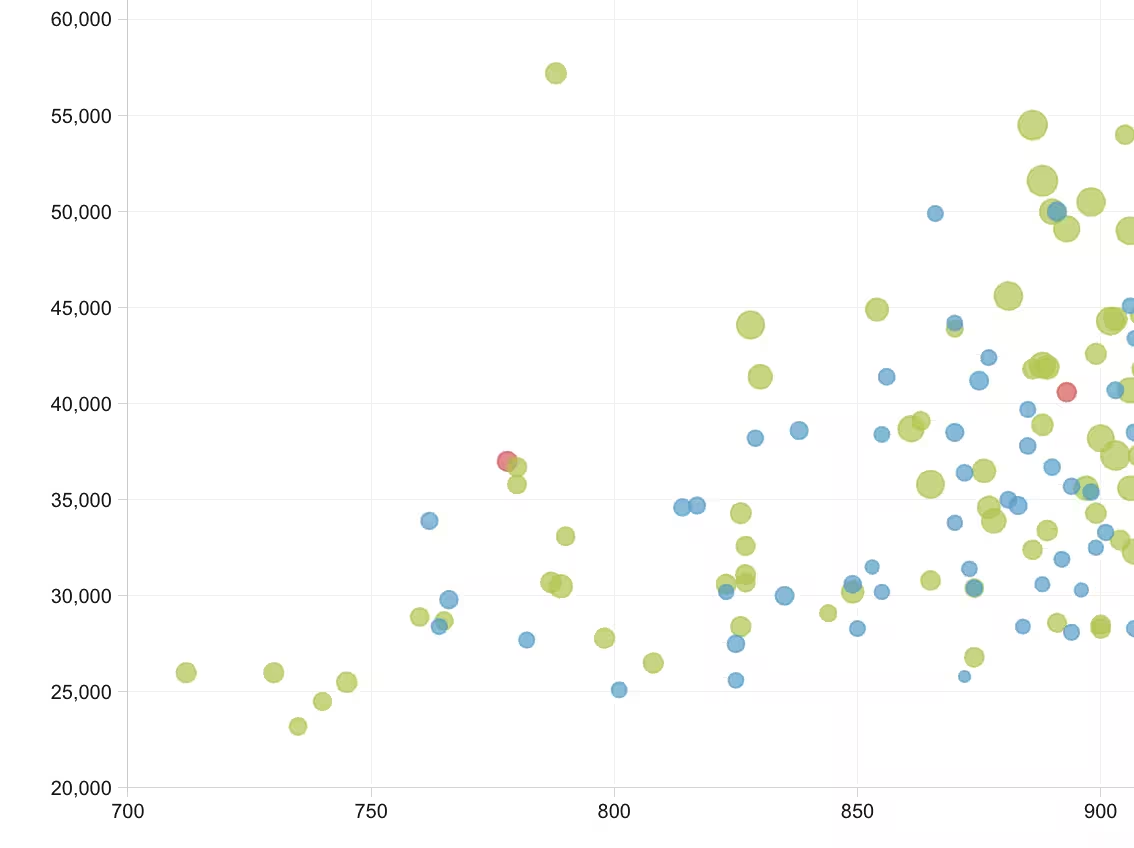 | 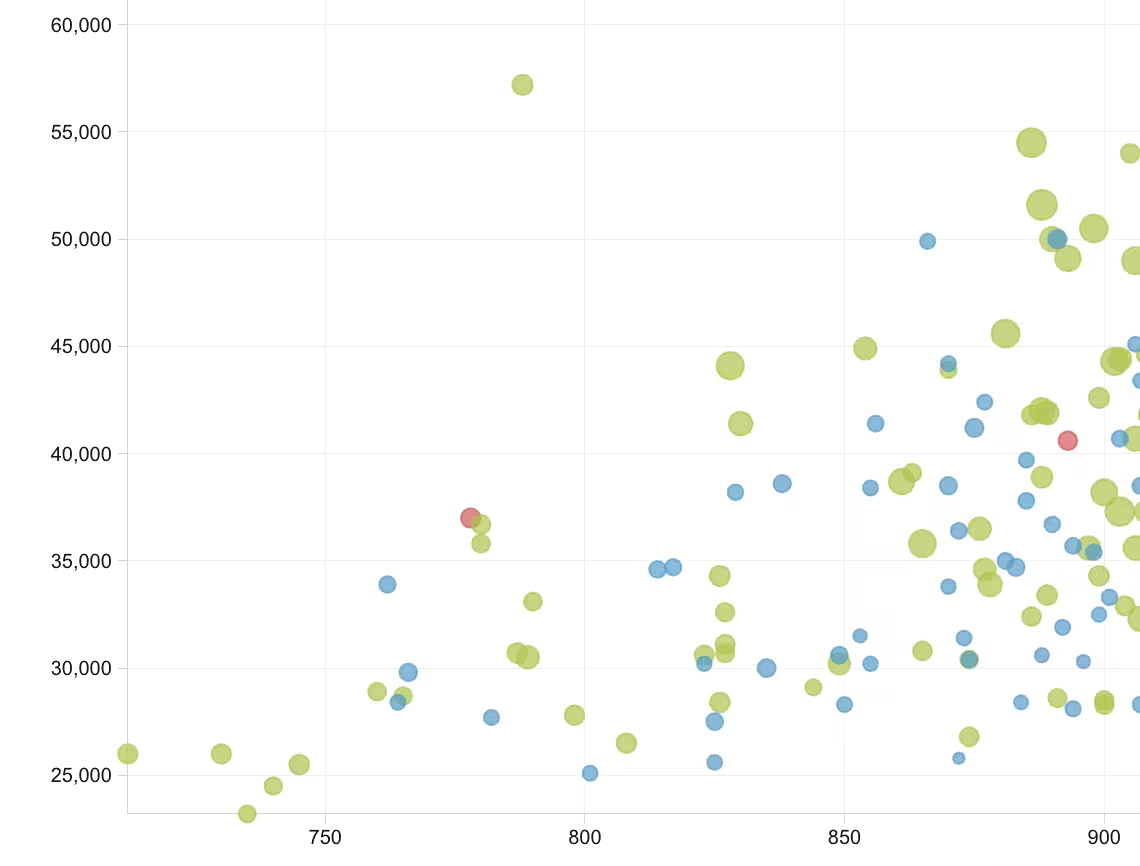 |
|
|
180
212
|
*
|
|
181
213
|
* @param buffer - The setting for the buffer.
|
|
182
214
|
* @param axisIndex - Axis index for the chart: `0` for x-axis, `1` for primary y-axis, and `2` for secondary y-axis. If omitted, all compatible value axes will be updated.
|
|
@@ -221,6 +253,11 @@ export abstract class ModelWithMultiAxes extends ChartModel {
|
|
|
221
253
|
setGridLinesSymbol(linesSymbol: ISimpleLineSymbol | undefined, axisIndices?: number[]): void;
|
|
222
254
|
/**
|
|
223
255
|
* Sets the horizontal axis labels behavior for the chart.
|
|
256
|
+
* - Default behavior is `rotate`, except for histogram where the default is `hide`.
|
|
257
|
+
*
|
|
258
|
+
* | `hide` | `rotate` | `stagger` | `wrap` |
|
|
259
|
+
* | --- | --- | --- | --- |
|
|
260
|
+
* |  |  |  |  |
|
|
224
261
|
*
|
|
225
262
|
* @param horizontalBehavior - The behavior for the horizontal axis labels.
|
|
226
263
|
*/
|
|
@@ -236,8 +273,18 @@ export abstract class ModelWithMultiAxes extends ChartModel {
|
|
|
236
273
|
/**
|
|
237
274
|
* Sets whether logarithmic scale is enabled for the specified axis.
|
|
238
275
|
*
|
|
276
|
+
* | X-axis (`axisIndex: 0`) | Primary y-axis (`axisIndex: 1`) | Both axes |
|
|
277
|
+
* | --- | --- | --- |
|
|
278
|
+
* | 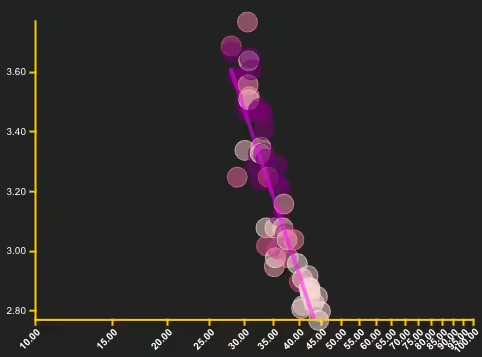 | 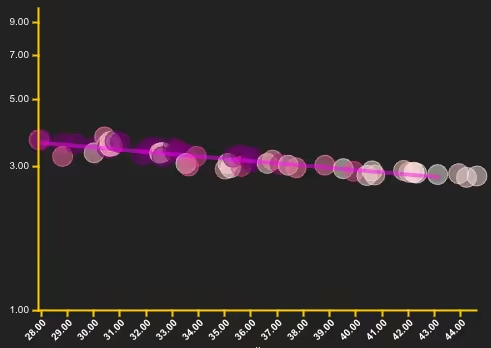 | 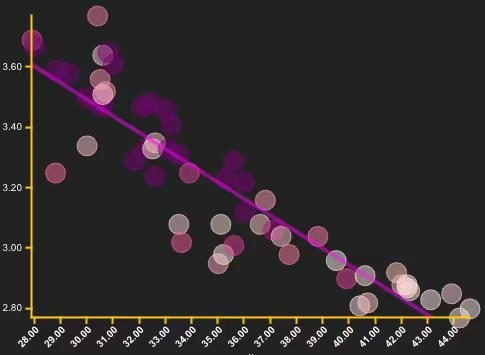 |
|
|
279
|
+
*
|
|
239
280
|
* @param isLogarithmic - Whether to enable logarithmic scale for the specified axis.
|
|
240
281
|
* @param axisIndex - Axis index for the chart: `0` for x-axis, `1` for primary y-axis, and `2` for secondary y-axis.
|
|
282
|
+
* @example
|
|
283
|
+
* ```ts
|
|
284
|
+
* // Apply a logarithmic scale to the x-axis (index 0) and primary y-axis (index 1)
|
|
285
|
+
* chartModel.setLogarithmic(true, 0);
|
|
286
|
+
* chartModel.setLogarithmic(true, 1);
|
|
287
|
+
* ```
|
|
241
288
|
*/
|
|
242
289
|
setLogarithmic(isLogarithmic: boolean, axisIndex: number): void;
|
|
243
290
|
/**
|
|
@@ -264,6 +311,10 @@ export abstract class ModelWithMultiAxes extends ChartModel {
|
|
|
264
311
|
/**
|
|
265
312
|
* Sets the vertical axis labels behavior for the chart.
|
|
266
313
|
*
|
|
314
|
+
* | `hide` | `wrap` |
|
|
315
|
+
* | --- | --- |
|
|
316
|
+
* | 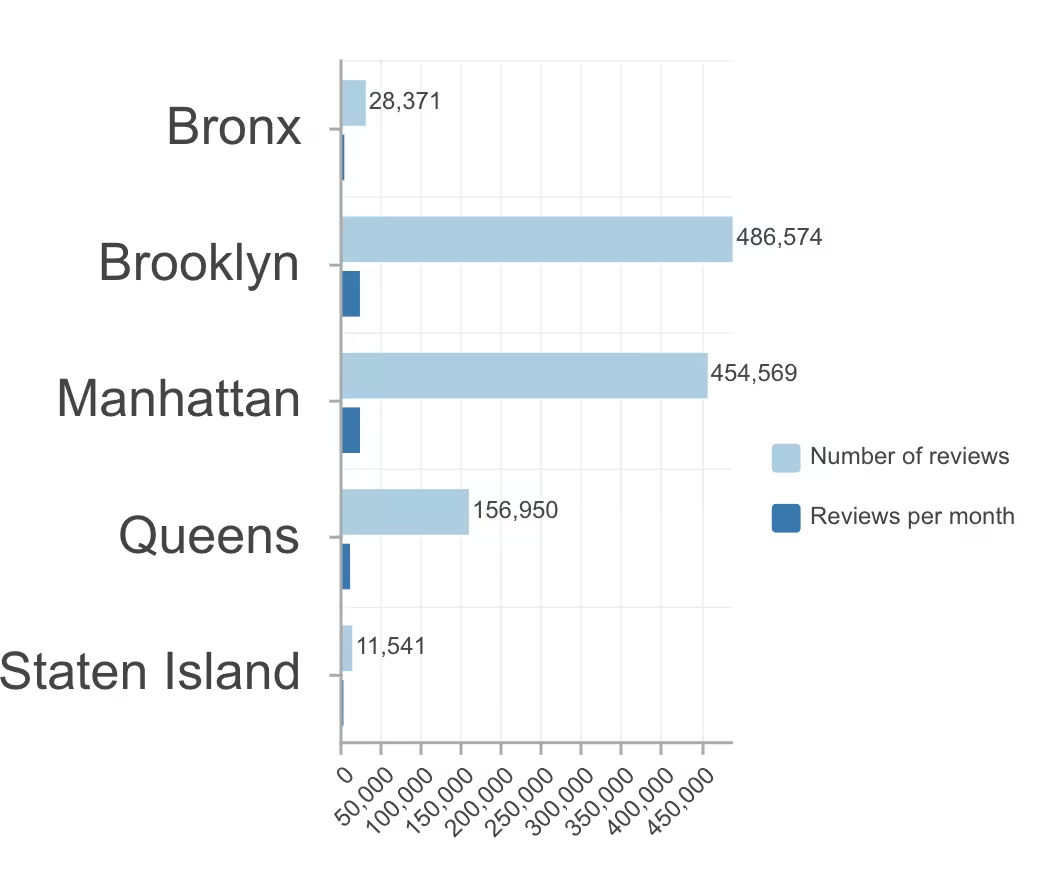 | 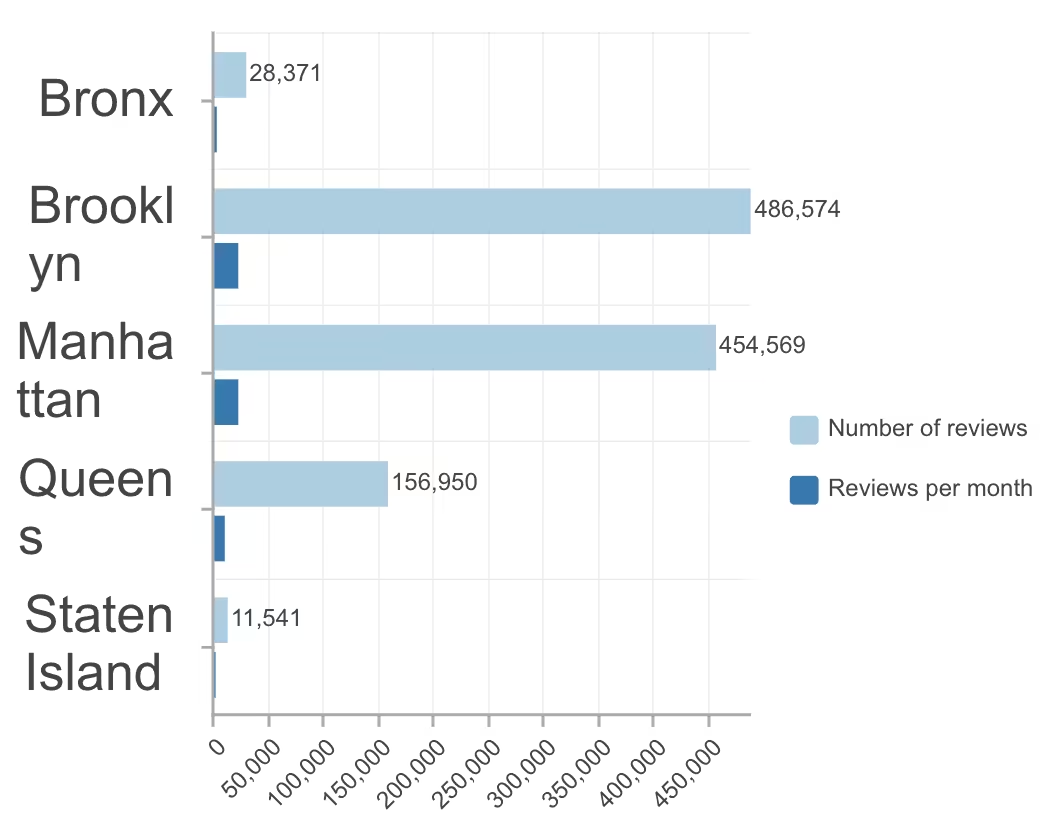 |
|
|
317
|
+
*
|
|
267
318
|
* @param verticalBehavior - The behavior for the vertical axis labels.
|
|
268
319
|
*/
|
|
269
320
|
setVerticalAxisLabelsBehavior(verticalBehavior: WebChartLabelBehavior): void;
|
|
@@ -145,8 +145,12 @@ export class PieChartModel extends PieChartModelSuperclass {
|
|
|
145
145
|
accessor valueSuffix: string | undefined;
|
|
146
146
|
/** Generate the proper chart title given the current config. */
|
|
147
147
|
generateChartTitle(): string;
|
|
148
|
-
/**
|
|
149
|
-
|
|
148
|
+
/**
|
|
149
|
+
* Gets the list of the category values for the chart.
|
|
150
|
+
*
|
|
151
|
+
* @param num - The maximum number of category values to fetch.
|
|
152
|
+
*/
|
|
153
|
+
getCustomSortValues(num?: number): Promise<string[]>;
|
|
150
154
|
/**
|
|
151
155
|
* Gets the data sort order for the pie chart.
|
|
152
156
|
*
|
|
@@ -1,8 +1,8 @@
|
|
|
1
|
-
import type {
|
|
1
|
+
import type { ChartLayerInputSansView } from "../../interfaces.js";
|
|
2
2
|
import type { ChartModelBase } from "../chart-model/chart-model-base.js";
|
|
3
3
|
|
|
4
4
|
/** Adds getter support for the associated layer reference. */
|
|
5
5
|
export abstract class WithLayer extends ChartModelBase {
|
|
6
6
|
/** The chart model's layer. */
|
|
7
|
-
get layer():
|
|
7
|
+
get layer(): ChartLayerInputSansView | undefined;
|
|
8
8
|
}
|
|
@@ -86,8 +86,12 @@ export abstract class SerialChartModel extends SerialChartModelSuperclass {
|
|
|
86
86
|
* @param seriesIndex - The index of the series.
|
|
87
87
|
*/
|
|
88
88
|
getAssignToSecondValueAxis(seriesIndex: number): boolean;
|
|
89
|
-
/**
|
|
90
|
-
|
|
89
|
+
/**
|
|
90
|
+
* Gets the list of the category values for the chart.
|
|
91
|
+
*
|
|
92
|
+
* @param num - The maximum number of category values to fetch.
|
|
93
|
+
*/
|
|
94
|
+
getCustomSortValues(num?: number): Promise<string[]>;
|
|
91
95
|
/**
|
|
92
96
|
* Gets the data sort order for the chart.
|
|
93
97
|
*
|
|
@@ -55,72 +55,6 @@ export const RESTSimpleFillSymbolStyle: {
|
|
|
55
55
|
|
|
56
56
|
export type RESTSimpleFillSymbolStyle = (typeof RESTSimpleFillSymbolStyle)[keyof typeof RESTSimpleFillSymbolStyle];
|
|
57
57
|
|
|
58
|
-
/** @deprecated since 5.1. Won't be replaced. */
|
|
59
|
-
export const RESTHorizontalAlignment: {
|
|
60
|
-
readonly Left: "left";
|
|
61
|
-
readonly Right: "right";
|
|
62
|
-
readonly Center: "center";
|
|
63
|
-
readonly Justify: "justify";
|
|
64
|
-
};
|
|
65
|
-
|
|
66
|
-
/** @deprecated since 5.1. Won't be replaced. */
|
|
67
|
-
export type RESTHorizontalAlignment = (typeof RESTHorizontalAlignment)[keyof typeof RESTHorizontalAlignment];
|
|
68
|
-
|
|
69
|
-
/** @deprecated since 5.1. Won't be replaced. */
|
|
70
|
-
export const RESTVerticalAlignment: {
|
|
71
|
-
readonly Baseline: "baseline";
|
|
72
|
-
readonly Top: "top";
|
|
73
|
-
readonly Middle: "middle";
|
|
74
|
-
readonly Bottom: "bottom";
|
|
75
|
-
};
|
|
76
|
-
|
|
77
|
-
/** @deprecated since 5.1. Won't be replaced. */
|
|
78
|
-
export type RESTVerticalAlignment = (typeof RESTVerticalAlignment)[keyof typeof RESTVerticalAlignment];
|
|
79
|
-
|
|
80
|
-
/** @deprecated since 5.1. Won't be replaced. */
|
|
81
|
-
export const RESTFontStyle: {
|
|
82
|
-
readonly Italic: "italic";
|
|
83
|
-
readonly Normal: "normal";
|
|
84
|
-
readonly Oblique: "oblique";
|
|
85
|
-
};
|
|
86
|
-
|
|
87
|
-
/** @deprecated since 5.1. Won't be replaced. */
|
|
88
|
-
export type RESTFontStyle = (typeof RESTFontStyle)[keyof typeof RESTFontStyle];
|
|
89
|
-
|
|
90
|
-
/** @deprecated since 5.1. Won't be replaced. */
|
|
91
|
-
export const RESTFontWeight: {
|
|
92
|
-
readonly Bold: "bold";
|
|
93
|
-
readonly Bolder: "bolder";
|
|
94
|
-
readonly Lighter: "lighter";
|
|
95
|
-
readonly Normal: "normal";
|
|
96
|
-
};
|
|
97
|
-
|
|
98
|
-
/** @deprecated since 5.1. Won't be replaced. */
|
|
99
|
-
export type RESTFontWeight = (typeof RESTFontWeight)[keyof typeof RESTFontWeight];
|
|
100
|
-
|
|
101
|
-
/** @deprecated since 5.1. Won't be replaced. */
|
|
102
|
-
export const RESTFontDecoration: {
|
|
103
|
-
readonly LineThrough: "line-through";
|
|
104
|
-
readonly Underline: "underline";
|
|
105
|
-
readonly None: "none";
|
|
106
|
-
};
|
|
107
|
-
|
|
108
|
-
/** @deprecated since 5.1. Won't be replaced. */
|
|
109
|
-
export type RESTFontDecoration = (typeof RESTFontDecoration)[keyof typeof RESTFontDecoration];
|
|
110
|
-
|
|
111
|
-
/** @deprecated since 5.1. Use [Query#units](https://developers.arcgis.com/javascript/latest/references/core/rest/support/Query/#units) instead. */
|
|
112
|
-
export const RESTUnits: {
|
|
113
|
-
readonly Feet: "feet";
|
|
114
|
-
readonly Miles: "miles";
|
|
115
|
-
readonly NauticalMiles: "nautical-miles";
|
|
116
|
-
readonly USNauticalMiles: "us-nautical-miles";
|
|
117
|
-
readonly Meters: "meters";
|
|
118
|
-
readonly Kilometers: "kilometers";
|
|
119
|
-
};
|
|
120
|
-
|
|
121
|
-
/** @deprecated since 5.1. Use [Query#units](https://developers.arcgis.com/javascript/latest/references/core/rest/support/Query/#units) instead. */
|
|
122
|
-
export type RESTUnits = (typeof RESTUnits)[keyof typeof RESTUnits];
|
|
123
|
-
|
|
124
58
|
export const RESTRendererType: {
|
|
125
59
|
readonly UniqueValue: "unique-value";
|
|
126
60
|
readonly Simple: "simple";
|
|
@@ -497,7 +497,6 @@ export interface IServiceInfo extends Record<string, unknown> {
|
|
|
497
497
|
* Individual View Source entry
|
|
498
498
|
*
|
|
499
499
|
* @deprecated since 5.1. Won't be replaced.
|
|
500
|
-
* @internal
|
|
501
500
|
*/
|
|
502
501
|
export interface IViewServiceSource {
|
|
503
502
|
name: string;
|
|
@@ -1712,10 +1711,7 @@ export interface ITypeInfoDomain {
|
|
|
1712
1711
|
type: string | "inherited";
|
|
1713
1712
|
}
|
|
1714
1713
|
|
|
1715
|
-
/**
|
|
1716
|
-
* @deprecated since 5.1. Won't be replaced.
|
|
1717
|
-
* @internal
|
|
1718
|
-
*/
|
|
1714
|
+
/** @deprecated since 5.1. Won't be replaced. */
|
|
1719
1715
|
export type FeatureEditTool = "esriFeatureEditToolAutoCompletePolygon" | "esriFeatureEditToolCircle" | "esriFeatureEditToolDownArrow" | "esriFeatureEditToolEllipse" | "esriFeatureEditToolFreehand" | "esriFeatureEditToolLeftArrow" | "esriFeatureEditToolLine" | "esriFeatureEditToolNone" | "esriFeatureEditToolPoint" | "esriFeatureEditToolPolygon" | "esriFeatureEditToolRectangle" | "esriFeatureEditToolRightArrow" | "esriFeatureEditToolText" | "esriFeatureEditToolTriangle" | "esriFeatureEditToolUpArrow";
|
|
1720
1716
|
|
|
1721
1717
|
/**
|
package/dist/spec/web-chart.d.ts
CHANGED
|
@@ -1,6 +1,6 @@
|
|
|
1
|
+
import type { QueryUnits } from "@arcgis/core/rest/support/types.js";
|
|
1
2
|
import type { GaugeChartSubTypes, SizePolicyScaleTypes, WebChartCalendarDatePartsUnits, WebChartClassBreakTypes, WebChartDataTransformations, WebChartDirectionalDataOrder, WebChartHeatChartHeatRulesTypes, WebChartHeatChartViewTypes, WebChartLabelBehavior, WebChartLegendPositions, WebChartMultiAxesDataOrder, WebChartNullPolicyTypes, WebChartOrderSeriesBy, WebChartPredefinedLabelsDataOrder, WebChartRadarChartAxisLabelsOrientation, WebChartStackedKinds, WebChartTemporalBinningUnits, WebChartTimeAggregationTypes, WebChartTypes } from "./chart-object-literals.js";
|
|
2
3
|
import type { TimeIntervalInfo } from "./data-source.js";
|
|
3
|
-
import type { RESTUnits } from "./rest-js-object-literals.js";
|
|
4
4
|
import type { Color, IDrawingInfo, IEnvelope, IExtent, IFeatureLayer, IImageServiceLayer, IPoint, IPolygon, IPolygonWithCurves, IPolyline, ISimpleFillSymbol, ISimpleLineSymbol, ISimpleMarkerSymbol, IStatisticDefinition, ITextSymbol, ITiledImageServiceLayer, IWCSLayer } from "./rest-js-types.js";
|
|
5
5
|
|
|
6
6
|
/** Version of the current specification. */
|
|
@@ -579,7 +579,7 @@ export interface WebChartQuery {
|
|
|
579
579
|
* The unit for calculating the buffer distance when `distance` and `geometry` are provided.
|
|
580
580
|
* If not specified, the unit is derived from the geometry spatial reference.
|
|
581
581
|
*/
|
|
582
|
-
units?:
|
|
582
|
+
units?: QueryUnits;
|
|
583
583
|
/** A time extent `[timestamp, timestamp]` for a temporal query against time-aware layers. */
|
|
584
584
|
timeExtent?: [number, number];
|
|
585
585
|
/** The zero-based index indicating where to begin retrieving features. */
|
package/dist/types/lumina.d.ts
CHANGED
|
@@ -3,7 +3,7 @@ import type { ArcgisChart } from "../components/arcgis-chart/customElement.js";
|
|
|
3
3
|
import type { ArcgisChartsActionBar } from "../components/arcgis-charts-action-bar/customElement.js";
|
|
4
4
|
import type { h, EventHandler } from "@arcgis/lumina";
|
|
5
5
|
|
|
6
|
-
interface LuminaArcgisChart extends Partial<Pick<ArcgisChart, "actionMode" | "allowUsingObjectIdStat" | "animationEnabled" | "aria" | "autoDestroyDisabled" | "autoDisposeChart" | "autoInverseDataLabelTextColor" | "calciteThemingCSSVariables" | "chartIndex" | "chartLimits" | "chartWillRender" | "configurationEnabled" | "cursorRange" | "dataLabelFormatter" | "disableInteractions" | "disableTogglingLegendItems" | "enableBetaFeatures" | "enableConfiguration" | "enableResponsiveFeatures" | "errorPolicy" | "featureIndex" | "filterByExtent" | "filterBySelection" | "filterByViewExtent" | "gaugeInnerLabelFormatter" | "guideTooltipFormatter" | "hideEmptySeries" | "hideLicenseWatermark" | "hideLoaderAnimation" | "hideUIMessages" | "hideZeroCountCategories" | "ignoreSmoothRenderingLimit" | "ignoreViewExtent" | "interactionsDisabled" | "layer" | "layerFieldsChangePolicy" | "layerFilterChangePolicy" | "layerItemId" | "layerRendererChangePolicy" | "legendInteractionsDisabled" | "legendPosition" | "legendValueLabelFormatter" | "legendVisibility" | "loaderColors" | "mapLayerId" | "messageOverrides" | "model" | "nullAsValid" | "placeholder" | "popupTemplateFieldInfosEnabled" | "queueChartCreation" | "referenceElement" | "replaceNoValueCategoryWithZero" | "returnFeaturesExtent" | "returnSelectionIndexes" | "returnSelectionOIDs" | "rotated" | "rotation" | "runtimeDataFilters" | "secondaryYAxisLabelFormatter" | "selectionData" | "selectionManager" | "selectionTheme" | "setTimeBinningInfoWhenNotProvided" | "showEmptySeries" | "showLicenseWatermark" | "showUIMessages" | "skipChartCreationQueue" | "syncChartsSelection" | "syncSelection" | "syncSelectionsBetweenChartAndLayerViewPolicy" | "syncViewSelection" | "syncViewTimeExtent" | "syncViewTimeZone" | "syncViewTimeZoneInclusionList" | "timeZone" | "togglingLegendItemsDisabled" | "tooltipFormatter" | "truncateLongTitles" | "updateSplitBySeries" | "useAnimatedCharts" | "usePopupTemplateFieldsInfo" | "view" | "viewTimeExtentChangePolicy" | "xAxisLabelFormatter" | "yAxisLabelFormatter" | "zeroCountAsValid">>, h.JSX.HTMLAttributes<ArcgisChart> {
|
|
6
|
+
interface LuminaArcgisChart extends Partial<Pick<ArcgisChart, "actionMode" | "allowUsingObjectIdStat" | "animationEnabled" | "animationsEnabled" | "aria" | "autoDestroyDisabled" | "autoDisposeChart" | "autoInverseDataLabelTextColor" | "calciteThemingCSSVariables" | "chartIndex" | "chartLimits" | "chartWillRender" | "columnGapsEnabled" | "configurationEnabled" | "cursorRange" | "dataLabelFormatter" | "disableInteractions" | "disableTogglingLegendItems" | "enableBetaFeatures" | "enableConfiguration" | "enableResponsiveFeatures" | "errorPolicy" | "featureIndex" | "filterByExtent" | "filterBySelection" | "filterByViewExtent" | "gaugeInnerLabelFormatter" | "guideTooltipFormatter" | "hideEmptySeries" | "hideLicenseWatermark" | "hideLoaderAnimation" | "hideUIMessages" | "hideZeroCountCategories" | "ignoreSmoothRenderingLimit" | "ignoreViewExtent" | "interactionsDisabled" | "layer" | "layerFieldsChangePolicy" | "layerFilterChangePolicy" | "layerItemId" | "layerRendererChangePolicy" | "legendInteractionsDisabled" | "legendPosition" | "legendValueLabelFormatter" | "legendVisibility" | "loaderColors" | "mapLayerId" | "messageOverrides" | "model" | "nullAsValid" | "placeholder" | "popupTemplateFieldInfosEnabled" | "queueChartCreation" | "referenceElement" | "replaceNoValueCategoryWithZero" | "returnFeaturesExtent" | "returnSelectionIndexes" | "returnSelectionOIDs" | "rotated" | "rotation" | "runtimeDataFilters" | "secondaryYAxisLabelFormatter" | "selectionData" | "selectionManager" | "selectionTheme" | "setTimeBinningInfoWhenNotProvided" | "showEmptySeries" | "showLicenseWatermark" | "showUIMessages" | "skipChartCreationQueue" | "syncChartsSelection" | "syncSelection" | "syncSelectionsBetweenChartAndLayerViewPolicy" | "syncViewSelection" | "syncViewTimeExtent" | "syncViewTimeZone" | "syncViewTimeZoneInclusionList" | "timeZone" | "togglingLegendItemsDisabled" | "tooltipFormatter" | "truncateLongTitles" | "updateSplitBySeries" | "useAnimatedCharts" | "usePopupTemplateFieldsInfo" | "view" | "viewTimeExtentChangePolicy" | "xAxisLabelFormatter" | "yAxisLabelFormatter" | "zeroCountAsValid">>, h.JSX.HTMLAttributes<ArcgisChart> {
|
|
7
7
|
onarcgisAxesMinMaxChange?: EventHandler<ArcgisChart["arcgisAxesMinMaxChange"]>;
|
|
8
8
|
onarcgisBadDataWarningRaise?: EventHandler<ArcgisChart["arcgisBadDataWarningRaise"]>;
|
|
9
9
|
onarcgisChartNotFoundWarning?: EventHandler<ArcgisChart["arcgisChartNotFoundWarning"]>;
|
|
@@ -11,6 +11,7 @@ interface LuminaArcgisChart extends Partial<Pick<ArcgisChart, "actionMode" | "al
|
|
|
11
11
|
onarcgisDataFetchComplete?: EventHandler<ArcgisChart["arcgisDataFetchComplete"]>;
|
|
12
12
|
onarcgisDataProcessComplete?: EventHandler<ArcgisChart["arcgisDataProcessComplete"]>;
|
|
13
13
|
onarcgisDataProcessError?: EventHandler<ArcgisChart["arcgisDataProcessError"]>;
|
|
14
|
+
/** @deprecated since 5.1. Won't be replaced. */
|
|
14
15
|
onarcgisInvalidConfigWarningRaise?: EventHandler<ArcgisChart["arcgisInvalidConfigWarningRaise"]>;
|
|
15
16
|
onarcgisLegendItemVisibilityChange?: EventHandler<ArcgisChart["arcgisLegendItemVisibilityChange"]>;
|
|
16
17
|
onarcgisNoRenderPropChange?: EventHandler<ArcgisChart["arcgisNoRenderPropChange"]>;
|
|
@@ -19,6 +20,7 @@ interface LuminaArcgisChart extends Partial<Pick<ArcgisChart, "actionMode" | "al
|
|
|
19
20
|
onarcgisSelectionComplete?: EventHandler<ArcgisChart["arcgisSelectionComplete"]>;
|
|
20
21
|
onarcgisSeriesColorChange?: EventHandler<ArcgisChart["arcgisSeriesColorChange"]>;
|
|
21
22
|
onarcgisSeriesOrder?: EventHandler<ArcgisChart["arcgisSeriesOrder"]>;
|
|
23
|
+
/** @deprecated since 5.2. Use [@arcgisRenderingComplete](https://developers.arcgis.com/javascript/latest/references/charts-components/components/arcgis-chart/#event-arcgisRenderingComplete) instead. */
|
|
22
24
|
onarcgisUpdateComplete?: EventHandler<ArcgisChart["arcgisUpdateComplete"]>;
|
|
23
25
|
}
|
|
24
26
|
|
package/dist/types/preact.d.ts
CHANGED
|
@@ -4,7 +4,7 @@ import type { ArcgisChartsActionBar } from "../components/arcgis-charts-action-b
|
|
|
4
4
|
import { HTMLAttributes } from "preact";
|
|
5
5
|
import type { EventHandler } from "@arcgis/lumina";
|
|
6
6
|
|
|
7
|
-
interface PreactArcgisChart extends Partial<Pick<ArcgisChart, "actionMode" | "allowUsingObjectIdStat" | "animationEnabled" | "aria" | "autoDestroyDisabled" | "autoDisposeChart" | "autoInverseDataLabelTextColor" | "calciteThemingCSSVariables" | "chartIndex" | "chartLimits" | "chartWillRender" | "configurationEnabled" | "cursorRange" | "dataLabelFormatter" | "disableInteractions" | "disableTogglingLegendItems" | "enableBetaFeatures" | "enableConfiguration" | "enableResponsiveFeatures" | "errorPolicy" | "featureIndex" | "filterByExtent" | "filterBySelection" | "filterByViewExtent" | "gaugeInnerLabelFormatter" | "guideTooltipFormatter" | "hideEmptySeries" | "hideLicenseWatermark" | "hideLoaderAnimation" | "hideUIMessages" | "hideZeroCountCategories" | "ignoreSmoothRenderingLimit" | "ignoreViewExtent" | "interactionsDisabled" | "layer" | "layerFieldsChangePolicy" | "layerFilterChangePolicy" | "layerItemId" | "layerRendererChangePolicy" | "legendInteractionsDisabled" | "legendPosition" | "legendValueLabelFormatter" | "legendVisibility" | "loaderColors" | "mapLayerId" | "messageOverrides" | "model" | "nullAsValid" | "placeholder" | "popupTemplateFieldInfosEnabled" | "queueChartCreation" | "referenceElement" | "replaceNoValueCategoryWithZero" | "returnFeaturesExtent" | "returnSelectionIndexes" | "returnSelectionOIDs" | "rotated" | "rotation" | "runtimeDataFilters" | "secondaryYAxisLabelFormatter" | "selectionData" | "selectionManager" | "selectionTheme" | "setTimeBinningInfoWhenNotProvided" | "showEmptySeries" | "showLicenseWatermark" | "showUIMessages" | "skipChartCreationQueue" | "syncChartsSelection" | "syncSelection" | "syncSelectionsBetweenChartAndLayerViewPolicy" | "syncViewSelection" | "syncViewTimeExtent" | "syncViewTimeZone" | "syncViewTimeZoneInclusionList" | "timeZone" | "togglingLegendItemsDisabled" | "tooltipFormatter" | "truncateLongTitles" | "updateSplitBySeries" | "useAnimatedCharts" | "usePopupTemplateFieldsInfo" | "view" | "viewTimeExtentChangePolicy" | "xAxisLabelFormatter" | "yAxisLabelFormatter" | "zeroCountAsValid">>, HTMLAttributes<ArcgisChart> {
|
|
7
|
+
interface PreactArcgisChart extends Partial<Pick<ArcgisChart, "actionMode" | "allowUsingObjectIdStat" | "animationEnabled" | "animationsEnabled" | "aria" | "autoDestroyDisabled" | "autoDisposeChart" | "autoInverseDataLabelTextColor" | "calciteThemingCSSVariables" | "chartIndex" | "chartLimits" | "chartWillRender" | "columnGapsEnabled" | "configurationEnabled" | "cursorRange" | "dataLabelFormatter" | "disableInteractions" | "disableTogglingLegendItems" | "enableBetaFeatures" | "enableConfiguration" | "enableResponsiveFeatures" | "errorPolicy" | "featureIndex" | "filterByExtent" | "filterBySelection" | "filterByViewExtent" | "gaugeInnerLabelFormatter" | "guideTooltipFormatter" | "hideEmptySeries" | "hideLicenseWatermark" | "hideLoaderAnimation" | "hideUIMessages" | "hideZeroCountCategories" | "ignoreSmoothRenderingLimit" | "ignoreViewExtent" | "interactionsDisabled" | "layer" | "layerFieldsChangePolicy" | "layerFilterChangePolicy" | "layerItemId" | "layerRendererChangePolicy" | "legendInteractionsDisabled" | "legendPosition" | "legendValueLabelFormatter" | "legendVisibility" | "loaderColors" | "mapLayerId" | "messageOverrides" | "model" | "nullAsValid" | "placeholder" | "popupTemplateFieldInfosEnabled" | "queueChartCreation" | "referenceElement" | "replaceNoValueCategoryWithZero" | "returnFeaturesExtent" | "returnSelectionIndexes" | "returnSelectionOIDs" | "rotated" | "rotation" | "runtimeDataFilters" | "secondaryYAxisLabelFormatter" | "selectionData" | "selectionManager" | "selectionTheme" | "setTimeBinningInfoWhenNotProvided" | "showEmptySeries" | "showLicenseWatermark" | "showUIMessages" | "skipChartCreationQueue" | "syncChartsSelection" | "syncSelection" | "syncSelectionsBetweenChartAndLayerViewPolicy" | "syncViewSelection" | "syncViewTimeExtent" | "syncViewTimeZone" | "syncViewTimeZoneInclusionList" | "timeZone" | "togglingLegendItemsDisabled" | "tooltipFormatter" | "truncateLongTitles" | "updateSplitBySeries" | "useAnimatedCharts" | "usePopupTemplateFieldsInfo" | "view" | "viewTimeExtentChangePolicy" | "xAxisLabelFormatter" | "yAxisLabelFormatter" | "zeroCountAsValid">>, HTMLAttributes<ArcgisChart> {
|
|
8
8
|
onarcgisAxesMinMaxChange?: EventHandler<ArcgisChart["arcgisAxesMinMaxChange"]>;
|
|
9
9
|
onarcgisBadDataWarningRaise?: EventHandler<ArcgisChart["arcgisBadDataWarningRaise"]>;
|
|
10
10
|
onarcgisChartNotFoundWarning?: EventHandler<ArcgisChart["arcgisChartNotFoundWarning"]>;
|
|
@@ -12,6 +12,7 @@ interface PreactArcgisChart extends Partial<Pick<ArcgisChart, "actionMode" | "al
|
|
|
12
12
|
onarcgisDataFetchComplete?: EventHandler<ArcgisChart["arcgisDataFetchComplete"]>;
|
|
13
13
|
onarcgisDataProcessComplete?: EventHandler<ArcgisChart["arcgisDataProcessComplete"]>;
|
|
14
14
|
onarcgisDataProcessError?: EventHandler<ArcgisChart["arcgisDataProcessError"]>;
|
|
15
|
+
/** @deprecated since 5.1. Won't be replaced. */
|
|
15
16
|
onarcgisInvalidConfigWarningRaise?: EventHandler<ArcgisChart["arcgisInvalidConfigWarningRaise"]>;
|
|
16
17
|
onarcgisLegendItemVisibilityChange?: EventHandler<ArcgisChart["arcgisLegendItemVisibilityChange"]>;
|
|
17
18
|
onarcgisNoRenderPropChange?: EventHandler<ArcgisChart["arcgisNoRenderPropChange"]>;
|
|
@@ -20,6 +21,7 @@ interface PreactArcgisChart extends Partial<Pick<ArcgisChart, "actionMode" | "al
|
|
|
20
21
|
onarcgisSelectionComplete?: EventHandler<ArcgisChart["arcgisSelectionComplete"]>;
|
|
21
22
|
onarcgisSeriesColorChange?: EventHandler<ArcgisChart["arcgisSeriesColorChange"]>;
|
|
22
23
|
onarcgisSeriesOrder?: EventHandler<ArcgisChart["arcgisSeriesOrder"]>;
|
|
24
|
+
/** @deprecated since 5.2. Use [@arcgisRenderingComplete](https://developers.arcgis.com/javascript/latest/references/charts-components/components/arcgis-chart/#event-arcgisRenderingComplete) instead. */
|
|
23
25
|
onarcgisUpdateComplete?: EventHandler<ArcgisChart["arcgisUpdateComplete"]>;
|
|
24
26
|
}
|
|
25
27
|
|
package/dist/types/react.d.ts
CHANGED
|
@@ -4,7 +4,7 @@ import type { ArcgisChartsActionBar } from "../components/arcgis-charts-action-b
|
|
|
4
4
|
import type { HTMLProps } from 'react';
|
|
5
5
|
import type { EventHandler } from "@arcgis/lumina";
|
|
6
6
|
|
|
7
|
-
interface ReactArcgisChart extends Partial<Pick<ArcgisChart, "actionMode" | "allowUsingObjectIdStat" | "animationEnabled" | "aria" | "autoDestroyDisabled" | "autoDisposeChart" | "autoInverseDataLabelTextColor" | "calciteThemingCSSVariables" | "chartIndex" | "chartLimits" | "chartWillRender" | "configurationEnabled" | "cursorRange" | "dataLabelFormatter" | "disableInteractions" | "disableTogglingLegendItems" | "enableBetaFeatures" | "enableConfiguration" | "enableResponsiveFeatures" | "errorPolicy" | "featureIndex" | "filterByExtent" | "filterBySelection" | "filterByViewExtent" | "gaugeInnerLabelFormatter" | "guideTooltipFormatter" | "hideEmptySeries" | "hideLicenseWatermark" | "hideLoaderAnimation" | "hideUIMessages" | "hideZeroCountCategories" | "ignoreSmoothRenderingLimit" | "ignoreViewExtent" | "interactionsDisabled" | "layer" | "layerFieldsChangePolicy" | "layerFilterChangePolicy" | "layerItemId" | "layerRendererChangePolicy" | "legendInteractionsDisabled" | "legendPosition" | "legendValueLabelFormatter" | "legendVisibility" | "loaderColors" | "mapLayerId" | "messageOverrides" | "model" | "nullAsValid" | "placeholder" | "popupTemplateFieldInfosEnabled" | "queueChartCreation" | "referenceElement" | "replaceNoValueCategoryWithZero" | "returnFeaturesExtent" | "returnSelectionIndexes" | "returnSelectionOIDs" | "rotated" | "rotation" | "runtimeDataFilters" | "secondaryYAxisLabelFormatter" | "selectionData" | "selectionManager" | "selectionTheme" | "setTimeBinningInfoWhenNotProvided" | "showEmptySeries" | "showLicenseWatermark" | "showUIMessages" | "skipChartCreationQueue" | "syncChartsSelection" | "syncSelection" | "syncSelectionsBetweenChartAndLayerViewPolicy" | "syncViewSelection" | "syncViewTimeExtent" | "syncViewTimeZone" | "syncViewTimeZoneInclusionList" | "timeZone" | "togglingLegendItemsDisabled" | "tooltipFormatter" | "truncateLongTitles" | "updateSplitBySeries" | "useAnimatedCharts" | "usePopupTemplateFieldsInfo" | "view" | "viewTimeExtentChangePolicy" | "xAxisLabelFormatter" | "yAxisLabelFormatter" | "zeroCountAsValid">>, HTMLProps<ArcgisChart> {
|
|
7
|
+
interface ReactArcgisChart extends Partial<Pick<ArcgisChart, "actionMode" | "allowUsingObjectIdStat" | "animationEnabled" | "animationsEnabled" | "aria" | "autoDestroyDisabled" | "autoDisposeChart" | "autoInverseDataLabelTextColor" | "calciteThemingCSSVariables" | "chartIndex" | "chartLimits" | "chartWillRender" | "columnGapsEnabled" | "configurationEnabled" | "cursorRange" | "dataLabelFormatter" | "disableInteractions" | "disableTogglingLegendItems" | "enableBetaFeatures" | "enableConfiguration" | "enableResponsiveFeatures" | "errorPolicy" | "featureIndex" | "filterByExtent" | "filterBySelection" | "filterByViewExtent" | "gaugeInnerLabelFormatter" | "guideTooltipFormatter" | "hideEmptySeries" | "hideLicenseWatermark" | "hideLoaderAnimation" | "hideUIMessages" | "hideZeroCountCategories" | "ignoreSmoothRenderingLimit" | "ignoreViewExtent" | "interactionsDisabled" | "layer" | "layerFieldsChangePolicy" | "layerFilterChangePolicy" | "layerItemId" | "layerRendererChangePolicy" | "legendInteractionsDisabled" | "legendPosition" | "legendValueLabelFormatter" | "legendVisibility" | "loaderColors" | "mapLayerId" | "messageOverrides" | "model" | "nullAsValid" | "placeholder" | "popupTemplateFieldInfosEnabled" | "queueChartCreation" | "referenceElement" | "replaceNoValueCategoryWithZero" | "returnFeaturesExtent" | "returnSelectionIndexes" | "returnSelectionOIDs" | "rotated" | "rotation" | "runtimeDataFilters" | "secondaryYAxisLabelFormatter" | "selectionData" | "selectionManager" | "selectionTheme" | "setTimeBinningInfoWhenNotProvided" | "showEmptySeries" | "showLicenseWatermark" | "showUIMessages" | "skipChartCreationQueue" | "syncChartsSelection" | "syncSelection" | "syncSelectionsBetweenChartAndLayerViewPolicy" | "syncViewSelection" | "syncViewTimeExtent" | "syncViewTimeZone" | "syncViewTimeZoneInclusionList" | "timeZone" | "togglingLegendItemsDisabled" | "tooltipFormatter" | "truncateLongTitles" | "updateSplitBySeries" | "useAnimatedCharts" | "usePopupTemplateFieldsInfo" | "view" | "viewTimeExtentChangePolicy" | "xAxisLabelFormatter" | "yAxisLabelFormatter" | "zeroCountAsValid">>, HTMLProps<ArcgisChart> {
|
|
8
8
|
onarcgisAxesMinMaxChange?: EventHandler<ArcgisChart["arcgisAxesMinMaxChange"]>;
|
|
9
9
|
onarcgisBadDataWarningRaise?: EventHandler<ArcgisChart["arcgisBadDataWarningRaise"]>;
|
|
10
10
|
onarcgisChartNotFoundWarning?: EventHandler<ArcgisChart["arcgisChartNotFoundWarning"]>;
|
|
@@ -12,6 +12,7 @@ interface ReactArcgisChart extends Partial<Pick<ArcgisChart, "actionMode" | "all
|
|
|
12
12
|
onarcgisDataFetchComplete?: EventHandler<ArcgisChart["arcgisDataFetchComplete"]>;
|
|
13
13
|
onarcgisDataProcessComplete?: EventHandler<ArcgisChart["arcgisDataProcessComplete"]>;
|
|
14
14
|
onarcgisDataProcessError?: EventHandler<ArcgisChart["arcgisDataProcessError"]>;
|
|
15
|
+
/** @deprecated since 5.1. Won't be replaced. */
|
|
15
16
|
onarcgisInvalidConfigWarningRaise?: EventHandler<ArcgisChart["arcgisInvalidConfigWarningRaise"]>;
|
|
16
17
|
onarcgisLegendItemVisibilityChange?: EventHandler<ArcgisChart["arcgisLegendItemVisibilityChange"]>;
|
|
17
18
|
onarcgisNoRenderPropChange?: EventHandler<ArcgisChart["arcgisNoRenderPropChange"]>;
|
|
@@ -20,6 +21,7 @@ interface ReactArcgisChart extends Partial<Pick<ArcgisChart, "actionMode" | "all
|
|
|
20
21
|
onarcgisSelectionComplete?: EventHandler<ArcgisChart["arcgisSelectionComplete"]>;
|
|
21
22
|
onarcgisSeriesColorChange?: EventHandler<ArcgisChart["arcgisSeriesColorChange"]>;
|
|
22
23
|
onarcgisSeriesOrder?: EventHandler<ArcgisChart["arcgisSeriesOrder"]>;
|
|
24
|
+
/** @deprecated since 5.2. Use [@arcgisRenderingComplete](https://developers.arcgis.com/javascript/latest/references/charts-components/components/arcgis-chart/#event-arcgisRenderingComplete) instead. */
|
|
23
25
|
onarcgisUpdateComplete?: EventHandler<ArcgisChart["arcgisUpdateComplete"]>;
|
|
24
26
|
}
|
|
25
27
|
|
package/dist/types/stencil.d.ts
CHANGED
|
@@ -4,7 +4,7 @@ import type { ArcgisChartsActionBar } from "../components/arcgis-charts-action-b
|
|
|
4
4
|
import { JSXBase as StencilJsx } from "@stencil/core/internal";
|
|
5
5
|
import type { EventHandler } from "@arcgis/lumina";
|
|
6
6
|
|
|
7
|
-
interface StencilArcgisChart extends Partial<Pick<ArcgisChart, "actionMode" | "allowUsingObjectIdStat" | "animationEnabled" | "aria" | "autoDestroyDisabled" | "autoDisposeChart" | "autoInverseDataLabelTextColor" | "calciteThemingCSSVariables" | "chartIndex" | "chartLimits" | "chartWillRender" | "configurationEnabled" | "cursorRange" | "dataLabelFormatter" | "disableInteractions" | "disableTogglingLegendItems" | "enableBetaFeatures" | "enableConfiguration" | "enableResponsiveFeatures" | "errorPolicy" | "featureIndex" | "filterByExtent" | "filterBySelection" | "filterByViewExtent" | "gaugeInnerLabelFormatter" | "guideTooltipFormatter" | "hideEmptySeries" | "hideLicenseWatermark" | "hideLoaderAnimation" | "hideUIMessages" | "hideZeroCountCategories" | "ignoreSmoothRenderingLimit" | "ignoreViewExtent" | "interactionsDisabled" | "layer" | "layerFieldsChangePolicy" | "layerFilterChangePolicy" | "layerItemId" | "layerRendererChangePolicy" | "legendInteractionsDisabled" | "legendPosition" | "legendValueLabelFormatter" | "legendVisibility" | "loaderColors" | "mapLayerId" | "messageOverrides" | "model" | "nullAsValid" | "placeholder" | "popupTemplateFieldInfosEnabled" | "queueChartCreation" | "referenceElement" | "replaceNoValueCategoryWithZero" | "returnFeaturesExtent" | "returnSelectionIndexes" | "returnSelectionOIDs" | "rotated" | "rotation" | "runtimeDataFilters" | "secondaryYAxisLabelFormatter" | "selectionData" | "selectionManager" | "selectionTheme" | "setTimeBinningInfoWhenNotProvided" | "showEmptySeries" | "showLicenseWatermark" | "showUIMessages" | "skipChartCreationQueue" | "syncChartsSelection" | "syncSelection" | "syncSelectionsBetweenChartAndLayerViewPolicy" | "syncViewSelection" | "syncViewTimeExtent" | "syncViewTimeZone" | "syncViewTimeZoneInclusionList" | "timeZone" | "togglingLegendItemsDisabled" | "tooltipFormatter" | "truncateLongTitles" | "updateSplitBySeries" | "useAnimatedCharts" | "usePopupTemplateFieldsInfo" | "view" | "viewTimeExtentChangePolicy" | "xAxisLabelFormatter" | "yAxisLabelFormatter" | "zeroCountAsValid">>, StencilJsx.HTMLAttributes<ArcgisChart> {
|
|
7
|
+
interface StencilArcgisChart extends Partial<Pick<ArcgisChart, "actionMode" | "allowUsingObjectIdStat" | "animationEnabled" | "animationsEnabled" | "aria" | "autoDestroyDisabled" | "autoDisposeChart" | "autoInverseDataLabelTextColor" | "calciteThemingCSSVariables" | "chartIndex" | "chartLimits" | "chartWillRender" | "columnGapsEnabled" | "configurationEnabled" | "cursorRange" | "dataLabelFormatter" | "disableInteractions" | "disableTogglingLegendItems" | "enableBetaFeatures" | "enableConfiguration" | "enableResponsiveFeatures" | "errorPolicy" | "featureIndex" | "filterByExtent" | "filterBySelection" | "filterByViewExtent" | "gaugeInnerLabelFormatter" | "guideTooltipFormatter" | "hideEmptySeries" | "hideLicenseWatermark" | "hideLoaderAnimation" | "hideUIMessages" | "hideZeroCountCategories" | "ignoreSmoothRenderingLimit" | "ignoreViewExtent" | "interactionsDisabled" | "layer" | "layerFieldsChangePolicy" | "layerFilterChangePolicy" | "layerItemId" | "layerRendererChangePolicy" | "legendInteractionsDisabled" | "legendPosition" | "legendValueLabelFormatter" | "legendVisibility" | "loaderColors" | "mapLayerId" | "messageOverrides" | "model" | "nullAsValid" | "placeholder" | "popupTemplateFieldInfosEnabled" | "queueChartCreation" | "referenceElement" | "replaceNoValueCategoryWithZero" | "returnFeaturesExtent" | "returnSelectionIndexes" | "returnSelectionOIDs" | "rotated" | "rotation" | "runtimeDataFilters" | "secondaryYAxisLabelFormatter" | "selectionData" | "selectionManager" | "selectionTheme" | "setTimeBinningInfoWhenNotProvided" | "showEmptySeries" | "showLicenseWatermark" | "showUIMessages" | "skipChartCreationQueue" | "syncChartsSelection" | "syncSelection" | "syncSelectionsBetweenChartAndLayerViewPolicy" | "syncViewSelection" | "syncViewTimeExtent" | "syncViewTimeZone" | "syncViewTimeZoneInclusionList" | "timeZone" | "togglingLegendItemsDisabled" | "tooltipFormatter" | "truncateLongTitles" | "updateSplitBySeries" | "useAnimatedCharts" | "usePopupTemplateFieldsInfo" | "view" | "viewTimeExtentChangePolicy" | "xAxisLabelFormatter" | "yAxisLabelFormatter" | "zeroCountAsValid">>, StencilJsx.HTMLAttributes<ArcgisChart> {
|
|
8
8
|
onArcgisAxesMinMaxChange?: EventHandler<ArcgisChart["arcgisAxesMinMaxChange"]>;
|
|
9
9
|
onArcgisBadDataWarningRaise?: EventHandler<ArcgisChart["arcgisBadDataWarningRaise"]>;
|
|
10
10
|
onArcgisChartNotFoundWarning?: EventHandler<ArcgisChart["arcgisChartNotFoundWarning"]>;
|
|
@@ -12,6 +12,7 @@ interface StencilArcgisChart extends Partial<Pick<ArcgisChart, "actionMode" | "a
|
|
|
12
12
|
onArcgisDataFetchComplete?: EventHandler<ArcgisChart["arcgisDataFetchComplete"]>;
|
|
13
13
|
onArcgisDataProcessComplete?: EventHandler<ArcgisChart["arcgisDataProcessComplete"]>;
|
|
14
14
|
onArcgisDataProcessError?: EventHandler<ArcgisChart["arcgisDataProcessError"]>;
|
|
15
|
+
/** @deprecated since 5.1. Won't be replaced. */
|
|
15
16
|
onArcgisInvalidConfigWarningRaise?: EventHandler<ArcgisChart["arcgisInvalidConfigWarningRaise"]>;
|
|
16
17
|
onArcgisLegendItemVisibilityChange?: EventHandler<ArcgisChart["arcgisLegendItemVisibilityChange"]>;
|
|
17
18
|
onArcgisNoRenderPropChange?: EventHandler<ArcgisChart["arcgisNoRenderPropChange"]>;
|
|
@@ -20,6 +21,7 @@ interface StencilArcgisChart extends Partial<Pick<ArcgisChart, "actionMode" | "a
|
|
|
20
21
|
onArcgisSelectionComplete?: EventHandler<ArcgisChart["arcgisSelectionComplete"]>;
|
|
21
22
|
onArcgisSeriesColorChange?: EventHandler<ArcgisChart["arcgisSeriesColorChange"]>;
|
|
22
23
|
onArcgisSeriesOrder?: EventHandler<ArcgisChart["arcgisSeriesOrder"]>;
|
|
24
|
+
/** @deprecated since 5.2. Use [@arcgisRenderingComplete](https://developers.arcgis.com/javascript/latest/references/charts-components/components/arcgis-chart/#event-arcgisRenderingComplete) instead. */
|
|
23
25
|
onArcgisUpdateComplete?: EventHandler<ArcgisChart["arcgisUpdateComplete"]>;
|
|
24
26
|
}
|
|
25
27
|
|