@arcgis/charts-components 6.0.0-next.3 → 6.0.0-next.31
This diff represents the content of publicly available package versions that have been released to one of the supported registries. The information contained in this diff is provided for informational purposes only and reflects changes between package versions as they appear in their respective public registries.
- package/dist/cdn/2FSC4TII.js +2 -0
- package/dist/cdn/2P3VH3BF.js +2 -0
- package/dist/cdn/3YLQHPDB.js +2 -0
- package/dist/cdn/424VG732.js +2 -0
- package/dist/cdn/47MLKUMN.js +2 -0
- package/dist/cdn/4B7KYFKX.js +2 -0
- package/dist/cdn/4E7XIO26.js +2 -0
- package/dist/cdn/4FZEHAQ3.js +2 -0
- package/dist/cdn/4L3DNWI7.js +2 -0
- package/dist/cdn/4O5PXQHF.js +4 -0
- package/dist/cdn/4UGEZMMX.js +2 -0
- package/dist/cdn/{H5VCT3XP.js → 5EAIW2ZK.js} +1 -1
- package/dist/cdn/5PW4T4LC.js +2 -0
- package/dist/cdn/{33LWKOPD.js → 6GBCPR5J.js} +1 -1
- package/dist/cdn/{563H5HEV.js → 6SLVQTPT.js} +1 -1
- package/dist/cdn/{VSKK65CP.js → 6SVLCTQS.js} +1 -1
- package/dist/cdn/6WXE7PI7.js +2 -0
- package/dist/cdn/7HBNUKHF.js +2 -0
- package/dist/cdn/7KGHI7WT.js +2 -0
- package/dist/cdn/7KIHMJWQ.js +2 -0
- package/dist/cdn/7L6DK5OS.js +2 -0
- package/dist/cdn/7RPS2ZKZ.js +2 -0
- package/dist/cdn/7TSIJZWC.js +2 -0
- package/dist/cdn/ADENRYX7.js +2 -0
- package/dist/cdn/BAC6JT5W.js +2 -0
- package/dist/cdn/{CLCHZMZ5.js → BDR6ELDH.js} +1 -1
- package/dist/cdn/BIFGQ23U.js +2 -0
- package/dist/cdn/BWNBESN5.js +2 -0
- package/dist/cdn/CUOXXQBF.js +2 -0
- package/dist/cdn/{6RGTAMGU.js → CUQWT4QG.js} +1 -1
- package/dist/cdn/CVYI4FDJ.js +2 -0
- package/dist/cdn/CY3KIENE.js +2 -0
- package/dist/cdn/{FKES55PK.js → DH2G4KHH.js} +1 -1
- package/dist/cdn/DK5CFPVG.js +2 -0
- package/dist/cdn/DYGFR6KY.js +2 -0
- package/dist/cdn/E5F3CSMH.js +2 -0
- package/dist/cdn/EEZEPHWK.js +2 -0
- package/dist/cdn/{PQ3XCNCP.js → EGEYRUPY.js} +1 -1
- package/dist/cdn/FFU63U6V.js +2 -0
- package/dist/cdn/FWGGOXK6.js +2 -0
- package/dist/cdn/GIJFJBQ5.js +2 -0
- package/dist/cdn/GTXF2Q7A.js +2 -0
- package/dist/cdn/{KK445MLC.js → GU6VG5TK.js} +1 -1
- package/dist/cdn/H4EBGCSZ.js +2 -0
- package/dist/cdn/HECZ3OT6.js +4 -0
- package/dist/cdn/HEL54XVB.js +2 -0
- package/dist/cdn/HR5JU7P5.js +2 -0
- package/dist/cdn/ICEANLLZ.js +2 -0
- package/dist/cdn/IRSIUA3Z.js +2 -0
- package/dist/cdn/J77BQI65.js +2 -0
- package/dist/cdn/JFZ5WV6G.js +2 -0
- package/dist/cdn/{V5Z75IQI.js → JON7QEXZ.js} +2 -2
- package/dist/cdn/JTXDHQSH.js +2 -0
- package/dist/cdn/KNJKA4IL.js +2 -0
- package/dist/cdn/{OYUTQX4U.js → KW3N46DO.js} +1 -1
- package/dist/cdn/L2G4TISY.js +2 -0
- package/dist/cdn/LEWMDRPW.js +2 -0
- package/dist/cdn/LHYWDDAS.js +2 -0
- package/dist/cdn/LSO2XNPH.js +4 -0
- package/dist/cdn/M4DADMOO.js +2 -0
- package/dist/cdn/{PIGINE4M.js → M7MSRLEE.js} +1 -1
- package/dist/cdn/MIONK5O5.js +2 -0
- package/dist/cdn/MVPGEBWQ.js +2 -0
- package/dist/cdn/N45L56WG.js +2 -0
- package/dist/cdn/NEVDA2IQ.js +2 -0
- package/dist/cdn/{LPLMRI3E.js → OJFYB73J.js} +1 -1
- package/dist/cdn/{2WQNU554.js → OLXXAT2G.js} +1 -1
- package/dist/cdn/OXASIEVD.js +2 -0
- package/dist/cdn/PB4WIYWN.js +2 -0
- package/dist/cdn/{FM6F6ZYW.js → PSKIJ3SM.js} +1 -1
- package/dist/cdn/PV7DIUGW.js +2 -0
- package/dist/cdn/PY7P35QO.js +2 -0
- package/dist/cdn/{FNXREQOE.js → Q3P2IG23.js} +1 -1
- package/dist/cdn/QCSV57EQ.js +2 -0
- package/dist/cdn/QGRQW5WK.js +2 -0
- package/dist/cdn/{S2BGEXZV.js → R6XBFNY4.js} +1 -1
- package/dist/cdn/RGPG43GI.js +2 -0
- package/dist/cdn/S4SOKS52.js +2 -0
- package/dist/cdn/SAK4CBE7.js +2 -0
- package/dist/cdn/SD2WCRDV.js +2 -0
- package/dist/cdn/SMNUEDMN.js +2 -0
- package/dist/cdn/T35WVFIU.js +2 -0
- package/dist/cdn/TFJ4OWRJ.js +2 -0
- package/dist/cdn/TLC7ZXQM.js +2 -0
- package/dist/cdn/TQHFCEOB.js +2 -0
- package/dist/cdn/USYS3LBV.js +2 -0
- package/dist/cdn/VAUOYVAJ.js +2 -0
- package/dist/cdn/{INYMF2BQ.js → VKMVMHTT.js} +1 -1
- package/dist/cdn/VOY3C6F2.js +2 -0
- package/dist/cdn/WE4SAQIV.js +2 -0
- package/dist/cdn/WFMIM4RW.js +2 -0
- package/dist/cdn/WPAN7ZED.js +2 -0
- package/dist/cdn/XB6GQZZL.js +2 -0
- package/dist/cdn/{HMZRDWG2.js → XERWQ4IR.js} +27 -27
- package/dist/cdn/XFXZYSPI.js +2 -0
- package/dist/cdn/{CUMXC4O4.js → XI6OEXXA.js} +1 -1
- package/dist/cdn/XR46HOI2.js +2 -0
- package/dist/cdn/Y672RHLI.js +2 -0
- package/dist/cdn/{OZSHGMU6.js → Y6URECIF.js} +1 -1
- package/dist/cdn/YK5YAUHK.js +2 -0
- package/dist/cdn/YKSQH65V.js +2 -0
- package/dist/cdn/{QQFMQAJ3.js → ZHMYNWSY.js} +1 -1
- package/dist/cdn/index.js +1 -1
- package/dist/cdn/model/shared/setup-utils.js +1 -1
- package/dist/chart-rendering/common/interfaces.d.ts +7 -0
- package/dist/chunks/action-bar-utils.js +18 -20
- package/dist/chunks/axis-lines-symbol.js +6 -6
- package/dist/chunks/bar-chart-model.js +6 -8
- package/dist/chunks/box-plot-data.js +164 -163
- package/dist/chunks/box-plot-model.js +40 -38
- package/dist/chunks/chart-model.js +37 -39
- package/dist/chunks/chart-ui-utils.js +45 -47
- package/dist/chunks/chart-ui-utils2.js +1 -1
- package/dist/chunks/class-breaks.js +11 -11
- package/dist/chunks/combo-bar-line-chart-model.js +15 -16
- package/dist/chunks/data-labels-symbol.js +1 -1
- package/dist/chunks/data-labels-visibility.js +1 -1
- package/dist/chunks/data.js +49 -51
- package/dist/chunks/gauge-model.js +64 -64
- package/dist/chunks/generate-x-axis-title.js +17 -17
- package/dist/chunks/heat-chart-model.js +13 -14
- package/dist/chunks/histogram-data.js +41 -42
- package/dist/chunks/histogram-model.js +2 -2
- package/dist/chunks/index.js +5432 -4273
- package/dist/chunks/index2.js +1165 -871
- package/dist/chunks/index3.js +11040 -1173
- package/dist/chunks/index4.js +65 -11086
- package/dist/chunks/line-chart-model.js +17 -18
- package/dist/chunks/model-setter.js +6 -6
- package/dist/chunks/model-with-x-guides.js +1 -1
- package/dist/chunks/model-with-y-guides.js +25 -25
- package/dist/chunks/negative-values-stacked-to-baseline.js +2 -2
- package/dist/chunks/pie-chart-data.js +25 -27
- package/dist/chunks/pie-chart-model.js +168 -167
- package/dist/chunks/radar-chart-model.js +6 -7
- package/dist/chunks/resource.js +1 -1
- package/dist/chunks/rotated-state.js +1 -1
- package/dist/chunks/rounded-corners.js +2 -2
- package/dist/chunks/scatterplot-model.js +74 -75
- package/dist/chunks/serial-chart-data.js +513 -513
- package/dist/chunks/serial-chart-model.js +61 -58
- package/dist/chunks/series-length.js +4 -4
- package/dist/chunks/series.js +1 -1
- package/dist/chunks/type-guards.js +109 -55
- package/dist/chunks/utils.js +146 -212
- package/dist/chunks/web-component-utils.js +55 -56
- package/dist/chunks/x-bounds.js +20 -21
- package/dist/components/arcgis-chart/customElement.d.ts +76 -22
- package/dist/components/arcgis-chart/customElement.js +8202 -7978
- package/dist/components/arcgis-charts-action-bar/customElement.js +3 -3
- package/dist/components/arcgis-charts-config-bar-chart/customElement.js +7 -7
- package/dist/components/arcgis-charts-config-bar-chart-data/customElement.js +63 -58
- package/dist/components/arcgis-charts-config-bar-chart-data/index.js +0 -1
- package/dist/components/arcgis-charts-config-bar-chart-popover/customElement.js +11 -12
- package/dist/components/arcgis-charts-config-bar-chart-series/customElement.js +51 -45
- package/dist/components/arcgis-charts-config-bar-chart-series-popover/customElement.js +2 -2
- package/dist/components/arcgis-charts-config-box-plot/customElement.js +1 -1
- package/dist/components/arcgis-charts-config-box-plot-data/customElement.js +115 -113
- package/dist/components/arcgis-charts-config-box-plot-data/index.js +0 -1
- package/dist/components/arcgis-charts-config-box-plot-popover/customElement.js +11 -12
- package/dist/components/arcgis-charts-config-box-plot-series/customElement.js +52 -46
- package/dist/components/arcgis-charts-config-box-plot-series-popover/customElement.js +1 -1
- package/dist/components/arcgis-charts-config-colors/customElement.js +1 -1
- package/dist/components/arcgis-charts-config-create-flow/customElement.js +189 -184
- package/dist/components/arcgis-charts-config-font-style/customElement.js +7 -7
- package/dist/components/arcgis-charts-config-format/customElement.js +37 -38
- package/dist/components/arcgis-charts-config-general/customElement.js +2 -2
- package/dist/components/arcgis-charts-config-guide/customElement.js +7 -7
- package/dist/components/arcgis-charts-config-guides/customElement.js +1 -1
- package/dist/components/arcgis-charts-config-heat-chart/customElement.js +1 -1
- package/dist/components/arcgis-charts-config-heat-chart-data/customElement.js +13 -14
- package/dist/components/arcgis-charts-config-heat-chart-popover/customElement.js +32 -33
- package/dist/components/arcgis-charts-config-histogram/customElement.js +2 -3
- package/dist/components/arcgis-charts-config-histogram-data/customElement.js +4 -5
- package/dist/components/arcgis-charts-config-histogram-popover/customElement.js +8 -9
- package/dist/components/arcgis-charts-config-invalid-input-message/customElement.js +1 -1
- package/dist/components/arcgis-charts-config-line-chart/customElement.js +1 -1
- package/dist/components/arcgis-charts-config-line-chart-data/customElement.js +21 -22
- package/dist/components/arcgis-charts-config-line-chart-data/index.js +0 -1
- package/dist/components/arcgis-charts-config-line-chart-popover/customElement.js +7 -8
- package/dist/components/arcgis-charts-config-line-chart-series/customElement.js +40 -35
- package/dist/components/arcgis-charts-config-line-chart-series-popover/customElement.js +1 -1
- package/dist/components/arcgis-charts-config-pie-chart/customElement.js +38 -34
- package/dist/components/arcgis-charts-config-pie-chart-data/customElement.js +21 -22
- package/dist/components/arcgis-charts-config-pie-chart-data/index.js +1 -1
- package/dist/components/arcgis-charts-config-pie-chart-popover/customElement.js +9 -10
- package/dist/components/arcgis-charts-config-pie-chart-slices/customElement.js +2 -2
- package/dist/components/arcgis-charts-config-pie-chart-slices-popover/customElement.js +1 -1
- package/dist/components/arcgis-charts-config-scatter-plot/customElement.js +3 -4
- package/dist/components/arcgis-charts-config-scatter-plot-aoi/customElement.js +20 -24
- package/dist/components/arcgis-charts-config-scatter-plot-data/customElement.js +79 -79
- package/dist/components/arcgis-charts-config-scatter-plot-popover/customElement.js +3 -4
- package/dist/components/arcgis-charts-config-select-chart-type-popover/customElement.js +21 -25
- package/dist/components/arcgis-charts-config-view-charts/customElement.js +20 -21
- package/dist/components/arcgis-charts-info-modal/customElement.js +4 -4
- package/dist/docs/api.json +1 -1
- package/dist/docs/docs.json +1 -1
- package/dist/docs/vscode.html-custom-data.json +1 -1
- package/dist/docs/web-types.json +1 -1
- package/dist/index.js +322 -322
- package/dist/loader.js +3 -3
- package/dist/model/box-plot-model/box-plot-model.d.ts +6 -2
- package/dist/model/mixins/model-with-multi-axes.d.ts +53 -2
- package/dist/model/pie-chart-model/pie-chart-model.d.ts +6 -2
- package/dist/model/serial-chart-model/serial-chart-model.d.ts +6 -2
- package/dist/spec/rest-js-types.d.ts +1 -5
- package/dist/types/lumina.d.ts +3 -1
- package/dist/types/preact.d.ts +3 -1
- package/dist/types/react.d.ts +3 -1
- package/dist/types/stencil.d.ts +3 -1
- package/dist/utils/chart-config/converter/index.js +91 -93
- package/dist/utils/chart-config/utils/index.d.ts +10 -3
- package/dist/utils/components/interfaces.d.ts +7 -0
- package/dist/utils/data/categorical-data/index.d.ts +1 -0
- package/dist/utils/misc/index.d.ts +4 -4
- package/package.json +7 -7
- package/dist/cdn/23NH4HLE.js +0 -2
- package/dist/cdn/2DRKIHTI.js +0 -2
- package/dist/cdn/2E3WHSEW.js +0 -2
- package/dist/cdn/2RG5JCBW.js +0 -3
- package/dist/cdn/2X2QOEKX.js +0 -2
- package/dist/cdn/37WXQO5B.js +0 -2
- package/dist/cdn/3INTJJ4X.js +0 -2
- package/dist/cdn/3RJNZA24.js +0 -2
- package/dist/cdn/4CU5D5WQ.js +0 -2
- package/dist/cdn/4WQUPC2P.js +0 -2
- package/dist/cdn/5DAVFUDX.js +0 -2
- package/dist/cdn/5VCTFSTZ.js +0 -2
- package/dist/cdn/5XGX5QH2.js +0 -2
- package/dist/cdn/6XH6ZRHO.js +0 -2
- package/dist/cdn/732AMNPK.js +0 -2
- package/dist/cdn/7WD2VKG4.js +0 -2
- package/dist/cdn/7YN565O4.js +0 -2
- package/dist/cdn/A2BFOCSN.js +0 -2
- package/dist/cdn/A5TI5TEO.js +0 -2
- package/dist/cdn/AHB4IS7P.js +0 -2
- package/dist/cdn/B6ADEFC7.js +0 -2
- package/dist/cdn/B6APNE72.js +0 -3
- package/dist/cdn/BDIRQUQE.js +0 -2
- package/dist/cdn/BWZA3447.js +0 -2
- package/dist/cdn/BZTSUXUT.js +0 -2
- package/dist/cdn/CFACTMRG.js +0 -2
- package/dist/cdn/D2LNPCIA.js +0 -2
- package/dist/cdn/D6WQTOUC.js +0 -2
- package/dist/cdn/DTSX7SEI.js +0 -2
- package/dist/cdn/EPFEFHM2.js +0 -2
- package/dist/cdn/EW2P4QSN.js +0 -2
- package/dist/cdn/GDJDA5MG.js +0 -2
- package/dist/cdn/GE7CLC6K.js +0 -4
- package/dist/cdn/GEPIPU4G.js +0 -2
- package/dist/cdn/GSCC3FON.js +0 -2
- package/dist/cdn/GXYGXB4U.js +0 -2
- package/dist/cdn/IEOIKLLK.js +0 -2
- package/dist/cdn/ISSUAEJS.js +0 -2
- package/dist/cdn/KJNBURYA.js +0 -2
- package/dist/cdn/L3AKSDIB.js +0 -2
- package/dist/cdn/L5MTHGFZ.js +0 -2
- package/dist/cdn/LHLPK6TU.js +0 -2
- package/dist/cdn/LXFY54NF.js +0 -2
- package/dist/cdn/MJUCIYQN.js +0 -2
- package/dist/cdn/NGBBNBA7.js +0 -2
- package/dist/cdn/NIZC75X3.js +0 -2
- package/dist/cdn/OBKDR3MU.js +0 -2
- package/dist/cdn/OQKL344Q.js +0 -2
- package/dist/cdn/OZSOICXE.js +0 -2
- package/dist/cdn/PBQRZBQM.js +0 -2
- package/dist/cdn/PT66VVXN.js +0 -2
- package/dist/cdn/QOENPUSD.js +0 -2
- package/dist/cdn/QPVBVDRP.js +0 -2
- package/dist/cdn/RGMPFNUN.js +0 -2
- package/dist/cdn/RGSJ3JFI.js +0 -2
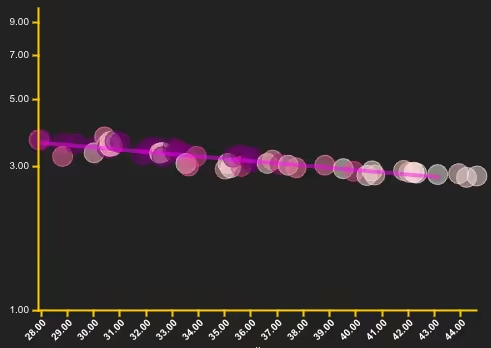
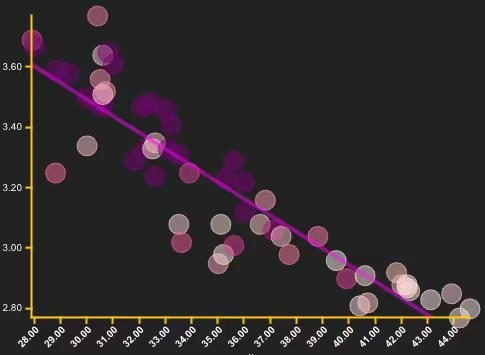
- package/dist/cdn/RVHNFMTN.js +0 -2
- package/dist/cdn/RVQPEB4W.js +0 -2
- package/dist/cdn/RXTO6RE2.js +0 -2
- package/dist/cdn/SCEFJRON.js +0 -2
- package/dist/cdn/SEILP6QP.js +0 -2
- package/dist/cdn/SKI5Z6UH.js +0 -2
- package/dist/cdn/SSEWUPML.js +0 -2
- package/dist/cdn/TCE6PLHN.js +0 -2
- package/dist/cdn/TOCU6UKM.js +0 -2
- package/dist/cdn/TSASF4ZC.js +0 -2
- package/dist/cdn/UDAJILEU.js +0 -2
- package/dist/cdn/UZOYADSB.js +0 -2
- package/dist/cdn/W2PTHYOT.js +0 -2
- package/dist/cdn/W53DMMGZ.js +0 -2
- package/dist/cdn/WAQJ7V62.js +0 -2
- package/dist/cdn/WEPXOYBS.js +0 -2
- package/dist/cdn/WLPUBXN7.js +0 -2
- package/dist/cdn/XPCXTKEY.js +0 -2
- package/dist/cdn/Y2S7EWZR.js +0 -2
- package/dist/cdn/YF6ML4P6.js +0 -4
- package/dist/cdn/YGLBPPXP.js +0 -2
- package/dist/cdn/YWUNLBCQ.js +0 -2
- package/dist/cdn/YYTAWATK.js +0 -2
- package/dist/cdn/ZDQWMMOA.js +0 -2
- package/dist/cdn/ZFHMGE36.js +0 -2
- package/dist/cdn/ZGNJFT7B.js +0 -2
- package/dist/cdn/ZMVIOIBB.js +0 -2
- package/dist/cdn/ZTHSDPEH.js +0 -2
- package/dist/chunks/index5.js +0 -69
- package/dist/chunks/type-guards2.js +0 -113
- package/dist/chunks/utils2.js +0 -63
- /package/dist/cdn/{XFEWDUTX.js → 2PUVZIJ6.js} +0 -0
- /package/dist/cdn/{UHSL7Y3B.js → 33NEGHM6.js} +0 -0
- /package/dist/cdn/{6FW2SXLC.js → 55OFHBXV.js} +0 -0
- /package/dist/cdn/{SMHUUBEU.js → 5OSVKP4N.js} +0 -0
- /package/dist/cdn/{VITUV4HV.js → 5QLZ66AU.js} +0 -0
- /package/dist/cdn/{UQRD2CTK.js → 5SOADBYD.js} +0 -0
- /package/dist/cdn/{55DRYT5X.js → 5ZZZKI7V.js} +0 -0
- /package/dist/cdn/{5ANJA54O.js → 6IIBIZJH.js} +0 -0
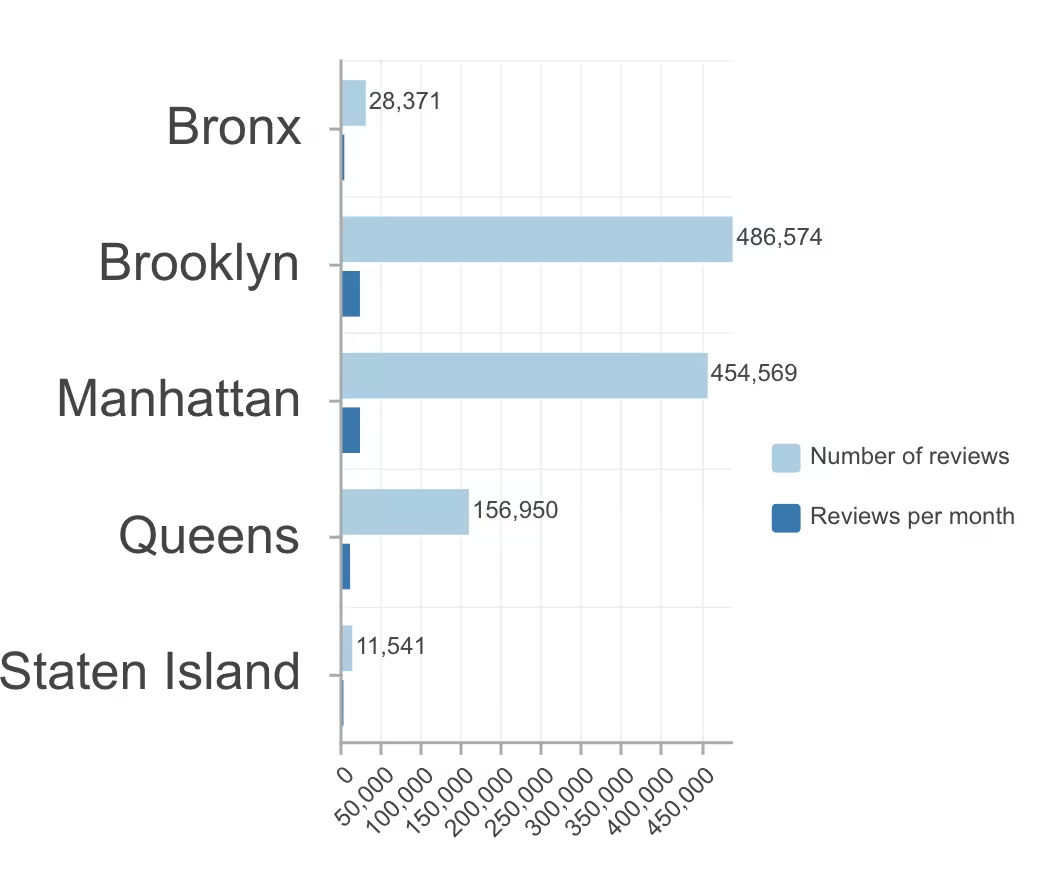
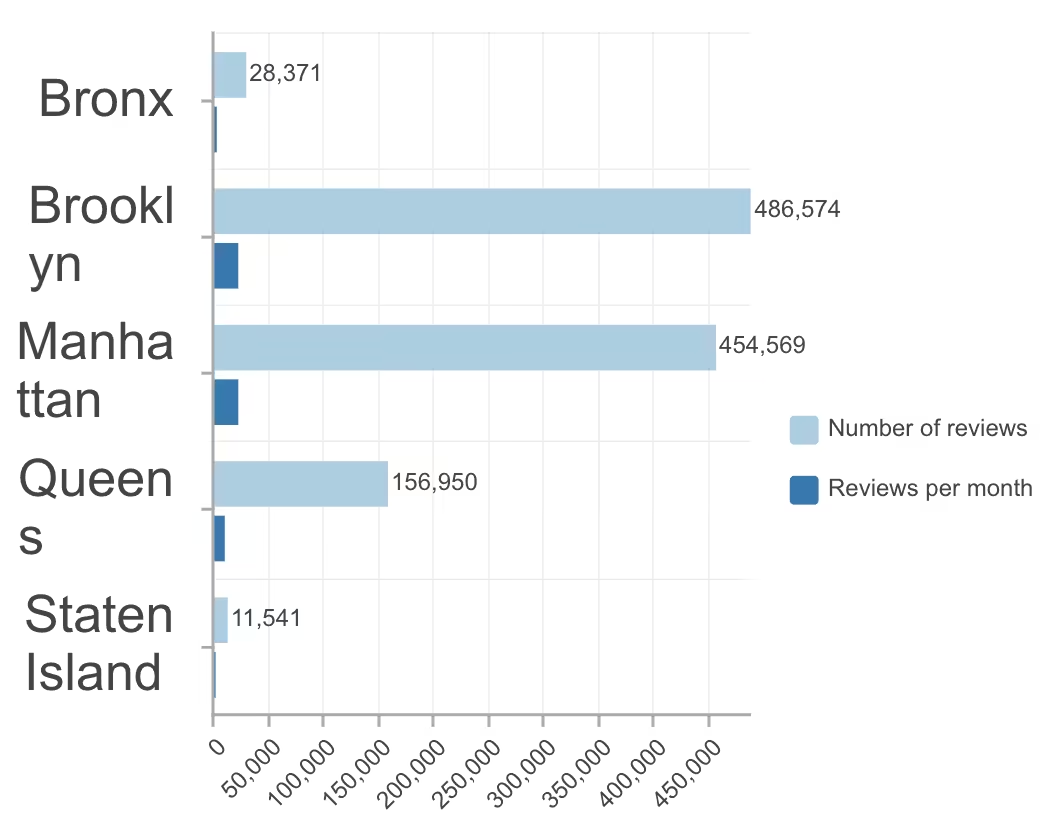
- /package/dist/cdn/{QLBO3URO.js → 6QY2OFUO.js} +0 -0
- /package/dist/cdn/{UITA7CSN.js → 7AWJIBMG.js} +0 -0
- /package/dist/cdn/{OTV3YYDU.js → 7JMZPDM5.js} +0 -0
- /package/dist/cdn/{373UZR4I.js → 7N2LSD5J.js} +0 -0
- /package/dist/cdn/{SCS4MWFN.js → A6DV5ILW.js} +0 -0
- /package/dist/cdn/{VT3NOR5A.js → BGHJMVNV.js} +0 -0
- /package/dist/cdn/{L4KDCWA7.js → BGVIOGAX.js} +0 -0
- /package/dist/cdn/{Z2IHEWWP.js → CYZPIC2B.js} +0 -0
- /package/dist/cdn/{AVRIN2FL.js → CZKZMSFJ.js} +0 -0
- /package/dist/cdn/{WMGJN3JL.js → D66GTKJ7.js} +0 -0
- /package/dist/cdn/{XR7RCGIT.js → DJGQM3EK.js} +0 -0
- /package/dist/cdn/{PQESGESY.js → FOHR4IFG.js} +0 -0
- /package/dist/cdn/{3DDSV3IF.js → GOVIUHKT.js} +0 -0
- /package/dist/cdn/{KE7XE22Z.js → H44RQIWN.js} +0 -0
- /package/dist/cdn/{W7VPVF72.js → HJUHYEJT.js} +0 -0
- /package/dist/cdn/{57RWTLRG.js → HL6ANDJH.js} +0 -0
- /package/dist/cdn/{HUU3QFFC.js → IDVYAUPY.js} +0 -0
- /package/dist/cdn/{XIE5EUIH.js → IQSNWDU6.js} +0 -0
- /package/dist/cdn/{K43DVQFC.js → JE32QM44.js} +0 -0
- /package/dist/cdn/{52PHJCYM.js → JETTF7E2.js} +0 -0
- /package/dist/cdn/{L26HYK34.js → JSOFN65T.js} +0 -0
- /package/dist/cdn/{LE3B3ATZ.js → KMZIRJIR.js} +0 -0
- /package/dist/cdn/{XUSFQDK4.js → KQ36C2RK.js} +0 -0
- /package/dist/cdn/{O6GVF76X.js → KRRYFLG4.js} +0 -0
- /package/dist/cdn/{4MSDOPVE.js → M4AD4UJU.js} +0 -0
- /package/dist/cdn/{2BPLDZAJ.js → NUH2GAPZ.js} +0 -0
- /package/dist/cdn/{Q4H5YVTW.js → OWEVDN6C.js} +0 -0
- /package/dist/cdn/{GCUOASRZ.js → QCFAV626.js} +0 -0
- /package/dist/cdn/{R4PFJLD2.js → QMBHZ5JE.js} +0 -0
- /package/dist/cdn/{J5VMBGYI.js → SWHSL245.js} +0 -0
- /package/dist/cdn/{C7VQM4TH.js → T7LKXFIZ.js} +0 -0
- /package/dist/cdn/{KCP6AJV7.js → XQTLPFTW.js} +0 -0
- /package/dist/cdn/{27C6PCQ2.js → XXO5K6N4.js} +0 -0
- /package/dist/cdn/{3VZK52LO.js → Z5DYKSTK.js} +0 -0
package/dist/loader.js
CHANGED
|
@@ -2,7 +2,7 @@
|
|
|
2
2
|
import { r as e } from "./chunks/runtime.js";
|
|
3
3
|
import { makeDefineCustomElements as t } from "@arcgis/lumina";
|
|
4
4
|
const a = t(e, {
|
|
5
|
-
"arcgis-chart": [() => import("./components/arcgis-chart/customElement.js"), "_commonStrings:,_messages:,actionMode,allowUsingObjectIdStat,animationEnabled,aria:,autoDestroyDisabled,autoDisposeChart,autoInverseDataLabelTextColor,calciteThemingCSSVariables:,chartIndex,chartLimits:,chartWillRender:,configurationEnabled,cursorRange,dataLabelFormatter:,disableInteractions,disableTogglingLegendItems,enableBetaFeatures,enableConfiguration,enableResponsiveFeatures,errorPolicy,featureIndex,filterByExtent,filterBySelection,filterByViewExtent,gaugeInnerLabelFormatter:,guideTooltipFormatter:,hideEmptySeries,hideLicenseWatermark,hideLoaderAnimation,hideUIMessages,hideZeroCountCategories,ignoreSmoothRenderingLimit,ignoreViewExtent,interactionsDisabled,layer:,layerFieldsChangePolicy,layerFilterChangePolicy,layerItemId,layerRendererChangePolicy,legendInteractionsDisabled,legendPosition,legendValueLabelFormatter:,legendVisibility,loaderColors:,mapLayerId,messageOverrides:,model:,nullAsValid,placeholder,popupTemplateFieldInfosEnabled,queueChartCreation,referenceElement,replaceNoValueCategoryWithZero,returnFeaturesExtent,returnSelectionIndexes,returnSelectionOIDs,rotated,rotation,runtimeDataFilters:,secondaryYAxisLabelFormatter:,selectionData:,selectionManager:,selectionTheme:,setTimeBinningInfoWhenNotProvided,showEmptySeries,showLicenseWatermark,showUIMessages,skipChartCreationQueue,syncChartsSelection,syncSelection,syncSelectionsBetweenChartAndLayerViewPolicy,syncViewSelection,syncViewTimeExtent,syncViewTimeZone,syncViewTimeZoneInclusionList:,timeZone,togglingLegendItemsDisabled,tooltipFormatter:,truncateLongTitles,updateSplitBySeries:,useAnimatedCharts,usePopupTemplateFieldsInfo,view:,viewTimeExtentChangePolicy,xAxisLabelFormatter:,yAxisLabelFormatter:,zeroCountAsValid;clearSelection,destroy,errorAlert,exportAsCSV,exportAsImage,loadModel,notify,refresh,resetZoom,switchSelection;applySelectionFromSelectionManager"],
|
|
5
|
+
"arcgis-chart": [() => import("./components/arcgis-chart/customElement.js"), "_commonStrings:,_messages:,actionMode,allowUsingObjectIdStat,animationEnabled,animationsEnabled,aria:,autoDestroyDisabled,autoDisposeChart,autoInverseDataLabelTextColor,calciteThemingCSSVariables:,chartIndex,chartLimits:,chartWillRender:,columnGapsEnabled,configurationEnabled,cursorRange,dataLabelFormatter:,disableInteractions,disableTogglingLegendItems,enableBetaFeatures,enableConfiguration,enableResponsiveFeatures,errorPolicy,featureIndex,filterByExtent,filterBySelection,filterByViewExtent,gaugeInnerLabelFormatter:,guideTooltipFormatter:,hideEmptySeries,hideLicenseWatermark,hideLoaderAnimation,hideUIMessages,hideZeroCountCategories,ignoreSmoothRenderingLimit,ignoreViewExtent,interactionsDisabled,layer:,layerFieldsChangePolicy,layerFilterChangePolicy,layerItemId,layerRendererChangePolicy,legendInteractionsDisabled,legendPosition,legendValueLabelFormatter:,legendVisibility,loaderColors:,mapLayerId,messageOverrides:,model:,nullAsValid,placeholder,popupTemplateFieldInfosEnabled,queueChartCreation,referenceElement,replaceNoValueCategoryWithZero,returnFeaturesExtent,returnSelectionIndexes,returnSelectionOIDs,rotated,rotation,runtimeDataFilters:,secondaryYAxisLabelFormatter:,selectionData:,selectionManager:,selectionTheme:,setTimeBinningInfoWhenNotProvided,showEmptySeries,showLicenseWatermark,showUIMessages,skipChartCreationQueue,syncChartsSelection,syncSelection,syncSelectionsBetweenChartAndLayerViewPolicy,syncViewSelection,syncViewTimeExtent,syncViewTimeZone,syncViewTimeZoneInclusionList:,timeZone,togglingLegendItemsDisabled,tooltipFormatter:,truncateLongTitles,updateSplitBySeries:,useAnimatedCharts,usePopupTemplateFieldsInfo,view:,viewTimeExtentChangePolicy,xAxisLabelFormatter:,yAxisLabelFormatter:,zeroCountAsValid;clearSelection,destroy,errorAlert,exportAsCSV,exportAsImage,loadModel,notify,refresh,resetZoom,switchSelection;applySelectionFromSelectionManager"],
|
|
6
6
|
"arcgis-charts-action-bar": [() => import("./components/arcgis-charts-action-bar/customElement.js"), "_messages:,actionBarSelectionMode,chartElement:,chartType,clearSelectionActive,clearSelectionDisabled,clearSelectionState,clearSelectionTitle,clearSelectionToggle,commonStrings:,csvExportExclusionList:,disableCSVExportForChartTypes:,editChartActive,editChartEnabled,editChartState,editChartTitle,editChartToggle,expanded,exportActionDisabled,exportActionState,exportAsCSVDisabled,exportAsCSVState,exportAsCSVTitle,exportAsImageDisabled,exportAsImageState,exportAsImageTitle,filterByExtentState,filterByExtentTitle,filterByExtentToggle,filterBySelectionActive,filterBySelectionDisabled,filterBySelectionState,filterBySelectionTitle,filterBySelectionToggle,filterByViewExtentActive,filterByViewExtentDisabled,filterByViewExtentTitle,forceDisableActions,fullExtentActive,fullExtentDisabled,fullExtentState,fullExtentTitle,fullExtentToggle,hiddenActions:,legendActive,legendDisabled,legendState,legendTitle,legendToggle,messageOverrides:,rotateChartActive,rotateChartDisabled,rotateChartState,rotateChartTitle,rotateChartToggle,selectionActive,selectionDisabled,selectionState,selectionTitle,selectionToggle,switchSelectionActive,switchSelectionDisabled,switchSelectionState,switchSelectionTitle,switchSelectionToggle,zoomActive,zoomDisabled,zoomState,zoomTitle,zoomToggle"],
|
|
7
7
|
"arcgis-charts-config-axes": [() => import("./components/arcgis-charts-config-axes/customElement.js"), "calculatedDataMinMaxBounds:,calculatedMinMaxBounds:,messageOverrides:,model:,open,showEnableXLogOption,showEnableYLogOption,showMaxXBoundOption,showMaxYBoundOption,showMinXBoundOption,showMinYBoundOption"],
|
|
8
8
|
"arcgis-charts-config-axis": [() => import("./components/arcgis-charts-config-axis/customElement.js"), "axisTitle,dataMaxValue,dataMinValue,initialMaxBound,initialMinBound,isXAxis,maxBoundMaxLimit,maxBoundMinLimit,messageOverrides:,minBoundMaxLimit,minBoundMinLimit,model:,showEnableLogOption,showMaxBoundOption,showMinBoundOption"],
|
|
@@ -50,10 +50,10 @@ const a = t(e, {
|
|
|
50
50
|
"arcgis-charts-config-pie-chart-slices": [() => import("./components/arcgis-charts-config-pie-chart-slices/customElement.js"), "chartData:,messageOverrides:,model:,popoverPlacement"],
|
|
51
51
|
"arcgis-charts-config-pie-chart-slices-popover": [() => import("./components/arcgis-charts-config-pie-chart-slices-popover/customElement.js"), "messageOverrides:,open,placement,referenceElement:,selectedColor:,selectedName,selectedSliceId;reposition"],
|
|
52
52
|
"arcgis-charts-config-scatter-plot": [() => import("./components/arcgis-charts-config-scatter-plot/customElement.js"), "calculatedDataMinMaxBounds:,calculatedMinMaxBounds:,layer:,model:,page,popoverPlacement,popupTemplateFieldInfosEnabled,r2,usePopupTemplateFieldsInfo,view:"],
|
|
53
|
-
"arcgis-charts-config-scatter-plot-aoi": [() => import("./components/arcgis-charts-config-scatter-plot-aoi/customElement.js"), "messageOverrides:,view:"],
|
|
53
|
+
"arcgis-charts-config-scatter-plot-aoi": [() => import("./components/arcgis-charts-config-scatter-plot-aoi/customElement.js"), "messageOverrides:,tool,view:"],
|
|
54
54
|
"arcgis-charts-config-scatter-plot-data": [() => import("./components/arcgis-charts-config-scatter-plot-data/customElement.js"), "isTableLayer,layerFieldsInfo:,messageOverrides:,model:,r2,view:"],
|
|
55
55
|
"arcgis-charts-config-scatter-plot-popover": [() => import("./components/arcgis-charts-config-scatter-plot-popover/customElement.js"), "contentKind,headingTitle,layerFieldsInfo:,messageOverrides:,open,placement,referenceElement:,selectedContent;reposition"],
|
|
56
|
-
"arcgis-charts-config-select-chart-type-popover": [() => import("./components/arcgis-charts-config-select-chart-type-popover/customElement.js"), "headerTitle,
|
|
56
|
+
"arcgis-charts-config-select-chart-type-popover": [() => import("./components/arcgis-charts-config-select-chart-type-popover/customElement.js"), "headerTitle,layerId,layerType,messageOverrides:,open,popoverPlacement,referenceElement:,selectedModelType,supportedChartTypes:;reposition"],
|
|
57
57
|
"arcgis-charts-config-view-charts": [() => import("./components/arcgis-charts-config-view-charts/customElement.js"), "disableEditing,layer:,messageOverrides:,modelList:,noGroup,selectedChartId"],
|
|
58
58
|
"arcgis-charts-info-modal": [() => import("./components/arcgis-charts-info-modal/customElement.js"), "calciteThemeColors:,heading,loaderColors:,message,showLoader"]
|
|
59
59
|
});
|
|
@@ -83,8 +83,12 @@ export class BoxPlotModel extends BoxPlotModelSuperclass {
|
|
|
83
83
|
generateChartTitle(): string;
|
|
84
84
|
/** Generate the proper y-axis title given the current config. */
|
|
85
85
|
generateYAxisTitle(): string;
|
|
86
|
-
/**
|
|
87
|
-
|
|
86
|
+
/**
|
|
87
|
+
* Gets the list of the category values for the chart.
|
|
88
|
+
*
|
|
89
|
+
* @param num - The maximum number of category values to fetch.
|
|
90
|
+
*/
|
|
91
|
+
getCustomSortValues(num?: number): Promise<string[]>;
|
|
88
92
|
/**
|
|
89
93
|
* Gets the data sort order of the box plot.
|
|
90
94
|
*
|
|
@@ -133,10 +133,38 @@ export abstract class ModelWithMultiAxes extends ChartModel {
|
|
|
133
133
|
*/
|
|
134
134
|
setAxisLabelsVisibility(isVisible: boolean, axisIndex?: number): void;
|
|
135
135
|
/**
|
|
136
|
-
* Sets the scrollbar configuration for the specified axis.
|
|
136
|
+
* Sets the scrollbar configuration for zooming and panning along the specified axis.
|
|
137
137
|
*
|
|
138
138
|
* @param scrollbar - The scrollbar configuration to set.
|
|
139
139
|
* @param axisIndex - Axis index for the chart: `0` for x-axis, `1` for primary y-axis, and `2` for secondary y-axis.
|
|
140
|
+
* @example
|
|
141
|
+
* ```ts
|
|
142
|
+
* // Sets the scrollbar for the x-axis
|
|
143
|
+
* chartModel.setAxisScrollbar(
|
|
144
|
+
* {
|
|
145
|
+
* visible: true,
|
|
146
|
+
* width: 20,
|
|
147
|
+
* color: [70, 174, 211, 255],
|
|
148
|
+
* gripSize: 32,
|
|
149
|
+
* margin: 8,
|
|
150
|
+
* },
|
|
151
|
+
* 0,
|
|
152
|
+
* );
|
|
153
|
+
*
|
|
154
|
+
* // Sets the scrollbar for the y-axis
|
|
155
|
+
* chartModel.setAxisScrollbar(
|
|
156
|
+
* {
|
|
157
|
+
* visible: true,
|
|
158
|
+
* width: 20,
|
|
159
|
+
* color: [158, 194, 49, 255],
|
|
160
|
+
* gripSize: 32,
|
|
161
|
+
* margin: 8,
|
|
162
|
+
* },
|
|
163
|
+
* 1,
|
|
164
|
+
* );
|
|
165
|
+
* ```
|
|
166
|
+
*
|
|
167
|
+
* <video src="https://developers.arcgis.com/javascript/latest/assets/references/components/chart/setAxisScrollbar.webm" aria-label="setAxisScrollbar" width="750" autoPlay loop muted playsInline/>
|
|
140
168
|
*/
|
|
141
169
|
setAxisScrollbar(scrollbar: WebChartAxisScrollBar, axisIndex: number): void;
|
|
142
170
|
/**
|
|
@@ -176,7 +204,11 @@ export abstract class ModelWithMultiAxes extends ChartModel {
|
|
|
176
204
|
setAxisVisibility(isVisible: boolean, axisIndex: number): void;
|
|
177
205
|
/**
|
|
178
206
|
* Sets the buffer for the specified axis.
|
|
179
|
-
* - This setting is only applicable to the axis of type `ValueAxis
|
|
207
|
+
* - This setting is only applicable to the axis of type `ValueAxis`
|
|
208
|
+
*
|
|
209
|
+
* | with `setBuffer` | without `setBuffer` |
|
|
210
|
+
* |-----------------|------------------|
|
|
211
|
+
* | 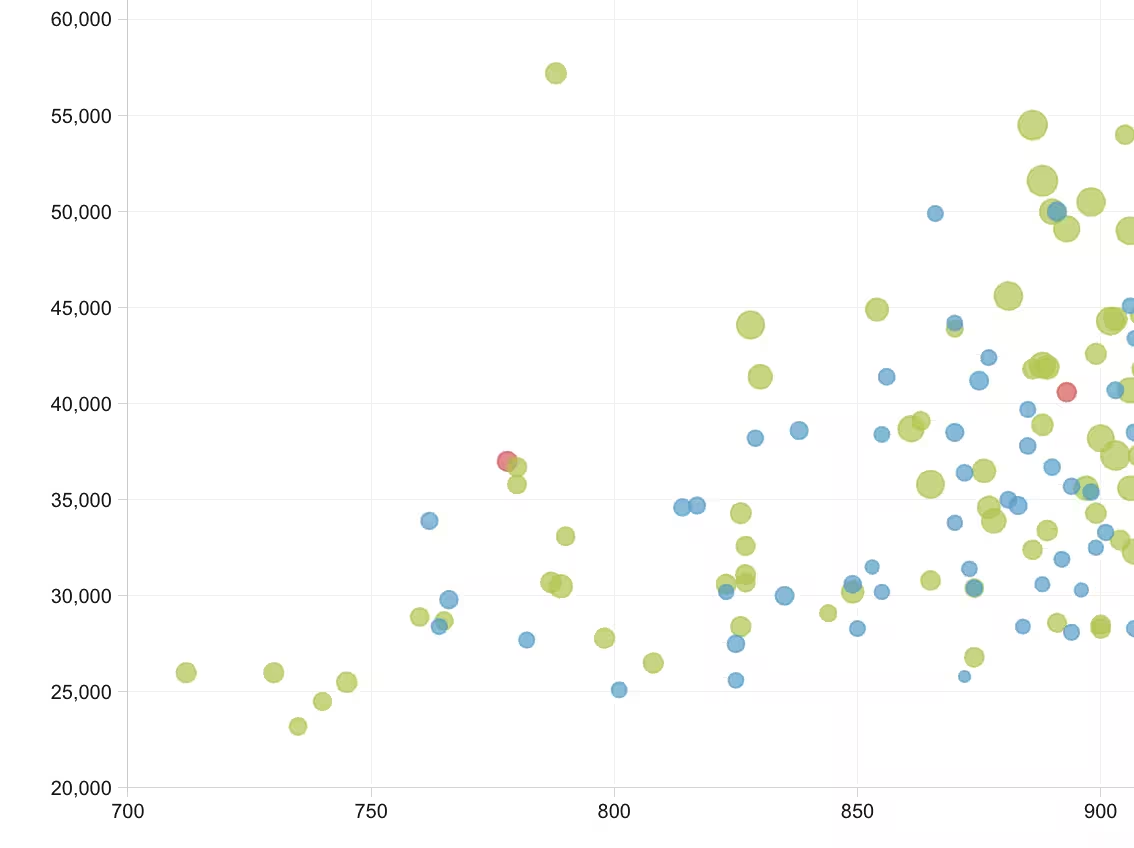 | 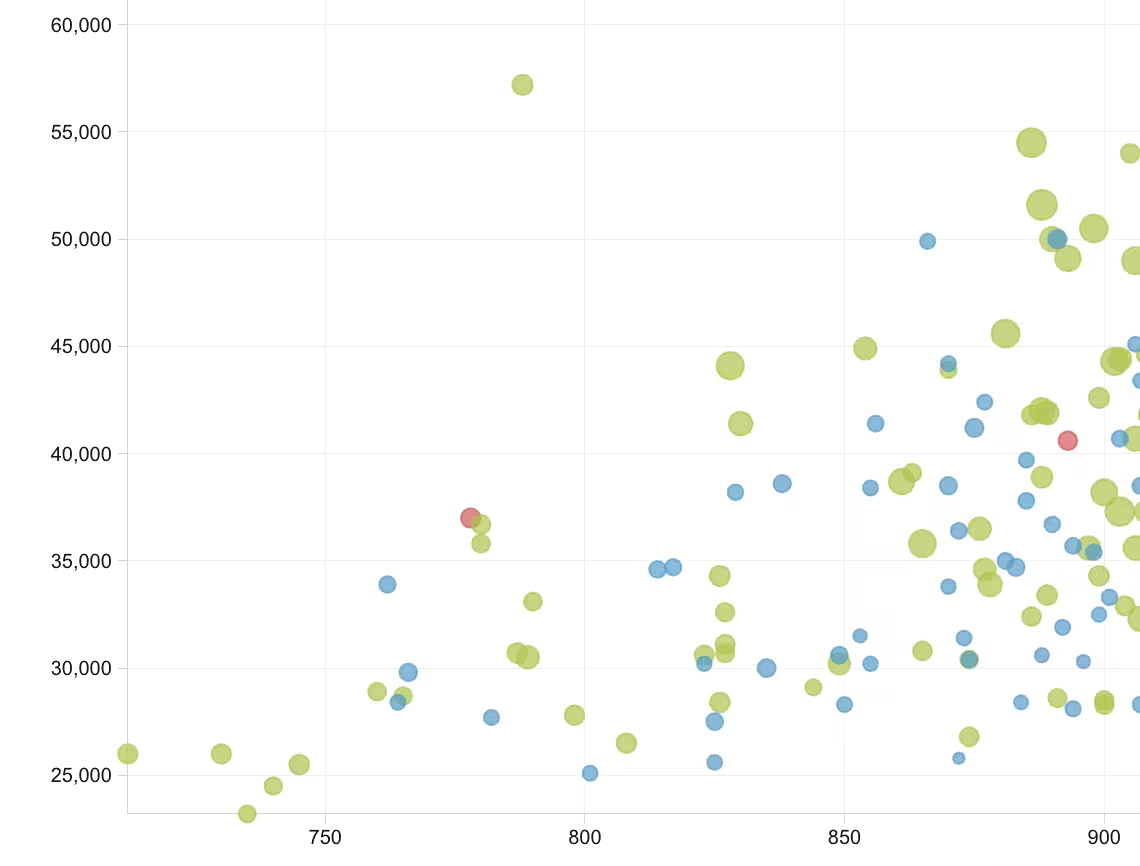 |
|
|
180
212
|
*
|
|
181
213
|
* @param buffer - The setting for the buffer.
|
|
182
214
|
* @param axisIndex - Axis index for the chart: `0` for x-axis, `1` for primary y-axis, and `2` for secondary y-axis. If omitted, all compatible value axes will be updated.
|
|
@@ -221,6 +253,11 @@ export abstract class ModelWithMultiAxes extends ChartModel {
|
|
|
221
253
|
setGridLinesSymbol(linesSymbol: ISimpleLineSymbol | undefined, axisIndices?: number[]): void;
|
|
222
254
|
/**
|
|
223
255
|
* Sets the horizontal axis labels behavior for the chart.
|
|
256
|
+
* - Default behavior is `rotate`, except for histogram where the default is `hide`.
|
|
257
|
+
*
|
|
258
|
+
* | `hide` | `rotate` | `stagger` | `wrap` |
|
|
259
|
+
* | --- | --- | --- | --- |
|
|
260
|
+
* |  |  |  |  |
|
|
224
261
|
*
|
|
225
262
|
* @param horizontalBehavior - The behavior for the horizontal axis labels.
|
|
226
263
|
*/
|
|
@@ -236,8 +273,18 @@ export abstract class ModelWithMultiAxes extends ChartModel {
|
|
|
236
273
|
/**
|
|
237
274
|
* Sets whether logarithmic scale is enabled for the specified axis.
|
|
238
275
|
*
|
|
276
|
+
* | X-axis (`axisIndex: 0`) | Primary y-axis (`axisIndex: 1`) | Both axes |
|
|
277
|
+
* | --- | --- | --- |
|
|
278
|
+
* | 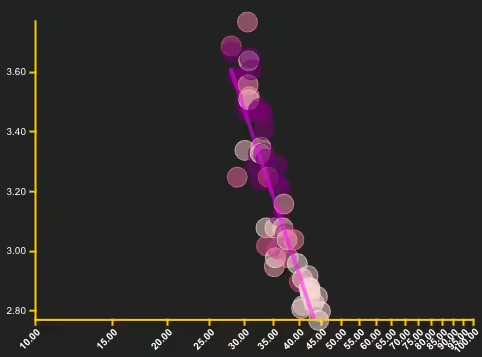 |  |  |
|
|
279
|
+
*
|
|
239
280
|
* @param isLogarithmic - Whether to enable logarithmic scale for the specified axis.
|
|
240
281
|
* @param axisIndex - Axis index for the chart: `0` for x-axis, `1` for primary y-axis, and `2` for secondary y-axis.
|
|
282
|
+
* @example
|
|
283
|
+
* ```ts
|
|
284
|
+
* // Apply a logarithmic scale to the x-axis (index 0) and primary y-axis (index 1)
|
|
285
|
+
* chartModel.setLogarithmic(true, 0);
|
|
286
|
+
* chartModel.setLogarithmic(true, 1);
|
|
287
|
+
* ```
|
|
241
288
|
*/
|
|
242
289
|
setLogarithmic(isLogarithmic: boolean, axisIndex: number): void;
|
|
243
290
|
/**
|
|
@@ -264,6 +311,10 @@ export abstract class ModelWithMultiAxes extends ChartModel {
|
|
|
264
311
|
/**
|
|
265
312
|
* Sets the vertical axis labels behavior for the chart.
|
|
266
313
|
*
|
|
314
|
+
* | `hide` | `wrap` |
|
|
315
|
+
* | --- | --- |
|
|
316
|
+
* |  |  |
|
|
317
|
+
*
|
|
267
318
|
* @param verticalBehavior - The behavior for the vertical axis labels.
|
|
268
319
|
*/
|
|
269
320
|
setVerticalAxisLabelsBehavior(verticalBehavior: WebChartLabelBehavior): void;
|
|
@@ -145,8 +145,12 @@ export class PieChartModel extends PieChartModelSuperclass {
|
|
|
145
145
|
accessor valueSuffix: string | undefined;
|
|
146
146
|
/** Generate the proper chart title given the current config. */
|
|
147
147
|
generateChartTitle(): string;
|
|
148
|
-
/**
|
|
149
|
-
|
|
148
|
+
/**
|
|
149
|
+
* Gets the list of the category values for the chart.
|
|
150
|
+
*
|
|
151
|
+
* @param num - The maximum number of category values to fetch.
|
|
152
|
+
*/
|
|
153
|
+
getCustomSortValues(num?: number): Promise<string[]>;
|
|
150
154
|
/**
|
|
151
155
|
* Gets the data sort order for the pie chart.
|
|
152
156
|
*
|
|
@@ -86,8 +86,12 @@ export abstract class SerialChartModel extends SerialChartModelSuperclass {
|
|
|
86
86
|
* @param seriesIndex - The index of the series.
|
|
87
87
|
*/
|
|
88
88
|
getAssignToSecondValueAxis(seriesIndex: number): boolean;
|
|
89
|
-
/**
|
|
90
|
-
|
|
89
|
+
/**
|
|
90
|
+
* Gets the list of the category values for the chart.
|
|
91
|
+
*
|
|
92
|
+
* @param num - The maximum number of category values to fetch.
|
|
93
|
+
*/
|
|
94
|
+
getCustomSortValues(num?: number): Promise<string[]>;
|
|
91
95
|
/**
|
|
92
96
|
* Gets the data sort order for the chart.
|
|
93
97
|
*
|
|
@@ -497,7 +497,6 @@ export interface IServiceInfo extends Record<string, unknown> {
|
|
|
497
497
|
* Individual View Source entry
|
|
498
498
|
*
|
|
499
499
|
* @deprecated since 5.1. Won't be replaced.
|
|
500
|
-
* @internal
|
|
501
500
|
*/
|
|
502
501
|
export interface IViewServiceSource {
|
|
503
502
|
name: string;
|
|
@@ -1712,10 +1711,7 @@ export interface ITypeInfoDomain {
|
|
|
1712
1711
|
type: string | "inherited";
|
|
1713
1712
|
}
|
|
1714
1713
|
|
|
1715
|
-
/**
|
|
1716
|
-
* @deprecated since 5.1. Won't be replaced.
|
|
1717
|
-
* @internal
|
|
1718
|
-
*/
|
|
1714
|
+
/** @deprecated since 5.1. Won't be replaced. */
|
|
1719
1715
|
export type FeatureEditTool = "esriFeatureEditToolAutoCompletePolygon" | "esriFeatureEditToolCircle" | "esriFeatureEditToolDownArrow" | "esriFeatureEditToolEllipse" | "esriFeatureEditToolFreehand" | "esriFeatureEditToolLeftArrow" | "esriFeatureEditToolLine" | "esriFeatureEditToolNone" | "esriFeatureEditToolPoint" | "esriFeatureEditToolPolygon" | "esriFeatureEditToolRectangle" | "esriFeatureEditToolRightArrow" | "esriFeatureEditToolText" | "esriFeatureEditToolTriangle" | "esriFeatureEditToolUpArrow";
|
|
1720
1716
|
|
|
1721
1717
|
/**
|
package/dist/types/lumina.d.ts
CHANGED
|
@@ -3,7 +3,7 @@ import type { ArcgisChart } from "../components/arcgis-chart/customElement.js";
|
|
|
3
3
|
import type { ArcgisChartsActionBar } from "../components/arcgis-charts-action-bar/customElement.js";
|
|
4
4
|
import type { h, EventHandler } from "@arcgis/lumina";
|
|
5
5
|
|
|
6
|
-
interface LuminaArcgisChart extends Partial<Pick<ArcgisChart, "actionMode" | "allowUsingObjectIdStat" | "animationEnabled" | "aria" | "autoDestroyDisabled" | "autoDisposeChart" | "autoInverseDataLabelTextColor" | "calciteThemingCSSVariables" | "chartIndex" | "chartLimits" | "chartWillRender" | "configurationEnabled" | "cursorRange" | "dataLabelFormatter" | "disableInteractions" | "disableTogglingLegendItems" | "enableBetaFeatures" | "enableConfiguration" | "enableResponsiveFeatures" | "errorPolicy" | "featureIndex" | "filterByExtent" | "filterBySelection" | "filterByViewExtent" | "gaugeInnerLabelFormatter" | "guideTooltipFormatter" | "hideEmptySeries" | "hideLicenseWatermark" | "hideLoaderAnimation" | "hideUIMessages" | "hideZeroCountCategories" | "ignoreSmoothRenderingLimit" | "ignoreViewExtent" | "interactionsDisabled" | "layer" | "layerFieldsChangePolicy" | "layerFilterChangePolicy" | "layerItemId" | "layerRendererChangePolicy" | "legendInteractionsDisabled" | "legendPosition" | "legendValueLabelFormatter" | "legendVisibility" | "loaderColors" | "mapLayerId" | "messageOverrides" | "model" | "nullAsValid" | "placeholder" | "popupTemplateFieldInfosEnabled" | "queueChartCreation" | "referenceElement" | "replaceNoValueCategoryWithZero" | "returnFeaturesExtent" | "returnSelectionIndexes" | "returnSelectionOIDs" | "rotated" | "rotation" | "runtimeDataFilters" | "secondaryYAxisLabelFormatter" | "selectionData" | "selectionManager" | "selectionTheme" | "setTimeBinningInfoWhenNotProvided" | "showEmptySeries" | "showLicenseWatermark" | "showUIMessages" | "skipChartCreationQueue" | "syncChartsSelection" | "syncSelection" | "syncSelectionsBetweenChartAndLayerViewPolicy" | "syncViewSelection" | "syncViewTimeExtent" | "syncViewTimeZone" | "syncViewTimeZoneInclusionList" | "timeZone" | "togglingLegendItemsDisabled" | "tooltipFormatter" | "truncateLongTitles" | "updateSplitBySeries" | "useAnimatedCharts" | "usePopupTemplateFieldsInfo" | "view" | "viewTimeExtentChangePolicy" | "xAxisLabelFormatter" | "yAxisLabelFormatter" | "zeroCountAsValid">>, h.JSX.HTMLAttributes<ArcgisChart> {
|
|
6
|
+
interface LuminaArcgisChart extends Partial<Pick<ArcgisChart, "actionMode" | "allowUsingObjectIdStat" | "animationEnabled" | "animationsEnabled" | "aria" | "autoDestroyDisabled" | "autoDisposeChart" | "autoInverseDataLabelTextColor" | "calciteThemingCSSVariables" | "chartIndex" | "chartLimits" | "chartWillRender" | "columnGapsEnabled" | "configurationEnabled" | "cursorRange" | "dataLabelFormatter" | "disableInteractions" | "disableTogglingLegendItems" | "enableBetaFeatures" | "enableConfiguration" | "enableResponsiveFeatures" | "errorPolicy" | "featureIndex" | "filterByExtent" | "filterBySelection" | "filterByViewExtent" | "gaugeInnerLabelFormatter" | "guideTooltipFormatter" | "hideEmptySeries" | "hideLicenseWatermark" | "hideLoaderAnimation" | "hideUIMessages" | "hideZeroCountCategories" | "ignoreSmoothRenderingLimit" | "ignoreViewExtent" | "interactionsDisabled" | "layer" | "layerFieldsChangePolicy" | "layerFilterChangePolicy" | "layerItemId" | "layerRendererChangePolicy" | "legendInteractionsDisabled" | "legendPosition" | "legendValueLabelFormatter" | "legendVisibility" | "loaderColors" | "mapLayerId" | "messageOverrides" | "model" | "nullAsValid" | "placeholder" | "popupTemplateFieldInfosEnabled" | "queueChartCreation" | "referenceElement" | "replaceNoValueCategoryWithZero" | "returnFeaturesExtent" | "returnSelectionIndexes" | "returnSelectionOIDs" | "rotated" | "rotation" | "runtimeDataFilters" | "secondaryYAxisLabelFormatter" | "selectionData" | "selectionManager" | "selectionTheme" | "setTimeBinningInfoWhenNotProvided" | "showEmptySeries" | "showLicenseWatermark" | "showUIMessages" | "skipChartCreationQueue" | "syncChartsSelection" | "syncSelection" | "syncSelectionsBetweenChartAndLayerViewPolicy" | "syncViewSelection" | "syncViewTimeExtent" | "syncViewTimeZone" | "syncViewTimeZoneInclusionList" | "timeZone" | "togglingLegendItemsDisabled" | "tooltipFormatter" | "truncateLongTitles" | "updateSplitBySeries" | "useAnimatedCharts" | "usePopupTemplateFieldsInfo" | "view" | "viewTimeExtentChangePolicy" | "xAxisLabelFormatter" | "yAxisLabelFormatter" | "zeroCountAsValid">>, h.JSX.HTMLAttributes<ArcgisChart> {
|
|
7
7
|
onarcgisAxesMinMaxChange?: EventHandler<ArcgisChart["arcgisAxesMinMaxChange"]>;
|
|
8
8
|
onarcgisBadDataWarningRaise?: EventHandler<ArcgisChart["arcgisBadDataWarningRaise"]>;
|
|
9
9
|
onarcgisChartNotFoundWarning?: EventHandler<ArcgisChart["arcgisChartNotFoundWarning"]>;
|
|
@@ -11,6 +11,7 @@ interface LuminaArcgisChart extends Partial<Pick<ArcgisChart, "actionMode" | "al
|
|
|
11
11
|
onarcgisDataFetchComplete?: EventHandler<ArcgisChart["arcgisDataFetchComplete"]>;
|
|
12
12
|
onarcgisDataProcessComplete?: EventHandler<ArcgisChart["arcgisDataProcessComplete"]>;
|
|
13
13
|
onarcgisDataProcessError?: EventHandler<ArcgisChart["arcgisDataProcessError"]>;
|
|
14
|
+
/** @deprecated since 5.1. Won't be replaced. */
|
|
14
15
|
onarcgisInvalidConfigWarningRaise?: EventHandler<ArcgisChart["arcgisInvalidConfigWarningRaise"]>;
|
|
15
16
|
onarcgisLegendItemVisibilityChange?: EventHandler<ArcgisChart["arcgisLegendItemVisibilityChange"]>;
|
|
16
17
|
onarcgisNoRenderPropChange?: EventHandler<ArcgisChart["arcgisNoRenderPropChange"]>;
|
|
@@ -19,6 +20,7 @@ interface LuminaArcgisChart extends Partial<Pick<ArcgisChart, "actionMode" | "al
|
|
|
19
20
|
onarcgisSelectionComplete?: EventHandler<ArcgisChart["arcgisSelectionComplete"]>;
|
|
20
21
|
onarcgisSeriesColorChange?: EventHandler<ArcgisChart["arcgisSeriesColorChange"]>;
|
|
21
22
|
onarcgisSeriesOrder?: EventHandler<ArcgisChart["arcgisSeriesOrder"]>;
|
|
23
|
+
/** @deprecated since 5.2. Use [@arcgisRenderingComplete](https://developers.arcgis.com/javascript/latest/references/charts-components/components/arcgis-chart/#event-arcgisRenderingComplete) instead. */
|
|
22
24
|
onarcgisUpdateComplete?: EventHandler<ArcgisChart["arcgisUpdateComplete"]>;
|
|
23
25
|
}
|
|
24
26
|
|
package/dist/types/preact.d.ts
CHANGED
|
@@ -4,7 +4,7 @@ import type { ArcgisChartsActionBar } from "../components/arcgis-charts-action-b
|
|
|
4
4
|
import { HTMLAttributes } from "preact";
|
|
5
5
|
import type { EventHandler } from "@arcgis/lumina";
|
|
6
6
|
|
|
7
|
-
interface PreactArcgisChart extends Partial<Pick<ArcgisChart, "actionMode" | "allowUsingObjectIdStat" | "animationEnabled" | "aria" | "autoDestroyDisabled" | "autoDisposeChart" | "autoInverseDataLabelTextColor" | "calciteThemingCSSVariables" | "chartIndex" | "chartLimits" | "chartWillRender" | "configurationEnabled" | "cursorRange" | "dataLabelFormatter" | "disableInteractions" | "disableTogglingLegendItems" | "enableBetaFeatures" | "enableConfiguration" | "enableResponsiveFeatures" | "errorPolicy" | "featureIndex" | "filterByExtent" | "filterBySelection" | "filterByViewExtent" | "gaugeInnerLabelFormatter" | "guideTooltipFormatter" | "hideEmptySeries" | "hideLicenseWatermark" | "hideLoaderAnimation" | "hideUIMessages" | "hideZeroCountCategories" | "ignoreSmoothRenderingLimit" | "ignoreViewExtent" | "interactionsDisabled" | "layer" | "layerFieldsChangePolicy" | "layerFilterChangePolicy" | "layerItemId" | "layerRendererChangePolicy" | "legendInteractionsDisabled" | "legendPosition" | "legendValueLabelFormatter" | "legendVisibility" | "loaderColors" | "mapLayerId" | "messageOverrides" | "model" | "nullAsValid" | "placeholder" | "popupTemplateFieldInfosEnabled" | "queueChartCreation" | "referenceElement" | "replaceNoValueCategoryWithZero" | "returnFeaturesExtent" | "returnSelectionIndexes" | "returnSelectionOIDs" | "rotated" | "rotation" | "runtimeDataFilters" | "secondaryYAxisLabelFormatter" | "selectionData" | "selectionManager" | "selectionTheme" | "setTimeBinningInfoWhenNotProvided" | "showEmptySeries" | "showLicenseWatermark" | "showUIMessages" | "skipChartCreationQueue" | "syncChartsSelection" | "syncSelection" | "syncSelectionsBetweenChartAndLayerViewPolicy" | "syncViewSelection" | "syncViewTimeExtent" | "syncViewTimeZone" | "syncViewTimeZoneInclusionList" | "timeZone" | "togglingLegendItemsDisabled" | "tooltipFormatter" | "truncateLongTitles" | "updateSplitBySeries" | "useAnimatedCharts" | "usePopupTemplateFieldsInfo" | "view" | "viewTimeExtentChangePolicy" | "xAxisLabelFormatter" | "yAxisLabelFormatter" | "zeroCountAsValid">>, HTMLAttributes<ArcgisChart> {
|
|
7
|
+
interface PreactArcgisChart extends Partial<Pick<ArcgisChart, "actionMode" | "allowUsingObjectIdStat" | "animationEnabled" | "animationsEnabled" | "aria" | "autoDestroyDisabled" | "autoDisposeChart" | "autoInverseDataLabelTextColor" | "calciteThemingCSSVariables" | "chartIndex" | "chartLimits" | "chartWillRender" | "columnGapsEnabled" | "configurationEnabled" | "cursorRange" | "dataLabelFormatter" | "disableInteractions" | "disableTogglingLegendItems" | "enableBetaFeatures" | "enableConfiguration" | "enableResponsiveFeatures" | "errorPolicy" | "featureIndex" | "filterByExtent" | "filterBySelection" | "filterByViewExtent" | "gaugeInnerLabelFormatter" | "guideTooltipFormatter" | "hideEmptySeries" | "hideLicenseWatermark" | "hideLoaderAnimation" | "hideUIMessages" | "hideZeroCountCategories" | "ignoreSmoothRenderingLimit" | "ignoreViewExtent" | "interactionsDisabled" | "layer" | "layerFieldsChangePolicy" | "layerFilterChangePolicy" | "layerItemId" | "layerRendererChangePolicy" | "legendInteractionsDisabled" | "legendPosition" | "legendValueLabelFormatter" | "legendVisibility" | "loaderColors" | "mapLayerId" | "messageOverrides" | "model" | "nullAsValid" | "placeholder" | "popupTemplateFieldInfosEnabled" | "queueChartCreation" | "referenceElement" | "replaceNoValueCategoryWithZero" | "returnFeaturesExtent" | "returnSelectionIndexes" | "returnSelectionOIDs" | "rotated" | "rotation" | "runtimeDataFilters" | "secondaryYAxisLabelFormatter" | "selectionData" | "selectionManager" | "selectionTheme" | "setTimeBinningInfoWhenNotProvided" | "showEmptySeries" | "showLicenseWatermark" | "showUIMessages" | "skipChartCreationQueue" | "syncChartsSelection" | "syncSelection" | "syncSelectionsBetweenChartAndLayerViewPolicy" | "syncViewSelection" | "syncViewTimeExtent" | "syncViewTimeZone" | "syncViewTimeZoneInclusionList" | "timeZone" | "togglingLegendItemsDisabled" | "tooltipFormatter" | "truncateLongTitles" | "updateSplitBySeries" | "useAnimatedCharts" | "usePopupTemplateFieldsInfo" | "view" | "viewTimeExtentChangePolicy" | "xAxisLabelFormatter" | "yAxisLabelFormatter" | "zeroCountAsValid">>, HTMLAttributes<ArcgisChart> {
|
|
8
8
|
onarcgisAxesMinMaxChange?: EventHandler<ArcgisChart["arcgisAxesMinMaxChange"]>;
|
|
9
9
|
onarcgisBadDataWarningRaise?: EventHandler<ArcgisChart["arcgisBadDataWarningRaise"]>;
|
|
10
10
|
onarcgisChartNotFoundWarning?: EventHandler<ArcgisChart["arcgisChartNotFoundWarning"]>;
|
|
@@ -12,6 +12,7 @@ interface PreactArcgisChart extends Partial<Pick<ArcgisChart, "actionMode" | "al
|
|
|
12
12
|
onarcgisDataFetchComplete?: EventHandler<ArcgisChart["arcgisDataFetchComplete"]>;
|
|
13
13
|
onarcgisDataProcessComplete?: EventHandler<ArcgisChart["arcgisDataProcessComplete"]>;
|
|
14
14
|
onarcgisDataProcessError?: EventHandler<ArcgisChart["arcgisDataProcessError"]>;
|
|
15
|
+
/** @deprecated since 5.1. Won't be replaced. */
|
|
15
16
|
onarcgisInvalidConfigWarningRaise?: EventHandler<ArcgisChart["arcgisInvalidConfigWarningRaise"]>;
|
|
16
17
|
onarcgisLegendItemVisibilityChange?: EventHandler<ArcgisChart["arcgisLegendItemVisibilityChange"]>;
|
|
17
18
|
onarcgisNoRenderPropChange?: EventHandler<ArcgisChart["arcgisNoRenderPropChange"]>;
|
|
@@ -20,6 +21,7 @@ interface PreactArcgisChart extends Partial<Pick<ArcgisChart, "actionMode" | "al
|
|
|
20
21
|
onarcgisSelectionComplete?: EventHandler<ArcgisChart["arcgisSelectionComplete"]>;
|
|
21
22
|
onarcgisSeriesColorChange?: EventHandler<ArcgisChart["arcgisSeriesColorChange"]>;
|
|
22
23
|
onarcgisSeriesOrder?: EventHandler<ArcgisChart["arcgisSeriesOrder"]>;
|
|
24
|
+
/** @deprecated since 5.2. Use [@arcgisRenderingComplete](https://developers.arcgis.com/javascript/latest/references/charts-components/components/arcgis-chart/#event-arcgisRenderingComplete) instead. */
|
|
23
25
|
onarcgisUpdateComplete?: EventHandler<ArcgisChart["arcgisUpdateComplete"]>;
|
|
24
26
|
}
|
|
25
27
|
|
package/dist/types/react.d.ts
CHANGED
|
@@ -4,7 +4,7 @@ import type { ArcgisChartsActionBar } from "../components/arcgis-charts-action-b
|
|
|
4
4
|
import type { HTMLProps } from 'react';
|
|
5
5
|
import type { EventHandler } from "@arcgis/lumina";
|
|
6
6
|
|
|
7
|
-
interface ReactArcgisChart extends Partial<Pick<ArcgisChart, "actionMode" | "allowUsingObjectIdStat" | "animationEnabled" | "aria" | "autoDestroyDisabled" | "autoDisposeChart" | "autoInverseDataLabelTextColor" | "calciteThemingCSSVariables" | "chartIndex" | "chartLimits" | "chartWillRender" | "configurationEnabled" | "cursorRange" | "dataLabelFormatter" | "disableInteractions" | "disableTogglingLegendItems" | "enableBetaFeatures" | "enableConfiguration" | "enableResponsiveFeatures" | "errorPolicy" | "featureIndex" | "filterByExtent" | "filterBySelection" | "filterByViewExtent" | "gaugeInnerLabelFormatter" | "guideTooltipFormatter" | "hideEmptySeries" | "hideLicenseWatermark" | "hideLoaderAnimation" | "hideUIMessages" | "hideZeroCountCategories" | "ignoreSmoothRenderingLimit" | "ignoreViewExtent" | "interactionsDisabled" | "layer" | "layerFieldsChangePolicy" | "layerFilterChangePolicy" | "layerItemId" | "layerRendererChangePolicy" | "legendInteractionsDisabled" | "legendPosition" | "legendValueLabelFormatter" | "legendVisibility" | "loaderColors" | "mapLayerId" | "messageOverrides" | "model" | "nullAsValid" | "placeholder" | "popupTemplateFieldInfosEnabled" | "queueChartCreation" | "referenceElement" | "replaceNoValueCategoryWithZero" | "returnFeaturesExtent" | "returnSelectionIndexes" | "returnSelectionOIDs" | "rotated" | "rotation" | "runtimeDataFilters" | "secondaryYAxisLabelFormatter" | "selectionData" | "selectionManager" | "selectionTheme" | "setTimeBinningInfoWhenNotProvided" | "showEmptySeries" | "showLicenseWatermark" | "showUIMessages" | "skipChartCreationQueue" | "syncChartsSelection" | "syncSelection" | "syncSelectionsBetweenChartAndLayerViewPolicy" | "syncViewSelection" | "syncViewTimeExtent" | "syncViewTimeZone" | "syncViewTimeZoneInclusionList" | "timeZone" | "togglingLegendItemsDisabled" | "tooltipFormatter" | "truncateLongTitles" | "updateSplitBySeries" | "useAnimatedCharts" | "usePopupTemplateFieldsInfo" | "view" | "viewTimeExtentChangePolicy" | "xAxisLabelFormatter" | "yAxisLabelFormatter" | "zeroCountAsValid">>, HTMLProps<ArcgisChart> {
|
|
7
|
+
interface ReactArcgisChart extends Partial<Pick<ArcgisChart, "actionMode" | "allowUsingObjectIdStat" | "animationEnabled" | "animationsEnabled" | "aria" | "autoDestroyDisabled" | "autoDisposeChart" | "autoInverseDataLabelTextColor" | "calciteThemingCSSVariables" | "chartIndex" | "chartLimits" | "chartWillRender" | "columnGapsEnabled" | "configurationEnabled" | "cursorRange" | "dataLabelFormatter" | "disableInteractions" | "disableTogglingLegendItems" | "enableBetaFeatures" | "enableConfiguration" | "enableResponsiveFeatures" | "errorPolicy" | "featureIndex" | "filterByExtent" | "filterBySelection" | "filterByViewExtent" | "gaugeInnerLabelFormatter" | "guideTooltipFormatter" | "hideEmptySeries" | "hideLicenseWatermark" | "hideLoaderAnimation" | "hideUIMessages" | "hideZeroCountCategories" | "ignoreSmoothRenderingLimit" | "ignoreViewExtent" | "interactionsDisabled" | "layer" | "layerFieldsChangePolicy" | "layerFilterChangePolicy" | "layerItemId" | "layerRendererChangePolicy" | "legendInteractionsDisabled" | "legendPosition" | "legendValueLabelFormatter" | "legendVisibility" | "loaderColors" | "mapLayerId" | "messageOverrides" | "model" | "nullAsValid" | "placeholder" | "popupTemplateFieldInfosEnabled" | "queueChartCreation" | "referenceElement" | "replaceNoValueCategoryWithZero" | "returnFeaturesExtent" | "returnSelectionIndexes" | "returnSelectionOIDs" | "rotated" | "rotation" | "runtimeDataFilters" | "secondaryYAxisLabelFormatter" | "selectionData" | "selectionManager" | "selectionTheme" | "setTimeBinningInfoWhenNotProvided" | "showEmptySeries" | "showLicenseWatermark" | "showUIMessages" | "skipChartCreationQueue" | "syncChartsSelection" | "syncSelection" | "syncSelectionsBetweenChartAndLayerViewPolicy" | "syncViewSelection" | "syncViewTimeExtent" | "syncViewTimeZone" | "syncViewTimeZoneInclusionList" | "timeZone" | "togglingLegendItemsDisabled" | "tooltipFormatter" | "truncateLongTitles" | "updateSplitBySeries" | "useAnimatedCharts" | "usePopupTemplateFieldsInfo" | "view" | "viewTimeExtentChangePolicy" | "xAxisLabelFormatter" | "yAxisLabelFormatter" | "zeroCountAsValid">>, HTMLProps<ArcgisChart> {
|
|
8
8
|
onarcgisAxesMinMaxChange?: EventHandler<ArcgisChart["arcgisAxesMinMaxChange"]>;
|
|
9
9
|
onarcgisBadDataWarningRaise?: EventHandler<ArcgisChart["arcgisBadDataWarningRaise"]>;
|
|
10
10
|
onarcgisChartNotFoundWarning?: EventHandler<ArcgisChart["arcgisChartNotFoundWarning"]>;
|
|
@@ -12,6 +12,7 @@ interface ReactArcgisChart extends Partial<Pick<ArcgisChart, "actionMode" | "all
|
|
|
12
12
|
onarcgisDataFetchComplete?: EventHandler<ArcgisChart["arcgisDataFetchComplete"]>;
|
|
13
13
|
onarcgisDataProcessComplete?: EventHandler<ArcgisChart["arcgisDataProcessComplete"]>;
|
|
14
14
|
onarcgisDataProcessError?: EventHandler<ArcgisChart["arcgisDataProcessError"]>;
|
|
15
|
+
/** @deprecated since 5.1. Won't be replaced. */
|
|
15
16
|
onarcgisInvalidConfigWarningRaise?: EventHandler<ArcgisChart["arcgisInvalidConfigWarningRaise"]>;
|
|
16
17
|
onarcgisLegendItemVisibilityChange?: EventHandler<ArcgisChart["arcgisLegendItemVisibilityChange"]>;
|
|
17
18
|
onarcgisNoRenderPropChange?: EventHandler<ArcgisChart["arcgisNoRenderPropChange"]>;
|
|
@@ -20,6 +21,7 @@ interface ReactArcgisChart extends Partial<Pick<ArcgisChart, "actionMode" | "all
|
|
|
20
21
|
onarcgisSelectionComplete?: EventHandler<ArcgisChart["arcgisSelectionComplete"]>;
|
|
21
22
|
onarcgisSeriesColorChange?: EventHandler<ArcgisChart["arcgisSeriesColorChange"]>;
|
|
22
23
|
onarcgisSeriesOrder?: EventHandler<ArcgisChart["arcgisSeriesOrder"]>;
|
|
24
|
+
/** @deprecated since 5.2. Use [@arcgisRenderingComplete](https://developers.arcgis.com/javascript/latest/references/charts-components/components/arcgis-chart/#event-arcgisRenderingComplete) instead. */
|
|
23
25
|
onarcgisUpdateComplete?: EventHandler<ArcgisChart["arcgisUpdateComplete"]>;
|
|
24
26
|
}
|
|
25
27
|
|
package/dist/types/stencil.d.ts
CHANGED
|
@@ -4,7 +4,7 @@ import type { ArcgisChartsActionBar } from "../components/arcgis-charts-action-b
|
|
|
4
4
|
import { JSXBase as StencilJsx } from "@stencil/core/internal";
|
|
5
5
|
import type { EventHandler } from "@arcgis/lumina";
|
|
6
6
|
|
|
7
|
-
interface StencilArcgisChart extends Partial<Pick<ArcgisChart, "actionMode" | "allowUsingObjectIdStat" | "animationEnabled" | "aria" | "autoDestroyDisabled" | "autoDisposeChart" | "autoInverseDataLabelTextColor" | "calciteThemingCSSVariables" | "chartIndex" | "chartLimits" | "chartWillRender" | "configurationEnabled" | "cursorRange" | "dataLabelFormatter" | "disableInteractions" | "disableTogglingLegendItems" | "enableBetaFeatures" | "enableConfiguration" | "enableResponsiveFeatures" | "errorPolicy" | "featureIndex" | "filterByExtent" | "filterBySelection" | "filterByViewExtent" | "gaugeInnerLabelFormatter" | "guideTooltipFormatter" | "hideEmptySeries" | "hideLicenseWatermark" | "hideLoaderAnimation" | "hideUIMessages" | "hideZeroCountCategories" | "ignoreSmoothRenderingLimit" | "ignoreViewExtent" | "interactionsDisabled" | "layer" | "layerFieldsChangePolicy" | "layerFilterChangePolicy" | "layerItemId" | "layerRendererChangePolicy" | "legendInteractionsDisabled" | "legendPosition" | "legendValueLabelFormatter" | "legendVisibility" | "loaderColors" | "mapLayerId" | "messageOverrides" | "model" | "nullAsValid" | "placeholder" | "popupTemplateFieldInfosEnabled" | "queueChartCreation" | "referenceElement" | "replaceNoValueCategoryWithZero" | "returnFeaturesExtent" | "returnSelectionIndexes" | "returnSelectionOIDs" | "rotated" | "rotation" | "runtimeDataFilters" | "secondaryYAxisLabelFormatter" | "selectionData" | "selectionManager" | "selectionTheme" | "setTimeBinningInfoWhenNotProvided" | "showEmptySeries" | "showLicenseWatermark" | "showUIMessages" | "skipChartCreationQueue" | "syncChartsSelection" | "syncSelection" | "syncSelectionsBetweenChartAndLayerViewPolicy" | "syncViewSelection" | "syncViewTimeExtent" | "syncViewTimeZone" | "syncViewTimeZoneInclusionList" | "timeZone" | "togglingLegendItemsDisabled" | "tooltipFormatter" | "truncateLongTitles" | "updateSplitBySeries" | "useAnimatedCharts" | "usePopupTemplateFieldsInfo" | "view" | "viewTimeExtentChangePolicy" | "xAxisLabelFormatter" | "yAxisLabelFormatter" | "zeroCountAsValid">>, StencilJsx.HTMLAttributes<ArcgisChart> {
|
|
7
|
+
interface StencilArcgisChart extends Partial<Pick<ArcgisChart, "actionMode" | "allowUsingObjectIdStat" | "animationEnabled" | "animationsEnabled" | "aria" | "autoDestroyDisabled" | "autoDisposeChart" | "autoInverseDataLabelTextColor" | "calciteThemingCSSVariables" | "chartIndex" | "chartLimits" | "chartWillRender" | "columnGapsEnabled" | "configurationEnabled" | "cursorRange" | "dataLabelFormatter" | "disableInteractions" | "disableTogglingLegendItems" | "enableBetaFeatures" | "enableConfiguration" | "enableResponsiveFeatures" | "errorPolicy" | "featureIndex" | "filterByExtent" | "filterBySelection" | "filterByViewExtent" | "gaugeInnerLabelFormatter" | "guideTooltipFormatter" | "hideEmptySeries" | "hideLicenseWatermark" | "hideLoaderAnimation" | "hideUIMessages" | "hideZeroCountCategories" | "ignoreSmoothRenderingLimit" | "ignoreViewExtent" | "interactionsDisabled" | "layer" | "layerFieldsChangePolicy" | "layerFilterChangePolicy" | "layerItemId" | "layerRendererChangePolicy" | "legendInteractionsDisabled" | "legendPosition" | "legendValueLabelFormatter" | "legendVisibility" | "loaderColors" | "mapLayerId" | "messageOverrides" | "model" | "nullAsValid" | "placeholder" | "popupTemplateFieldInfosEnabled" | "queueChartCreation" | "referenceElement" | "replaceNoValueCategoryWithZero" | "returnFeaturesExtent" | "returnSelectionIndexes" | "returnSelectionOIDs" | "rotated" | "rotation" | "runtimeDataFilters" | "secondaryYAxisLabelFormatter" | "selectionData" | "selectionManager" | "selectionTheme" | "setTimeBinningInfoWhenNotProvided" | "showEmptySeries" | "showLicenseWatermark" | "showUIMessages" | "skipChartCreationQueue" | "syncChartsSelection" | "syncSelection" | "syncSelectionsBetweenChartAndLayerViewPolicy" | "syncViewSelection" | "syncViewTimeExtent" | "syncViewTimeZone" | "syncViewTimeZoneInclusionList" | "timeZone" | "togglingLegendItemsDisabled" | "tooltipFormatter" | "truncateLongTitles" | "updateSplitBySeries" | "useAnimatedCharts" | "usePopupTemplateFieldsInfo" | "view" | "viewTimeExtentChangePolicy" | "xAxisLabelFormatter" | "yAxisLabelFormatter" | "zeroCountAsValid">>, StencilJsx.HTMLAttributes<ArcgisChart> {
|
|
8
8
|
onArcgisAxesMinMaxChange?: EventHandler<ArcgisChart["arcgisAxesMinMaxChange"]>;
|
|
9
9
|
onArcgisBadDataWarningRaise?: EventHandler<ArcgisChart["arcgisBadDataWarningRaise"]>;
|
|
10
10
|
onArcgisChartNotFoundWarning?: EventHandler<ArcgisChart["arcgisChartNotFoundWarning"]>;
|
|
@@ -12,6 +12,7 @@ interface StencilArcgisChart extends Partial<Pick<ArcgisChart, "actionMode" | "a
|
|
|
12
12
|
onArcgisDataFetchComplete?: EventHandler<ArcgisChart["arcgisDataFetchComplete"]>;
|
|
13
13
|
onArcgisDataProcessComplete?: EventHandler<ArcgisChart["arcgisDataProcessComplete"]>;
|
|
14
14
|
onArcgisDataProcessError?: EventHandler<ArcgisChart["arcgisDataProcessError"]>;
|
|
15
|
+
/** @deprecated since 5.1. Won't be replaced. */
|
|
15
16
|
onArcgisInvalidConfigWarningRaise?: EventHandler<ArcgisChart["arcgisInvalidConfigWarningRaise"]>;
|
|
16
17
|
onArcgisLegendItemVisibilityChange?: EventHandler<ArcgisChart["arcgisLegendItemVisibilityChange"]>;
|
|
17
18
|
onArcgisNoRenderPropChange?: EventHandler<ArcgisChart["arcgisNoRenderPropChange"]>;
|
|
@@ -20,6 +21,7 @@ interface StencilArcgisChart extends Partial<Pick<ArcgisChart, "actionMode" | "a
|
|
|
20
21
|
onArcgisSelectionComplete?: EventHandler<ArcgisChart["arcgisSelectionComplete"]>;
|
|
21
22
|
onArcgisSeriesColorChange?: EventHandler<ArcgisChart["arcgisSeriesColorChange"]>;
|
|
22
23
|
onArcgisSeriesOrder?: EventHandler<ArcgisChart["arcgisSeriesOrder"]>;
|
|
24
|
+
/** @deprecated since 5.2. Use [@arcgisRenderingComplete](https://developers.arcgis.com/javascript/latest/references/charts-components/components/arcgis-chart/#event-arcgisRenderingComplete) instead. */
|
|
23
25
|
onArcgisUpdateComplete?: EventHandler<ArcgisChart["arcgisUpdateComplete"]>;
|
|
24
26
|
}
|
|
25
27
|
|