youplot 0.3.1 → 0.3.2
This diff represents the content of publicly available package versions that have been released to one of the supported registries. The information contained in this diff is provided for informational purposes only and reflects changes between package versions as they appear in their respective public registries.
- checksums.yaml +4 -4
- data/README.md +117 -66
- data/lib/youplot/backends/unicode_plot_backend.rb +13 -7
- data/lib/youplot/command.rb +79 -67
- data/lib/youplot/command/cmd_options.rb +18 -0
- data/lib/youplot/command/parser.rb +44 -35
- data/lib/youplot/command/{params.rb → plot_params.rb} +1 -1
- data/lib/youplot/version.rb +1 -1
- metadata +4 -3
checksums.yaml
CHANGED
|
@@ -1,7 +1,7 @@
|
|
|
1
1
|
---
|
|
2
2
|
SHA256:
|
|
3
|
-
metadata.gz:
|
|
4
|
-
data.tar.gz:
|
|
3
|
+
metadata.gz: ff7e21952a560421314ae80fc894a8c1321d27ad985f50d2cdc53f8b3306a5ba
|
|
4
|
+
data.tar.gz: 5229cb0a38b73477ab91570dd0d04bf646c66d511fb6d5c8a12c09d64a08d1cf
|
|
5
5
|
SHA512:
|
|
6
|
-
metadata.gz:
|
|
7
|
-
data.tar.gz:
|
|
6
|
+
metadata.gz: d8d28d4118af6be5d7b115a3341e2bc066821718d0367286c2dbb2d49f364ac241af1d75f8c0466f91761e7a1c1ccdab4693010f41389c2703a25a3b9b83c8a2
|
|
7
|
+
data.tar.gz: ccc0b88ff329b9f002cb089f07ddfd9e3be8eed1a63a6c609df018efb1b25f3a92ff640ae22413e3271d051799cc009a090d8af1662b408282941e190da7f75b
|
data/README.md
CHANGED
|
@@ -1,11 +1,12 @@
|
|
|
1
|
-
|
|
1
|
+

|
|
2
2
|
|
|
3
3
|

|
|
4
4
|
[](https://badge.fury.io/rb/youplot)
|
|
5
5
|
[](https://rubydoc.info/gems/youplot)
|
|
6
6
|
[](LICENSE.txt)
|
|
7
|
+
[](https://zenodo.org/badge/latestdoi/283230219)
|
|
7
8
|
|
|
8
|
-
|
|
9
|
+
YouPlot is a command line tool for Unicode Plotting working with data from standard stream.
|
|
9
10
|
|
|
10
11
|
:bar_chart: Powered by [UnicodePlot](https://github.com/red-data-tools/unicode_plot.rb)
|
|
11
12
|
|
|
@@ -15,16 +16,22 @@ Create ASCII charts on the terminal with data from standard streams in the pipel
|
|
|
15
16
|
gem install youplot
|
|
16
17
|
```
|
|
17
18
|
|
|
18
|
-
##
|
|
19
|
+
## Quick Start
|
|
19
20
|
|
|
20
|
-
|
|
21
|
+
`cat data.tsv | uplot <command> [options]`
|
|
22
|
+
|
|
23
|
+
### barplot
|
|
21
24
|
|
|
22
25
|
```sh
|
|
23
|
-
|
|
24
|
-
|
|
26
|
+
curl -sL https://git.io/ISLANDScsv \
|
|
27
|
+
| sort -nk2 -t, \
|
|
28
|
+
| tail -n15 \
|
|
29
|
+
| uplot bar -d, -t "Areas of the World's Major Landmasses"
|
|
25
30
|
```
|
|
26
31
|
|
|
27
|
-
|
|
32
|
+

|
|
33
|
+
|
|
34
|
+
### histogram
|
|
28
35
|
|
|
29
36
|
```sh
|
|
30
37
|
echo -e "from numpy import random;" \
|
|
@@ -33,91 +40,119 @@ echo -e "from numpy import random;" \
|
|
|
33
40
|
| python \
|
|
34
41
|
| uplot hist --nbins 20
|
|
35
42
|
```
|
|
43
|
+

|
|
44
|
+
|
|
45
|
+
### lineplot
|
|
36
46
|
|
|
37
|
-
|
|
47
|
+
```sh
|
|
48
|
+
curl -sL https://git.io/AirPassengers \
|
|
49
|
+
| cut -f2,3 -d, \
|
|
50
|
+
| uplot line -d, -w 50 -h 15 -t AirPassengers --xlim 1950,1960 --ylim 0,600
|
|
51
|
+
```
|
|
38
52
|
|
|
39
|
-
|
|
53
|
+

|
|
54
|
+
|
|
55
|
+
### scatter
|
|
40
56
|
|
|
41
57
|
```sh
|
|
42
|
-
curl -
|
|
43
|
-
| cut -f1-4
|
|
44
|
-
| uplot scatter -H -
|
|
58
|
+
curl -sL https://git.io/IRIStsv \
|
|
59
|
+
| cut -f1-4 \
|
|
60
|
+
| uplot scatter -H -t IRIS
|
|
45
61
|
```
|
|
46
62
|
|
|
47
|
-
|
|
63
|
+

|
|
48
64
|
|
|
49
|
-
|
|
65
|
+
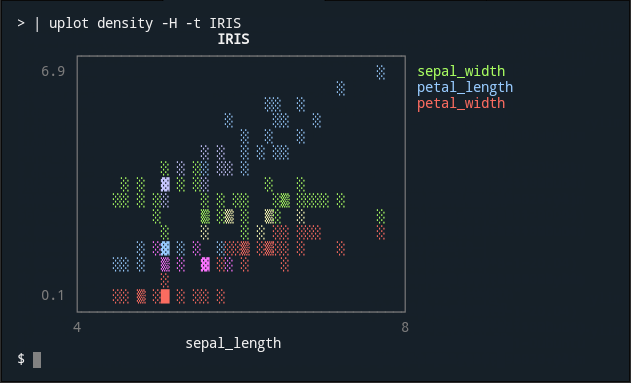
### density
|
|
50
66
|
|
|
51
67
|
```sh
|
|
52
|
-
curl -
|
|
53
|
-
| cut -
|
|
54
|
-
| uplot
|
|
68
|
+
curl -sL https://git.io/IRIStsv \
|
|
69
|
+
| cut -f1-4 \
|
|
70
|
+
| uplot density -H -t IRIS
|
|
55
71
|
```
|
|
56
72
|
|
|
57
|
-
|
|
73
|
+
|
|
58
74
|
|
|
59
|
-
|
|
75
|
+
### boxplot
|
|
60
76
|
|
|
61
77
|
```sh
|
|
62
|
-
curl -
|
|
63
|
-
| cut -f1-4
|
|
64
|
-
| uplot
|
|
78
|
+
curl -sL https://git.io/IRIStsv \
|
|
79
|
+
| cut -f1-4 \
|
|
80
|
+
| uplot boxplot -H -t IRIS
|
|
65
81
|
```
|
|
66
82
|
|
|
67
|
-
|
|
83
|
+

|
|
84
|
+
|
|
85
|
+
### count
|
|
68
86
|
|
|
69
|
-
|
|
87
|
+
In this example, YouPlot counts the number of chromosomes where the gene is located from the human gene annotation file and create a bar chart. The human gene annotation file can be downloaded from the following website.
|
|
88
|
+
|
|
89
|
+
* https://www.gencodegenes.org/human/
|
|
70
90
|
|
|
71
91
|
```sh
|
|
72
|
-
|
|
92
|
+
cat gencode.v35.annotation.gff3 \
|
|
93
|
+
| grep -v '#' | grep 'gene' | cut -f1 | \
|
|
94
|
+
uplot count -t "The number of human gene annotations per chromosome" -c blue
|
|
73
95
|
```
|
|
74
96
|
|
|
75
|
-
|
|
97
|
+

|
|
98
|
+
|
|
99
|
+
Note: `count` is not very fast because it runs in a Ruby script.
|
|
100
|
+
This is fine if the data is small, that is, in most cases. However, if you want to visualize huge data, it is faster to use a combination of common Unix commands as shown below.
|
|
101
|
+
|
|
102
|
+
```sh
|
|
103
|
+
cat gencode.v35.annotation.gff3 | grep -v '#' | grep 'gene' | cut -f1 \
|
|
104
|
+
|sort | uniq -c | sort -nrk2 | awk '{print $2,$1}' \
|
|
105
|
+
| uplot bar -d ' ' -t "The number of human gene annotations per chromosome" -c blue
|
|
106
|
+
```
|
|
76
107
|
|
|
77
108
|
## Usage
|
|
78
109
|
|
|
79
|
-
|
|
110
|
+
### Why YouPlot?
|
|
80
111
|
|
|
81
|
-
|
|
82
|
-
|
|
83
|
-
Version: 0.2.7 (using UnicodePlot 0.0.4)
|
|
84
|
-
Source: https://github.com/kojix2/youplot
|
|
112
|
+
Wouldn't it be a bit of pain to have to run R, Python, Julia, gnuplot or whatever REPL just to check your data?
|
|
113
|
+
YouPlot is a command line tool for this purpose. With YouPlot, you can continue working without leaving your terminal and shell.
|
|
85
114
|
|
|
86
|
-
|
|
115
|
+
### how to use YouPlot?
|
|
87
116
|
|
|
88
|
-
|
|
89
|
-
barplot bar
|
|
90
|
-
histogram hist
|
|
91
|
-
lineplot line
|
|
92
|
-
lineplots lines
|
|
93
|
-
scatter s
|
|
94
|
-
density d
|
|
95
|
-
boxplot box
|
|
96
|
-
colors show the list of available colors
|
|
117
|
+
`uplot` is the shortened form of `youplot`. You can use either.
|
|
97
118
|
|
|
98
|
-
|
|
99
|
-
|
|
119
|
+
| | |
|
|
120
|
+
|-----------------------------------|------------------------------------------------|
|
|
121
|
+
| Reads data from standard input | `cat data.tsv \| uplot <command> [options]` |
|
|
122
|
+
| Reads data from files | `uplot <command> [options] data.tsv ...` |
|
|
123
|
+
| Outputs data from stdin to stdout | `pipeline1 \| uplot <command> -O \| pipeline2` |
|
|
100
124
|
|
|
101
|
-
|
|
102
|
-
|
|
103
|
-
|
|
104
|
-
|
|
105
|
-
|
|
106
|
-
|
|
107
|
-
|
|
108
|
-
|
|
109
|
-
|
|
110
|
-
|
|
111
|
-
|
|
112
|
-
|
|
113
|
-
|
|
114
|
-
|
|
115
|
-
|
|
116
|
-
|
|
117
|
-
|
|
118
|
-
|
|
119
|
-
|
|
120
|
-
|
|
125
|
+
### Where to output the plot?
|
|
126
|
+
|
|
127
|
+
By default, the plot is output to *standard error output*.
|
|
128
|
+
The output file or stream for the plot can be specified with the `-o` option.
|
|
129
|
+
|
|
130
|
+
### Where to output the input data?
|
|
131
|
+
|
|
132
|
+
By default, the input data is not output anywhere.
|
|
133
|
+
The `-O` option, with no arguments, outputs the input data directly to the standard output. This is useful when passing data to a subsequent pipeline.
|
|
134
|
+
|
|
135
|
+
### What types of plots are available?
|
|
136
|
+
|
|
137
|
+
The following sub-commands are available
|
|
138
|
+
|
|
139
|
+
| command | short | how it works |
|
|
140
|
+
|-----------|-------|----------------------------------------|
|
|
141
|
+
| barplot | bar | draw a horizontal barplot |
|
|
142
|
+
| histogram | hist | draw a horizontal histogram |
|
|
143
|
+
| lineplot | line | draw a line chart |
|
|
144
|
+
| lineplots | lines | draw a line chart with multiple series |
|
|
145
|
+
| scatter | s | draw a scatter plot |
|
|
146
|
+
| density | d | draw a density plot |
|
|
147
|
+
| boxplot | box | draw a horizontal boxplot |
|
|
148
|
+
|
|
149
|
+
See Quick Start for `count`.
|
|
150
|
+
|
|
151
|
+
| command | short | how it works |
|
|
152
|
+
|-----------|-------|----------------------------------------------------------|
|
|
153
|
+
| count | c | draw a baplot based on the number of occurrences (slow) |
|
|
154
|
+
|
|
155
|
+
### How to view detailed command line options
|
|
121
156
|
|
|
122
157
|
Use `--help` to print command-specific options.
|
|
123
158
|
|
|
@@ -135,13 +170,29 @@ Options:
|
|
|
135
170
|
...
|
|
136
171
|
```
|
|
137
172
|
|
|
138
|
-
|
|
173
|
+
### How to view the list of available colors?
|
|
139
174
|
|
|
140
|
-
|
|
175
|
+
```sh
|
|
176
|
+
uplot colors
|
|
177
|
+
```
|
|
141
178
|
|
|
142
179
|
## Contributing
|
|
143
180
|
|
|
144
|
-
|
|
181
|
+
* [Report bugs](https://github.com/kojix2/youplot/issues)
|
|
182
|
+
* Fix bugs and [submit pull requests](https://github.com/kojix2/youplot/pulls)
|
|
183
|
+
* Write, clarify, or fix documentation
|
|
184
|
+
* Suggest or add new features
|
|
185
|
+
|
|
186
|
+
|
|
187
|
+
### Development
|
|
188
|
+
|
|
189
|
+
```sh
|
|
190
|
+
git clone https://github.com/your_name/GR.rb # Clone the Git repo
|
|
191
|
+
cd GR.rb
|
|
192
|
+
bundle install # Install the gem dependencies
|
|
193
|
+
bundle exec rake test # Run the test
|
|
194
|
+
bundle exec rake install # Installation from source code
|
|
195
|
+
```
|
|
145
196
|
|
|
146
197
|
## License
|
|
147
198
|
|
|
@@ -152,17 +152,23 @@ module YouPlot
|
|
|
152
152
|
end
|
|
153
153
|
|
|
154
154
|
def colors(color_names = false)
|
|
155
|
+
# FIXME
|
|
156
|
+
s = String.new
|
|
155
157
|
UnicodePlot::StyledPrinter::TEXT_COLORS.each do |k, v|
|
|
156
|
-
|
|
157
|
-
|
|
158
|
+
s << v
|
|
159
|
+
s << k.to_s
|
|
158
160
|
unless color_names
|
|
159
|
-
|
|
160
|
-
|
|
161
|
+
s << "\t"
|
|
162
|
+
s << ' ●'
|
|
161
163
|
end
|
|
162
|
-
|
|
163
|
-
|
|
164
|
+
s << "\033[0m"
|
|
165
|
+
s << "\t"
|
|
164
166
|
end
|
|
165
|
-
|
|
167
|
+
s << "\n"
|
|
168
|
+
def s.render(obj)
|
|
169
|
+
obj.print(self)
|
|
170
|
+
end
|
|
171
|
+
s
|
|
166
172
|
end
|
|
167
173
|
|
|
168
174
|
def check_series_size(data, fmt)
|
data/lib/youplot/command.rb
CHANGED
|
@@ -10,88 +10,100 @@ module YouPlot
|
|
|
10
10
|
Data = Struct.new(:headers, :series)
|
|
11
11
|
|
|
12
12
|
class Command
|
|
13
|
-
attr_accessor :params
|
|
14
|
-
attr_reader :data, :
|
|
13
|
+
attr_accessor :command, :params, :options
|
|
14
|
+
attr_reader :data, :parser
|
|
15
15
|
|
|
16
16
|
def initialize(argv = ARGV)
|
|
17
17
|
@argv = argv
|
|
18
|
-
@params = Params.new
|
|
19
18
|
@parser = Parser.new
|
|
19
|
+
@command = nil
|
|
20
|
+
@params = nil
|
|
21
|
+
@options = nil
|
|
20
22
|
@backend = YouPlot::Backends::UnicodePlotBackend
|
|
21
23
|
end
|
|
22
24
|
|
|
23
25
|
def run
|
|
24
26
|
parser.parse_options(@argv)
|
|
25
|
-
command
|
|
26
|
-
|
|
27
|
-
|
|
28
|
-
transpose = parser.transpose
|
|
29
|
-
headers = parser.headers
|
|
30
|
-
pass = parser.pass
|
|
31
|
-
output = parser.output
|
|
32
|
-
fmt = parser.fmt
|
|
33
|
-
@encoding = parser.encoding
|
|
34
|
-
@debug = parser.debug
|
|
35
|
-
|
|
36
|
-
if command == :colors
|
|
37
|
-
@backend.colors(parser.color_names)
|
|
38
|
-
exit
|
|
39
|
-
end
|
|
27
|
+
@command ||= parser.command
|
|
28
|
+
@options ||= parser.options
|
|
29
|
+
@params ||= parser.params
|
|
40
30
|
|
|
41
|
-
|
|
42
|
-
|
|
43
|
-
|
|
44
|
-
|
|
45
|
-
|
|
46
|
-
|
|
47
|
-
|
|
48
|
-
else
|
|
49
|
-
if pass
|
|
50
|
-
File.open(pass, 'w') do |f|
|
|
51
|
-
f.print(input)
|
|
52
|
-
end
|
|
53
|
-
end
|
|
31
|
+
if %i[colors color colours colour].include? @command
|
|
32
|
+
plot = create_plot
|
|
33
|
+
output_plot(plot)
|
|
34
|
+
else
|
|
35
|
+
# Sometimes the input file does not end with a newline code.
|
|
36
|
+
while (input = Kernel.gets(nil))
|
|
37
|
+
main(input)
|
|
54
38
|
end
|
|
39
|
+
end
|
|
40
|
+
end
|
|
41
|
+
|
|
42
|
+
private
|
|
43
|
+
|
|
44
|
+
def main(input)
|
|
45
|
+
output_data(input)
|
|
46
|
+
|
|
47
|
+
@data = read_dsv(input)
|
|
48
|
+
|
|
49
|
+
pp @data if options[:debug]
|
|
50
|
+
|
|
51
|
+
plot = create_plot
|
|
52
|
+
output_plot(plot)
|
|
53
|
+
end
|
|
54
|
+
|
|
55
|
+
def read_dsv(input)
|
|
56
|
+
input = input.dup.force_encoding(options[:encoding]).encode('utf-8') if options[:encoding]
|
|
57
|
+
DSVReader.input(input, options[:delimiter], options[:headers], options[:transpose])
|
|
58
|
+
end
|
|
55
59
|
|
|
56
|
-
|
|
57
|
-
|
|
58
|
-
|
|
59
|
-
|
|
60
|
-
|
|
61
|
-
|
|
62
|
-
|
|
63
|
-
|
|
64
|
-
|
|
65
|
-
|
|
66
|
-
|
|
67
|
-
|
|
68
|
-
|
|
69
|
-
|
|
70
|
-
|
|
71
|
-
|
|
72
|
-
|
|
73
|
-
|
|
74
|
-
|
|
75
|
-
|
|
76
|
-
|
|
77
|
-
|
|
78
|
-
|
|
79
|
-
|
|
80
|
-
|
|
81
|
-
|
|
82
|
-
|
|
83
|
-
|
|
84
|
-
|
|
85
|
-
|
|
86
|
-
|
|
87
|
-
|
|
88
|
-
|
|
89
|
-
|
|
90
|
-
File.open(output, 'w') do |f|
|
|
91
|
-
plot.render(f)
|
|
60
|
+
def create_plot
|
|
61
|
+
case command
|
|
62
|
+
when :bar, :barplot
|
|
63
|
+
@backend.barplot(data, params, options[:fmt])
|
|
64
|
+
when :count, :c
|
|
65
|
+
@backend.barplot(data, params, count: true)
|
|
66
|
+
when :hist, :histogram
|
|
67
|
+
@backend.histogram(data, params)
|
|
68
|
+
when :line, :lineplot
|
|
69
|
+
@backend.line(data, params, options[:fmt])
|
|
70
|
+
when :lines, :lineplots
|
|
71
|
+
@backend.lines(data, params, options[:fmt])
|
|
72
|
+
when :scatter, :s
|
|
73
|
+
@backend.scatter(data, params, options[:fmt])
|
|
74
|
+
when :density, :d
|
|
75
|
+
@backend.density(data, params, options[:fmt])
|
|
76
|
+
when :box, :boxplot
|
|
77
|
+
@backend.boxplot(data, params)
|
|
78
|
+
when :colors, :color, :colours, :colour
|
|
79
|
+
@backend.colors(options[:color_names])
|
|
80
|
+
else
|
|
81
|
+
raise "unrecognized plot_type: #{command}"
|
|
82
|
+
end
|
|
83
|
+
end
|
|
84
|
+
|
|
85
|
+
def output_data(input)
|
|
86
|
+
# Pass the input to subsequent pipelines
|
|
87
|
+
case options[:pass]
|
|
88
|
+
when IO
|
|
89
|
+
options[:pass].print(input)
|
|
90
|
+
else
|
|
91
|
+
if options[:pass]
|
|
92
|
+
File.open(options[:pass], 'w') do |f|
|
|
93
|
+
f.print(input)
|
|
92
94
|
end
|
|
93
95
|
end
|
|
96
|
+
end
|
|
97
|
+
end
|
|
94
98
|
|
|
99
|
+
def output_plot(plot)
|
|
100
|
+
case options[:output]
|
|
101
|
+
when IO
|
|
102
|
+
plot.render(options[:output])
|
|
103
|
+
else
|
|
104
|
+
File.open(options[:output], 'w') do |f|
|
|
105
|
+
plot.render(f)
|
|
106
|
+
end
|
|
95
107
|
end
|
|
96
108
|
end
|
|
97
109
|
end
|
|
@@ -1,28 +1,30 @@
|
|
|
1
1
|
# frozen_string_literal: true
|
|
2
2
|
|
|
3
3
|
require 'optparse'
|
|
4
|
-
require_relative '
|
|
4
|
+
require_relative 'cmd_options'
|
|
5
|
+
require_relative 'plot_params'
|
|
5
6
|
|
|
6
7
|
module YouPlot
|
|
7
8
|
class Command
|
|
8
9
|
class Parser
|
|
9
|
-
attr_reader :command, :params
|
|
10
|
-
:delimiter, :transpose, :headers, :pass, :output, :fmt,
|
|
11
|
-
:color_names, :encoding, :debug
|
|
10
|
+
attr_reader :command, :options, :params
|
|
12
11
|
|
|
13
12
|
def initialize
|
|
14
|
-
@command
|
|
15
|
-
@params = Params.new
|
|
13
|
+
@command = nil
|
|
16
14
|
|
|
17
|
-
@
|
|
18
|
-
|
|
19
|
-
|
|
20
|
-
|
|
21
|
-
|
|
22
|
-
|
|
23
|
-
|
|
24
|
-
|
|
25
|
-
|
|
15
|
+
@options = CmdOptions.new(
|
|
16
|
+
delimiter: "\t",
|
|
17
|
+
transpose: false,
|
|
18
|
+
headers: nil,
|
|
19
|
+
pass: false,
|
|
20
|
+
output: $stderr,
|
|
21
|
+
fmt: 'xyy',
|
|
22
|
+
encoding: nil,
|
|
23
|
+
color_names: false,
|
|
24
|
+
debug: false
|
|
25
|
+
)
|
|
26
|
+
|
|
27
|
+
@params = PlotParams.new
|
|
26
28
|
end
|
|
27
29
|
|
|
28
30
|
def create_default_parser
|
|
@@ -33,21 +35,22 @@ module YouPlot
|
|
|
33
35
|
opt.on_tail('') # Add a blank line at the end
|
|
34
36
|
opt.separator('')
|
|
35
37
|
opt.on('Common options:')
|
|
36
|
-
opt.on('-O', '--pass [
|
|
38
|
+
opt.on('-O', '--pass [FILE]', 'file to output input data to [stdout]',
|
|
37
39
|
'for inserting YouPlot in the middle of Unix pipes') do |v|
|
|
38
|
-
@pass = v || $stdout
|
|
40
|
+
@options[:pass] = v || $stdout
|
|
39
41
|
end
|
|
40
|
-
opt.on('-o', '--output
|
|
41
|
-
|
|
42
|
+
opt.on('-o', '--output [FILE]', 'file to output plots to [stdout]',
|
|
43
|
+
'If no option is specified, plot will print to stderr') do |v|
|
|
44
|
+
@options[:output] = v || $stdout
|
|
42
45
|
end
|
|
43
46
|
opt.on('-d', '--delimiter VAL', String, 'use DELIM instead of TAB for field delimiter') do |v|
|
|
44
|
-
@delimiter = v
|
|
47
|
+
@options[:delimiter] = v
|
|
45
48
|
end
|
|
46
49
|
opt.on('-H', '--headers', TrueClass, 'specify that the input has header row') do |v|
|
|
47
|
-
@headers = v
|
|
50
|
+
@options[:headers] = v
|
|
48
51
|
end
|
|
49
52
|
opt.on('-T', '--transpose', TrueClass, 'transpose the axes of the input data') do |v|
|
|
50
|
-
@transpose = v
|
|
53
|
+
@options[:transpose] = v
|
|
51
54
|
end
|
|
52
55
|
opt.on('-t', '--title VAL', String, 'print string on the top of plot') do |v|
|
|
53
56
|
params.title = v
|
|
@@ -79,8 +82,11 @@ module YouPlot
|
|
|
79
82
|
opt.on('--[no-]labels', TrueClass, 'hide the labels') do |v|
|
|
80
83
|
params.labels = v
|
|
81
84
|
end
|
|
85
|
+
opt.on('--progress', TrueClass, 'progressive') do |v|
|
|
86
|
+
@options[:progressive] = v
|
|
87
|
+
end
|
|
82
88
|
opt.on('--encoding VAL', String, 'Specify the input encoding') do |v|
|
|
83
|
-
@encoding = v
|
|
89
|
+
@options[:encoding] = v
|
|
84
90
|
end
|
|
85
91
|
# Optparse adds the help option, but it doesn't show up in usage.
|
|
86
92
|
# This is why you need the code below.
|
|
@@ -89,7 +95,7 @@ module YouPlot
|
|
|
89
95
|
exit
|
|
90
96
|
end
|
|
91
97
|
opt.on('--debug', TrueClass, 'print preprocessed data') do |v|
|
|
92
|
-
@debug = v
|
|
98
|
+
@options[:debug] = v
|
|
93
99
|
end
|
|
94
100
|
yield opt if block_given?
|
|
95
101
|
end
|
|
@@ -117,7 +123,7 @@ module YouPlot
|
|
|
117
123
|
scatter s draw a scatter plot
|
|
118
124
|
density d draw a density plot
|
|
119
125
|
boxplot box draw a horizontal boxplot
|
|
120
|
-
colors
|
|
126
|
+
colors color show the list of available colors
|
|
121
127
|
|
|
122
128
|
count c draw a baplot based on the number of
|
|
123
129
|
occurrences (slow)
|
|
@@ -163,7 +169,7 @@ module YouPlot
|
|
|
163
169
|
params.xscale = v
|
|
164
170
|
end
|
|
165
171
|
parser.on_head('--fmt VAL', String, 'xy : header is like x, y...', 'yx : header is like y, x...') do |v|
|
|
166
|
-
@fmt = v
|
|
172
|
+
@options[:fmt] = v
|
|
167
173
|
end
|
|
168
174
|
|
|
169
175
|
when :count, :c
|
|
@@ -193,7 +199,7 @@ module YouPlot
|
|
|
193
199
|
params.ylim = v.take(2)
|
|
194
200
|
end
|
|
195
201
|
parser.on_head('--fmt VAL', String, 'xy : header is like x, y...', 'yx : header is like y, x...') do |v|
|
|
196
|
-
@fmt = v
|
|
202
|
+
@options[:fmt] = v
|
|
197
203
|
end
|
|
198
204
|
|
|
199
205
|
when :lineplots, :lines
|
|
@@ -206,8 +212,9 @@ module YouPlot
|
|
|
206
212
|
parser.on_head('--ylim VAL', Array, 'plotting range for the y coordinate') do |v|
|
|
207
213
|
params.ylim = v.take(2)
|
|
208
214
|
end
|
|
209
|
-
parser.on_head('--fmt VAL', String, 'xyxy : header is like x1, y1, x2, y2, x3, y3...',
|
|
210
|
-
|
|
215
|
+
parser.on_head('--fmt VAL', String, 'xyxy : header is like x1, y1, x2, y2, x3, y3...',
|
|
216
|
+
'xyy : header is like x, y1, y2, y2, y3...') do |v|
|
|
217
|
+
@options[:fmt] = v
|
|
211
218
|
end
|
|
212
219
|
|
|
213
220
|
when :scatter, :s
|
|
@@ -220,8 +227,9 @@ module YouPlot
|
|
|
220
227
|
parser.on_head('--ylim VAL', Array, 'plotting range for the y coordinate') do |v|
|
|
221
228
|
params.ylim = v.take(2)
|
|
222
229
|
end
|
|
223
|
-
parser.on_head('--fmt VAL', String, 'xyxy : header is like x1, y1, x2, y2, x3, y3...',
|
|
224
|
-
|
|
230
|
+
parser.on_head('--fmt VAL', String, 'xyxy : header is like x1, y1, x2, y2, x3, y3...',
|
|
231
|
+
'xyy : header is like x, y1, y2, y2, y3...') do |v|
|
|
232
|
+
@options[:fmt] = v
|
|
225
233
|
end
|
|
226
234
|
|
|
227
235
|
when :density, :d
|
|
@@ -234,8 +242,9 @@ module YouPlot
|
|
|
234
242
|
parser.on_head('--ylim VAL', Array, 'plotting range for the y coordinate') do |v|
|
|
235
243
|
params.ylim = v.take(2)
|
|
236
244
|
end
|
|
237
|
-
parser.on('--fmt VAL', String, 'xyxy : header is like x1, y1, x2, y2, x3, y3...',
|
|
238
|
-
|
|
245
|
+
parser.on('--fmt VAL', String, 'xyxy : header is like x1, y1, x2, y2, x3, y3...',
|
|
246
|
+
'xyy : header is like x, y1, y2, y2, y3...') do |v|
|
|
247
|
+
@options[:fmt] = v
|
|
239
248
|
end
|
|
240
249
|
|
|
241
250
|
when :boxplot, :box
|
|
@@ -243,9 +252,9 @@ module YouPlot
|
|
|
243
252
|
params.xlim = v.take(2)
|
|
244
253
|
end
|
|
245
254
|
|
|
246
|
-
when :colors
|
|
255
|
+
when :colors, :color, :colours, :colour
|
|
247
256
|
parser.on_head('-n', '--names', 'show color names only', TrueClass) do |v|
|
|
248
|
-
@color_names = v
|
|
257
|
+
@options[:color_names] = v
|
|
249
258
|
end
|
|
250
259
|
|
|
251
260
|
else
|
data/lib/youplot/version.rb
CHANGED
metadata
CHANGED
|
@@ -1,14 +1,14 @@
|
|
|
1
1
|
--- !ruby/object:Gem::Specification
|
|
2
2
|
name: youplot
|
|
3
3
|
version: !ruby/object:Gem::Version
|
|
4
|
-
version: 0.3.
|
|
4
|
+
version: 0.3.2
|
|
5
5
|
platform: ruby
|
|
6
6
|
authors:
|
|
7
7
|
- kojix2
|
|
8
8
|
autorequire:
|
|
9
9
|
bindir: exe
|
|
10
10
|
cert_chain: []
|
|
11
|
-
date: 2020-12-
|
|
11
|
+
date: 2020-12-17 00:00:00.000000000 Z
|
|
12
12
|
dependencies:
|
|
13
13
|
- !ruby/object:Gem::Dependency
|
|
14
14
|
name: unicode_plot
|
|
@@ -112,8 +112,9 @@ files:
|
|
|
112
112
|
- lib/youplot/backends/processing.rb
|
|
113
113
|
- lib/youplot/backends/unicode_plot_backend.rb
|
|
114
114
|
- lib/youplot/command.rb
|
|
115
|
-
- lib/youplot/command/
|
|
115
|
+
- lib/youplot/command/cmd_options.rb
|
|
116
116
|
- lib/youplot/command/parser.rb
|
|
117
|
+
- lib/youplot/command/plot_params.rb
|
|
117
118
|
- lib/youplot/dsv_reader.rb
|
|
118
119
|
- lib/youplot/version.rb
|
|
119
120
|
homepage: https://github.com/kojix2/youplot
|