vm-client 1.0.0
This diff represents the content of publicly available package versions that have been released to one of the supported registries. The information contained in this diff is provided for informational purposes only and reflects changes between package versions as they appear in their respective public registries.
- checksums.yaml +7 -0
- data/LICENSE +201 -0
- data/README.md +554 -0
- data/lib/prometheus/client/config.rb +15 -0
- data/lib/prometheus/client/counter.rb +21 -0
- data/lib/prometheus/client/data_stores/README.md +306 -0
- data/lib/prometheus/client/data_stores/direct_file_store.rb +368 -0
- data/lib/prometheus/client/data_stores/single_threaded.rb +56 -0
- data/lib/prometheus/client/data_stores/synchronized.rb +62 -0
- data/lib/prometheus/client/formats/text.rb +106 -0
- data/lib/prometheus/client/gauge.rb +42 -0
- data/lib/prometheus/client/histogram.rb +151 -0
- data/lib/prometheus/client/label_set_validator.rb +80 -0
- data/lib/prometheus/client/metric.rb +120 -0
- data/lib/prometheus/client/push.rb +226 -0
- data/lib/prometheus/client/registry.rb +100 -0
- data/lib/prometheus/client/summary.rb +69 -0
- data/lib/prometheus/client/version.rb +7 -0
- data/lib/prometheus/client/vm_histogram.rb +164 -0
- data/lib/prometheus/client.rb +18 -0
- data/lib/prometheus/middleware/collector.rb +103 -0
- data/lib/prometheus/middleware/exporter.rb +96 -0
- data/lib/prometheus.rb +5 -0
- metadata +108 -0
data/README.md
ADDED
|
@@ -0,0 +1,554 @@
|
|
|
1
|
+
# VictoriaMetrics Ruby Client
|
|
2
|
+
|
|
3
|
+
Fork of [prometheus-client](https://github.com/prometheus/client_ruby) intended to be a drop-in replacement for `prometheus-client` to switch from Prometheus to [VictoriaMetrics](https://github.com/VictoriaMetrics/VictoriaMetrics)
|
|
4
|
+
|
|
5
|
+
[![Gem Version][4]](http://badge.fury.io/rb/prometheus-client)
|
|
6
|
+
[![Build Status][3]](https://circleci.com/gh/Koilanetroc/vm-client/tree/main.svg?style=svg)
|
|
7
|
+
|
|
8
|
+
## vm-client overview
|
|
9
|
+
VictoriaMetrics has many [prominent features](https://docs.victoriametrics.com/Single-server-VictoriaMetrics.html#prominent-features) and can be used as drop-in replacement for Prometheus for [scraping targets](https://docs.victoriametrics.com/Single-server-VictoriaMetrics.html#how-to-scrape-prometheus-exporters-such-as-node-exporter).
|
|
10
|
+
Also [VictoriaMetrics accepts data](https://github.com/prometheus/pushgateway#url) in [Prometheus exposition format](https://github.com/prometheus/docs/blob/master/content/docs/instrumenting/exposition_formats.md#text-based-format) and [Pushgateway format](https://github.com/prometheus/pushgateway#url).
|
|
11
|
+
|
|
12
|
+
### Compatibility with original prometheus-client
|
|
13
|
+
`vm-client` is fully compatible with `prometheus-client` and can be used as a drop-in replacement. It only adds new features without breaking original ones. Gem uses original `prometheus` namespaces and there is no need to change anything.
|
|
14
|
+
|
|
15
|
+
## vm-client features
|
|
16
|
+
### VM histograms
|
|
17
|
+
`vm-client` supports [VictoriaMetrics histograms](https://valyala.medium.com/improving-histogram-usability-for-prometheus-and-grafana-bc7e5df0e350). See [VM histogram section](#victoriametrics-histogram) for usage examples.
|
|
18
|
+
#### VictoriaMetrics histogram internals
|
|
19
|
+
Buckets for VM histograms are created on demand and cover values in the following range: [10-⁹…10¹⁸]. This includes:
|
|
20
|
+
- Times from nanoseconds to billions of years.
|
|
21
|
+
- Sizes from 0 bytes to 2⁶⁰ bytes.
|
|
22
|
+
|
|
23
|
+
The Histogram splits each `(10^n...10^(n+1)]` range into 18 log-based buckets with `10^(1/18)=1.136` multiplier:
|
|
24
|
+
|
|
25
|
+
`(1.0*10^n…1.136*10^n], (1.136*10^n…1.292*10^n], … (8.799*10^n…1.0*10^(n+1)]`
|
|
26
|
+
|
|
27
|
+
In total there are 487 possible buckets and this gives 13.6% worst-case precision error, which is enough for most practical cases.
|
|
28
|
+
#### Why switch to VM histograms?
|
|
29
|
+
- There is no need in thinking about bucket ranges and the number of buckets per histogram, since buckets are created on demand.
|
|
30
|
+
- There is no need in worrying about high cardinality, since only buckets with non-zero values are exposed to VictoriaMetrics. Usually real-world values are located on quite small range, so they are covered by small number of histogram buckets.
|
|
31
|
+
- There is no need in re-configuring buckets over time, since bucket configuration is static. This allows performing cross-histogram calculations
|
|
32
|
+
- It allows calculating any quantiles using [MetricsQL](https://docs.victoriametrics.com/MetricsQL.html)
|
|
33
|
+
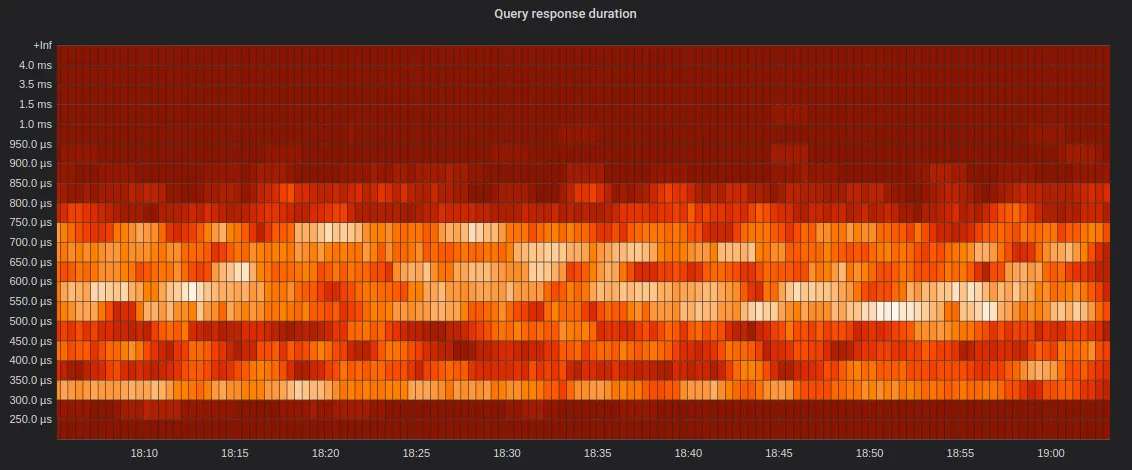
- It allows building pretty informative heatmaps in grafana
|
|
34
|
+
|
|
35
|
+
Image from [VictoriaMetrics histograms](https://valyala.medium.com/improving-histogram-usability-for-prometheus-and-grafana-bc7e5df0e350) article.
|
|
36
|
+
|
|
37
|
+
## Usage
|
|
38
|
+
|
|
39
|
+
### Installation
|
|
40
|
+
|
|
41
|
+
For a global installation run `gem install vm-client`.
|
|
42
|
+
|
|
43
|
+
If you're using [Bundler](https://bundler.io/) replace `gem "prometheus-client"` with `gem "vm-client"` in your `Gemfile`.
|
|
44
|
+
Make sure to run `bundle install` afterwards.
|
|
45
|
+
|
|
46
|
+
### Original prometheus-client overview
|
|
47
|
+
|
|
48
|
+
```ruby
|
|
49
|
+
require 'prometheus/client'
|
|
50
|
+
|
|
51
|
+
# returns a default registry
|
|
52
|
+
prometheus = Prometheus::Client.registry
|
|
53
|
+
|
|
54
|
+
# create a new counter metric
|
|
55
|
+
http_requests = Prometheus::Client::Counter.new(:http_requests, docstring: 'A counter of HTTP requests made')
|
|
56
|
+
# register the metric
|
|
57
|
+
prometheus.register(http_requests)
|
|
58
|
+
|
|
59
|
+
# equivalent helper function
|
|
60
|
+
http_requests = prometheus.counter(:http_requests, docstring: 'A counter of HTTP requests made')
|
|
61
|
+
|
|
62
|
+
# start using the counter
|
|
63
|
+
http_requests.increment
|
|
64
|
+
```
|
|
65
|
+
|
|
66
|
+
### Rack middleware
|
|
67
|
+
|
|
68
|
+
There are two [Rack][2] middlewares available, one to expose a metrics HTTP
|
|
69
|
+
endpoint to be scraped by a Prometheus server ([Exporter][9]) and one to trace all HTTP
|
|
70
|
+
requests ([Collector][10]).
|
|
71
|
+
|
|
72
|
+
It's highly recommended to enable gzip compression for the metrics endpoint,
|
|
73
|
+
for example by including the `Rack::Deflater` middleware.
|
|
74
|
+
|
|
75
|
+
```ruby
|
|
76
|
+
# config.ru
|
|
77
|
+
|
|
78
|
+
require 'rack'
|
|
79
|
+
require 'prometheus/middleware/collector'
|
|
80
|
+
require 'prometheus/middleware/exporter'
|
|
81
|
+
|
|
82
|
+
use Rack::Deflater
|
|
83
|
+
use Prometheus::Middleware::Collector
|
|
84
|
+
use Prometheus::Middleware::Exporter
|
|
85
|
+
|
|
86
|
+
run ->(_) { [200, {'content-type' => 'text/html'}, ['OK']] }
|
|
87
|
+
```
|
|
88
|
+
|
|
89
|
+
Start the server and have a look at the metrics endpoint:
|
|
90
|
+
[http://localhost:5123/metrics](http://localhost:5123/metrics).
|
|
91
|
+
|
|
92
|
+
For further instructions and other scripts to get started, have a look at the
|
|
93
|
+
integrated [example application](examples/rack/README.md).
|
|
94
|
+
|
|
95
|
+
### Pushgateway
|
|
96
|
+
|
|
97
|
+
The Ruby client can also be used to push its collected metrics to a
|
|
98
|
+
[Pushgateway][8]. This comes in handy with batch jobs or in other scenarios
|
|
99
|
+
where it's not possible or feasible to let a Prometheus server scrape a Ruby
|
|
100
|
+
process. TLS and HTTP basic authentication are supported.
|
|
101
|
+
|
|
102
|
+
```ruby
|
|
103
|
+
require 'prometheus/client'
|
|
104
|
+
require 'prometheus/client/push'
|
|
105
|
+
|
|
106
|
+
registry = Prometheus::Client.registry
|
|
107
|
+
# ... register some metrics, set/increment/observe/etc. their values
|
|
108
|
+
|
|
109
|
+
# push the registry state to the default gateway
|
|
110
|
+
Prometheus::Client::Push.new(job: 'my-batch-job').add(registry)
|
|
111
|
+
|
|
112
|
+
# optional: specify a grouping key that uniquely identifies a job instance, and gateway.
|
|
113
|
+
#
|
|
114
|
+
# Note: the labels you use in the grouping key must not conflict with labels set on the
|
|
115
|
+
# metrics being pushed. If they do, an error will be raised.
|
|
116
|
+
Prometheus::Client::Push.new(
|
|
117
|
+
job: 'my-batch-job',
|
|
118
|
+
gateway: 'https://example.domain:1234',
|
|
119
|
+
grouping_key: { instance: 'some-instance', extra_key: 'foobar' }
|
|
120
|
+
).add(registry)
|
|
121
|
+
|
|
122
|
+
# If you want to replace any previously pushed metrics for a given grouping key,
|
|
123
|
+
# use the #replace method.
|
|
124
|
+
#
|
|
125
|
+
# Unlike #add, this will completely replace the metrics under the specified grouping key
|
|
126
|
+
# (i.e. anything currently present in the pushgateway for the specified grouping key, but
|
|
127
|
+
# not present in the registry for that grouping key will be removed).
|
|
128
|
+
#
|
|
129
|
+
# See https://github.com/prometheus/pushgateway#put-method for a full explanation.
|
|
130
|
+
Prometheus::Client::Push.new(job: 'my-batch-job').replace(registry)
|
|
131
|
+
|
|
132
|
+
# If you want to delete all previously pushed metrics for a given grouping key,
|
|
133
|
+
# use the #delete method.
|
|
134
|
+
Prometheus::Client::Push.new(job: 'my-batch-job').delete
|
|
135
|
+
```
|
|
136
|
+
|
|
137
|
+
#### Basic authentication
|
|
138
|
+
|
|
139
|
+
By design, `Prometheus::Client::Push` doesn't read credentials for HTTP basic
|
|
140
|
+
authentication when they are passed in via the gateway URL using the
|
|
141
|
+
`http://user:password@example.com:9091` syntax, and will in fact raise an error if they're
|
|
142
|
+
supplied that way.
|
|
143
|
+
|
|
144
|
+
The reason for this is that when using that syntax, the username and password
|
|
145
|
+
have to follow the usual rules for URL encoding of characters [per RFC
|
|
146
|
+
3986](https://datatracker.ietf.org/doc/html/rfc3986#section-2.1).
|
|
147
|
+
|
|
148
|
+
Rather than place the burden of correctly performing that encoding on users of this gem,
|
|
149
|
+
we decided to have a separate method for supplying HTTP basic authentication credentials,
|
|
150
|
+
with no requirement to URL encode the characters in them.
|
|
151
|
+
|
|
152
|
+
Instead of passing credentials like this:
|
|
153
|
+
|
|
154
|
+
```ruby
|
|
155
|
+
push = Prometheus::Client::Push.new(job: "my-job", gateway: "http://user:password@localhost:9091")
|
|
156
|
+
```
|
|
157
|
+
|
|
158
|
+
please pass them like this:
|
|
159
|
+
|
|
160
|
+
```ruby
|
|
161
|
+
push = Prometheus::Client::Push.new(job: "my-job", gateway: "http://localhost:9091")
|
|
162
|
+
push.basic_auth("user", "password")
|
|
163
|
+
```
|
|
164
|
+
|
|
165
|
+
## Metrics
|
|
166
|
+
|
|
167
|
+
The following metric types are currently supported.
|
|
168
|
+
|
|
169
|
+
### Counter
|
|
170
|
+
|
|
171
|
+
Counter is a metric that exposes merely a sum or tally of things.
|
|
172
|
+
|
|
173
|
+
```ruby
|
|
174
|
+
counter = Prometheus::Client::Counter.new(:service_requests_total, docstring: '...', labels: [:service])
|
|
175
|
+
|
|
176
|
+
# increment the counter for a given label set
|
|
177
|
+
counter.increment(labels: { service: 'foo' })
|
|
178
|
+
|
|
179
|
+
# increment by a given value
|
|
180
|
+
counter.increment(by: 5, labels: { service: 'bar' })
|
|
181
|
+
|
|
182
|
+
# get current value for a given label set
|
|
183
|
+
counter.get(labels: { service: 'bar' })
|
|
184
|
+
# => 5
|
|
185
|
+
```
|
|
186
|
+
|
|
187
|
+
### Gauge
|
|
188
|
+
|
|
189
|
+
Gauge is a metric that exposes merely an instantaneous value or some snapshot
|
|
190
|
+
thereof.
|
|
191
|
+
|
|
192
|
+
```ruby
|
|
193
|
+
gauge = Prometheus::Client::Gauge.new(:room_temperature_celsius, docstring: '...', labels: [:room])
|
|
194
|
+
|
|
195
|
+
# set a value
|
|
196
|
+
gauge.set(21.534, labels: { room: 'kitchen' })
|
|
197
|
+
|
|
198
|
+
# retrieve the current value for a given label set
|
|
199
|
+
gauge.get(labels: { room: 'kitchen' })
|
|
200
|
+
# => 21.534
|
|
201
|
+
|
|
202
|
+
# increment the value (default is 1)
|
|
203
|
+
gauge.increment(labels: { room: 'kitchen' })
|
|
204
|
+
# => 22.534
|
|
205
|
+
|
|
206
|
+
# decrement the value by a given value
|
|
207
|
+
gauge.decrement(by: 5, labels: { room: 'kitchen' })
|
|
208
|
+
# => 17.534
|
|
209
|
+
```
|
|
210
|
+
|
|
211
|
+
### Histogram
|
|
212
|
+
|
|
213
|
+
A histogram samples observations (usually things like request durations or
|
|
214
|
+
response sizes) and counts them in configurable buckets. It also provides a sum
|
|
215
|
+
of all observed values.
|
|
216
|
+
|
|
217
|
+
```ruby
|
|
218
|
+
histogram = Prometheus::Client::Histogram.new(:service_latency_seconds, docstring: '...', labels: [:service])
|
|
219
|
+
|
|
220
|
+
# record a value
|
|
221
|
+
histogram.observe(Benchmark.realtime { service.call(arg) }, labels: { service: 'users' })
|
|
222
|
+
|
|
223
|
+
# retrieve the current bucket values
|
|
224
|
+
histogram.get(labels: { service: 'users' })
|
|
225
|
+
# => { 0.005 => 3, 0.01 => 15, 0.025 => 18, ..., 2.5 => 42, 5 => 42, 10 = >42 }
|
|
226
|
+
```
|
|
227
|
+
|
|
228
|
+
Histograms provide default buckets of `[0.005, 0.01, 0.025, 0.05, 0.1, 0.25, 0.5, 1, 2.5, 5, 10]`
|
|
229
|
+
|
|
230
|
+
You can specify your own buckets, either explicitly, or using the `Histogram.linear_buckets`
|
|
231
|
+
or `Histogram.exponential_buckets` methods to define regularly spaced buckets.
|
|
232
|
+
|
|
233
|
+
### VictoriaMetrics histogram
|
|
234
|
+
Vm histogram works similar to original Histogram:
|
|
235
|
+
```ruby
|
|
236
|
+
histogram = Prometheus::Client::VmHistogram.new(:service_latency_seconds, docstring: '...', labels: [:service])
|
|
237
|
+
|
|
238
|
+
# record some value
|
|
239
|
+
histogram.observe(100, labels: { service: 'users' })
|
|
240
|
+
|
|
241
|
+
# retrieve dynamicaly generated vmrange buckets
|
|
242
|
+
histogram.get(labels: { service: 'users' })
|
|
243
|
+
# => { '8.799e+01...1.000e+02' => 1.0, 'count' => 1.0, 'sum' => 100.0 }
|
|
244
|
+
```
|
|
245
|
+
`VmHistogram` can accept `buckets` keyword, but it won't be used. Its only for compatibility.
|
|
246
|
+
|
|
247
|
+
Basically global replacement in project of `Prometheus::Client::Histogram` with `Prometheus::Client::VmHistogram` should be enough to start using VM histograms.
|
|
248
|
+
|
|
249
|
+
### Summary
|
|
250
|
+
|
|
251
|
+
Summary, similar to histograms, is an accumulator for samples. It captures
|
|
252
|
+
Numeric data and provides an efficient percentile calculation mechanism.
|
|
253
|
+
|
|
254
|
+
For now, only `sum` and `total` (count of observations) are supported, no actual quantiles.
|
|
255
|
+
|
|
256
|
+
```ruby
|
|
257
|
+
summary = Prometheus::Client::Summary.new(:service_latency_seconds, docstring: '...', labels: [:service])
|
|
258
|
+
|
|
259
|
+
# record a value
|
|
260
|
+
summary.observe(Benchmark.realtime { service.call() }, labels: { service: 'database' })
|
|
261
|
+
|
|
262
|
+
# retrieve the current sum and total values
|
|
263
|
+
summary_value = summary.get(labels: { service: 'database' })
|
|
264
|
+
summary_value['sum'] # => 123.45
|
|
265
|
+
summary_value['count'] # => 100
|
|
266
|
+
```
|
|
267
|
+
|
|
268
|
+
## Labels
|
|
269
|
+
|
|
270
|
+
All metrics can have labels, allowing grouping of related time series.
|
|
271
|
+
|
|
272
|
+
Labels are an extremely powerful feature, but one that must be used with care.
|
|
273
|
+
Refer to the best practices on [naming](https://prometheus.io/docs/practices/naming/) and
|
|
274
|
+
[labels](https://prometheus.io/docs/practices/instrumentation/#use-labels).
|
|
275
|
+
|
|
276
|
+
Most importantly, avoid labels that can have a large number of possible values (high
|
|
277
|
+
cardinality). For example, an HTTP Status Code is a good label. A User ID is **not**.
|
|
278
|
+
|
|
279
|
+
Labels are specified optionally when updating metrics, as a hash of `label_name => value`.
|
|
280
|
+
Refer to [the Prometheus documentation](https://prometheus.io/docs/concepts/data_model/#metric-names-and-labels)
|
|
281
|
+
as to what's a valid `label_name`.
|
|
282
|
+
|
|
283
|
+
In order for a metric to accept labels, their names must be specified when first initializing
|
|
284
|
+
the metric. Then, when the metric is updated, all the specified labels must be present.
|
|
285
|
+
|
|
286
|
+
Example:
|
|
287
|
+
|
|
288
|
+
```ruby
|
|
289
|
+
https_requests_total = Counter.new(:http_requests_total, docstring: '...', labels: [:service, :status_code])
|
|
290
|
+
|
|
291
|
+
# increment the counter for a given label set
|
|
292
|
+
https_requests_total.increment(labels: { service: "my_service", status_code: response.status_code })
|
|
293
|
+
```
|
|
294
|
+
|
|
295
|
+
### Pre-set Label Values
|
|
296
|
+
|
|
297
|
+
You can also "pre-set" some of these label values, if they'll always be the same, so you don't
|
|
298
|
+
need to specify them every time:
|
|
299
|
+
|
|
300
|
+
```ruby
|
|
301
|
+
https_requests_total = Counter.new(:http_requests_total,
|
|
302
|
+
docstring: '...',
|
|
303
|
+
labels: [:service, :status_code],
|
|
304
|
+
preset_labels: { service: "my_service" })
|
|
305
|
+
|
|
306
|
+
# increment the counter for a given label set
|
|
307
|
+
https_requests_total.increment(labels: { status_code: response.status_code })
|
|
308
|
+
```
|
|
309
|
+
|
|
310
|
+
### `with_labels`
|
|
311
|
+
|
|
312
|
+
Similar to pre-setting labels, you can get a new instance of an existing metric object,
|
|
313
|
+
with a subset (or full set) of labels set, so that you can increment / observe the metric
|
|
314
|
+
without having to specify the labels for every call.
|
|
315
|
+
|
|
316
|
+
Moreover, if all the labels the metric can take have been pre-set, validation of the labels
|
|
317
|
+
is done on the call to `with_labels`, and then skipped for each observation, which can
|
|
318
|
+
lead to performance improvements. If you are incrementing a counter in a fast loop, you
|
|
319
|
+
definitely want to be doing this.
|
|
320
|
+
|
|
321
|
+
|
|
322
|
+
Examples:
|
|
323
|
+
|
|
324
|
+
**Pre-setting labels for ease of use:**
|
|
325
|
+
|
|
326
|
+
```ruby
|
|
327
|
+
# in the metric definition:
|
|
328
|
+
records_processed_total = registry.counter.new(:records_processed_total,
|
|
329
|
+
docstring: '...',
|
|
330
|
+
labels: [:service, :component],
|
|
331
|
+
preset_labels: { service: "my_service" })
|
|
332
|
+
|
|
333
|
+
# in one-off calls, you'd specify the missing labels (component in this case)
|
|
334
|
+
records_processed_total.increment(labels: { component: 'a_component' })
|
|
335
|
+
|
|
336
|
+
# you can also have a "view" on this metric for a specific component where this label is
|
|
337
|
+
# pre-set:
|
|
338
|
+
class MyComponent
|
|
339
|
+
def metric
|
|
340
|
+
@metric ||= records_processed_total.with_labels(component: "my_component")
|
|
341
|
+
end
|
|
342
|
+
|
|
343
|
+
def process
|
|
344
|
+
records.each do |record|
|
|
345
|
+
# process the record
|
|
346
|
+
metric.increment
|
|
347
|
+
end
|
|
348
|
+
end
|
|
349
|
+
end
|
|
350
|
+
```
|
|
351
|
+
|
|
352
|
+
### `init_label_set`
|
|
353
|
+
|
|
354
|
+
The time series of a metric are not initialized until something happens. For counters, for example, this means that the time series do not exist until the counter is incremented for the first time.
|
|
355
|
+
|
|
356
|
+
To get around this problem the client provides the `init_label_set` method that can be used to initialise the time series of a metric for a given label set.
|
|
357
|
+
|
|
358
|
+
### Reserved labels
|
|
359
|
+
|
|
360
|
+
The following labels are reserved by the client library, and attempting to use them in a
|
|
361
|
+
metric definition will result in a
|
|
362
|
+
`Prometheus::Client::LabelSetValidator::ReservedLabelError` being raised:
|
|
363
|
+
|
|
364
|
+
- `:job`
|
|
365
|
+
- `:instance`
|
|
366
|
+
- `:pid`
|
|
367
|
+
|
|
368
|
+
## Data Stores
|
|
369
|
+
|
|
370
|
+
The data for all the metrics (the internal counters associated with each labelset)
|
|
371
|
+
is stored in a global Data Store object, rather than in the metric objects themselves.
|
|
372
|
+
(This "storage" is ephemeral, generally in-memory, it's not "long-term storage")
|
|
373
|
+
|
|
374
|
+
The main reason to do this is that different applications may have different requirements
|
|
375
|
+
for their metrics storage. Applications running in pre-fork servers (like Unicorn, for
|
|
376
|
+
example), require a shared store between all the processes, to be able to report coherent
|
|
377
|
+
numbers. At the same time, other applications may not have this requirement but be very
|
|
378
|
+
sensitive to performance, and would prefer instead a simpler, faster store.
|
|
379
|
+
|
|
380
|
+
By having a standardized and simple interface that metrics use to access this store,
|
|
381
|
+
we abstract away the details of storing the data from the specific needs of each metric.
|
|
382
|
+
This allows us to then simply swap around the stores based on the needs of different
|
|
383
|
+
applications, with no changes to the rest of the client.
|
|
384
|
+
|
|
385
|
+
The client provides 3 built-in stores, but if neither of these is ideal for your
|
|
386
|
+
requirements, you can easily make your own store and use that instead. More on this below.
|
|
387
|
+
|
|
388
|
+
### Configuring which store to use.
|
|
389
|
+
|
|
390
|
+
By default, the Client uses the `Synchronized` store, which is a simple, thread-safe Store
|
|
391
|
+
for single-process scenarios.
|
|
392
|
+
|
|
393
|
+
If you need to use a different store, set it in the Client Config:
|
|
394
|
+
|
|
395
|
+
```ruby
|
|
396
|
+
Prometheus::Client.config.data_store = Prometheus::Client::DataStores::DataStore.new(store_specific_params)
|
|
397
|
+
```
|
|
398
|
+
|
|
399
|
+
NOTE: You **must** make sure to set the `data_store` before initializing any metrics.
|
|
400
|
+
If using Rails, you probably want to set up your Data Store on `config/application.rb`,
|
|
401
|
+
or `config/environments/*`, both of which run before `config/initializers/*`
|
|
402
|
+
|
|
403
|
+
Also note that `config.data_store` is set to an *instance* of a `DataStore`, not to the
|
|
404
|
+
class. This is so that the stores can receive parameters. Most of the built-in stores
|
|
405
|
+
don't require any, but `DirectFileStore` does, for example.
|
|
406
|
+
|
|
407
|
+
When instantiating metrics, there is an optional `store_settings` attribute. This is used
|
|
408
|
+
to set up store-specific settings for each metric. For most stores, this is not used, but
|
|
409
|
+
for multi-process stores, this is used to specify how to aggregate the values of each
|
|
410
|
+
metric across multiple processes. For the most part, this is used for Gauges, to specify
|
|
411
|
+
whether you want to report the `SUM`, `MAX`, `MIN`, or `MOST_RECENT` value observed across
|
|
412
|
+
all processes. For almost all other cases, you'd leave the default (`SUM`). More on this
|
|
413
|
+
on the *Aggregation* section below.
|
|
414
|
+
|
|
415
|
+
Custom stores may also accept extra parameters besides `:aggregation`. See the
|
|
416
|
+
documentation of each store for more details.
|
|
417
|
+
|
|
418
|
+
### Built-in stores
|
|
419
|
+
|
|
420
|
+
There are 3 built-in stores, with different trade-offs:
|
|
421
|
+
|
|
422
|
+
- **Synchronized**: Default store. Thread safe, but not suitable for multi-process
|
|
423
|
+
scenarios (e.g. pre-fork servers, like Unicorn). Stores data in Hashes, with all accesses
|
|
424
|
+
protected by Mutexes.
|
|
425
|
+
- **SingleThreaded**: Fastest store, but only suitable for single-threaded scenarios.
|
|
426
|
+
This store does not make any effort to synchronize access to its internal hashes, so
|
|
427
|
+
it's absolutely not thread safe.
|
|
428
|
+
- **DirectFileStore**: Stores data in binary files, one file per process and per metric.
|
|
429
|
+
This is generally the recommended store to use with pre-fork servers and other
|
|
430
|
+
"multi-process" scenarios. There are some important caveats to using this store, so
|
|
431
|
+
please read on the section below.
|
|
432
|
+
|
|
433
|
+
### `DirectFileStore` caveats and things to keep in mind
|
|
434
|
+
|
|
435
|
+
Each metric gets a file for each process, and manages its contents by storing keys and
|
|
436
|
+
binary floats next to them, and updating the offsets of those Floats directly. When
|
|
437
|
+
exporting metrics, it will find all the files that apply to each metric, read them,
|
|
438
|
+
and aggregate them.
|
|
439
|
+
|
|
440
|
+
**Aggregation of metrics**: Since there will be several files per metrics (one per process),
|
|
441
|
+
these need to be aggregated to present a coherent view to Prometheus. Depending on your
|
|
442
|
+
use case, you may need to control how this works. When using this store,
|
|
443
|
+
each Metric allows you to specify an `:aggregation` setting, defining how
|
|
444
|
+
to aggregate the multiple possible values we can get for each labelset. By default,
|
|
445
|
+
Counters, Histograms and Summaries are `SUM`med, and Gauges report all their values (one
|
|
446
|
+
for each process), tagged with a `pid` label. You can also select `SUM`, `MAX`, `MIN`, or
|
|
447
|
+
`MOST_RECENT` for your gauges, depending on your use case.
|
|
448
|
+
|
|
449
|
+
Please note that the `MOST_RECENT` aggregation only works for gauges, and it does not
|
|
450
|
+
allow the use of `increment` / `decrement`, you can only use `set`.
|
|
451
|
+
|
|
452
|
+
**Memory Usage**: When scraped by Prometheus, this store will read all these files, get all
|
|
453
|
+
the values and aggregate them. We have notice this can have a noticeable effect on memory
|
|
454
|
+
usage for your app. We recommend you test this in a realistic usage scenario to make sure
|
|
455
|
+
you won't hit any memory limits your app may have.
|
|
456
|
+
|
|
457
|
+
**Resetting your metrics on each run**: You should also make sure that the directory where
|
|
458
|
+
you store your metric files (specified when initializing the `DirectFileStore`) is emptied
|
|
459
|
+
when your app starts. Otherwise, each app run will continue exporting the metrics from the
|
|
460
|
+
previous run.
|
|
461
|
+
|
|
462
|
+
If you have this issue, one way to do this is to run code similar to this as part of you
|
|
463
|
+
initialization:
|
|
464
|
+
|
|
465
|
+
```ruby
|
|
466
|
+
Dir["#{app_path}/tmp/prometheus/*.bin"].each do |file_path|
|
|
467
|
+
File.unlink(file_path)
|
|
468
|
+
end
|
|
469
|
+
```
|
|
470
|
+
|
|
471
|
+
If you are running in pre-fork servers (such as Unicorn or Puma with multiple processes),
|
|
472
|
+
make sure you do this **before** the server forks. Otherwise, each child process may delete
|
|
473
|
+
files created by other processes on *this* run, instead of deleting old files.
|
|
474
|
+
|
|
475
|
+
**Declare metrics before fork**: As well as deleting files before your process forks, you
|
|
476
|
+
should make sure to declare your metrics before forking too. Because the metric registry
|
|
477
|
+
is held in memory, any metrics declared after forking will only be present in child
|
|
478
|
+
processes where the code declaring them ran, and as a result may not be consistently
|
|
479
|
+
exported when scraped (i.e. they will only appear when a child process that declared them
|
|
480
|
+
is scraped).
|
|
481
|
+
|
|
482
|
+
If you're absolutely sure that every child process will run the metric declaration code,
|
|
483
|
+
then you won't run into this issue, but the simplest approach is to declare the metrics
|
|
484
|
+
before forking.
|
|
485
|
+
|
|
486
|
+
**Large numbers of files**: Because there is an individual file per metric and per process
|
|
487
|
+
(which is done to optimize for observation performance), you may end up with a large number
|
|
488
|
+
of files. We don't currently have a solution for this problem, but we're working on it.
|
|
489
|
+
|
|
490
|
+
**Performance**: Even though this store saves data on disk, it's still much faster than
|
|
491
|
+
would probably be expected, because the files are never actually `fsync`ed, so the store
|
|
492
|
+
never blocks while waiting for disk. The kernel's page cache is incredibly efficient in
|
|
493
|
+
this regard. If in doubt, check the benchmark scripts described in the documentation for
|
|
494
|
+
creating your own stores and run them in your particular runtime environment to make sure
|
|
495
|
+
this provides adequate performance.
|
|
496
|
+
|
|
497
|
+
|
|
498
|
+
### Building your own store, and stores other than the built-in ones.
|
|
499
|
+
|
|
500
|
+
If none of these stores is suitable for your requirements, you can easily make your own.
|
|
501
|
+
|
|
502
|
+
The interface and requirements of Stores are specified in detail in the `README.md`
|
|
503
|
+
in the `client/data_stores` directory. This thoroughly documents how to make your own
|
|
504
|
+
store.
|
|
505
|
+
|
|
506
|
+
There are also links there to non-built-in stores created by others that may be useful,
|
|
507
|
+
either as they are, or as a starting point for making your own.
|
|
508
|
+
|
|
509
|
+
### Aggregation settings for multi-process stores
|
|
510
|
+
|
|
511
|
+
If you are in a multi-process environment (such as pre-fork servers like Unicorn), each
|
|
512
|
+
process will probably keep their own counters, which need to be aggregated when receiving
|
|
513
|
+
a Prometheus scrape, to report coherent total numbers.
|
|
514
|
+
|
|
515
|
+
For Counters, Histograms and quantile-less Summaries this is simply a matter of
|
|
516
|
+
summing the values of each process.
|
|
517
|
+
|
|
518
|
+
For Gauges, however, this may not be the right thing to do, depending on what they're
|
|
519
|
+
measuring. You might want to take the maximum or minimum value observed in any process,
|
|
520
|
+
rather than the sum of all of them. By default, we export each process's individual
|
|
521
|
+
value, with a `pid` label identifying each one.
|
|
522
|
+
|
|
523
|
+
If these defaults don't work for your use case, you should use the `store_settings`
|
|
524
|
+
parameter when registering the metric, to specify an `:aggregation` setting.
|
|
525
|
+
|
|
526
|
+
```ruby
|
|
527
|
+
free_disk_space = registry.gauge(:free_disk_space_bytes,
|
|
528
|
+
docstring: "Free disk space, in bytes",
|
|
529
|
+
store_settings: { aggregation: :max })
|
|
530
|
+
```
|
|
531
|
+
|
|
532
|
+
NOTE: This will only work if the store you're using supports the `:aggregation` setting.
|
|
533
|
+
Of the built-in stores, only `DirectFileStore` does.
|
|
534
|
+
|
|
535
|
+
Also note that the `:aggregation` setting works for all metric types, not just for gauges.
|
|
536
|
+
It would be unusual to use it for anything other than gauges, but if your use-case
|
|
537
|
+
requires it, the store will respect your aggregation wishes.
|
|
538
|
+
|
|
539
|
+
## Tests
|
|
540
|
+
|
|
541
|
+
Install necessary development gems with `bundle install` and run tests with
|
|
542
|
+
rspec:
|
|
543
|
+
|
|
544
|
+
```bash
|
|
545
|
+
rake
|
|
546
|
+
```
|
|
547
|
+
|
|
548
|
+
[1]: https://github.com/VictoriaMetrics/VictoriaMetrics
|
|
549
|
+
[2]: http://rack.github.io/
|
|
550
|
+
[3]: https://circleci.com/gh/Koilanetroc/vm-client/tree/main.svg?style=svg
|
|
551
|
+
[4]: https://badge.fury.io/rb/prometheus-client.svg
|
|
552
|
+
[8]: https://github.com/prometheus/pushgateway
|
|
553
|
+
[9]: lib/prometheus/middleware/exporter.rb
|
|
554
|
+
[10]: lib/prometheus/middleware/collector.rb
|
|
@@ -0,0 +1,15 @@
|
|
|
1
|
+
# encoding: UTF-8
|
|
2
|
+
|
|
3
|
+
require 'prometheus/client/data_stores/synchronized'
|
|
4
|
+
|
|
5
|
+
module Prometheus
|
|
6
|
+
module Client
|
|
7
|
+
class Config
|
|
8
|
+
attr_accessor :data_store
|
|
9
|
+
|
|
10
|
+
def initialize
|
|
11
|
+
@data_store = Prometheus::Client::DataStores::Synchronized.new
|
|
12
|
+
end
|
|
13
|
+
end
|
|
14
|
+
end
|
|
15
|
+
end
|
|
@@ -0,0 +1,21 @@
|
|
|
1
|
+
# encoding: UTF-8
|
|
2
|
+
|
|
3
|
+
require 'prometheus/client/metric'
|
|
4
|
+
|
|
5
|
+
module Prometheus
|
|
6
|
+
module Client
|
|
7
|
+
# Counter is a metric that exposes merely a sum or tally of things.
|
|
8
|
+
class Counter < Metric
|
|
9
|
+
def type
|
|
10
|
+
:counter
|
|
11
|
+
end
|
|
12
|
+
|
|
13
|
+
def increment(by: 1, labels: {})
|
|
14
|
+
raise ArgumentError, 'increment must be a non-negative number' if by < 0
|
|
15
|
+
|
|
16
|
+
label_set = label_set_for(labels)
|
|
17
|
+
@store.increment(labels: label_set, by: by)
|
|
18
|
+
end
|
|
19
|
+
end
|
|
20
|
+
end
|
|
21
|
+
end
|