d3js-plugins-rails 0.0.1
This diff represents the content of publicly available package versions that have been released to one of the supported registries. The information contained in this diff is provided for informational purposes only and reflects changes between package versions as they appear in their respective public registries.
- data/.gitignore +17 -0
- data/Gemfile +4 -0
- data/LICENSE +22 -0
- data/README.md +28 -0
- data/Rakefile +1 -0
- data/d3js-plugins-rails.gemspec +21 -0
- data/lib/d3js-plugins-rails/version.rb +7 -0
- data/lib/d3js-plugins-rails.rb +10 -0
- data/vendor/assets/javascripts/d3/plugins/.gitignore +1 -0
- data/vendor/assets/javascripts/d3/plugins/LICENSE +26 -0
- data/vendor/assets/javascripts/d3/plugins/Makefile +87 -0
- data/vendor/assets/javascripts/d3/plugins/README.md +19 -0
- data/vendor/assets/javascripts/d3/plugins/box/box.js +301 -0
- data/vendor/assets/javascripts/d3/plugins/bullet/README.md +14 -0
- data/vendor/assets/javascripts/d3/plugins/bullet/bullet.js +241 -0
- data/vendor/assets/javascripts/d3/plugins/chernoff/README.md +15 -0
- data/vendor/assets/javascripts/d3/plugins/chernoff/chernoff.js +176 -0
- data/vendor/assets/javascripts/d3/plugins/cie/README.md +54 -0
- data/vendor/assets/javascripts/d3/plugins/cie/cie.js +155 -0
- data/vendor/assets/javascripts/d3/plugins/fisheye/README.md +43 -0
- data/vendor/assets/javascripts/d3/plugins/fisheye/fisheye.js +85 -0
- data/vendor/assets/javascripts/d3/plugins/force_labels/README.md +29 -0
- data/vendor/assets/javascripts/d3/plugins/force_labels/force_labels.js +56 -0
- data/vendor/assets/javascripts/d3/plugins/geo/polyhedron/README.md +7 -0
- data/vendor/assets/javascripts/d3/plugins/geo/polyhedron/polyhedron.js +436 -0
- data/vendor/assets/javascripts/d3/plugins/geo/projection/README.md +107 -0
- data/vendor/assets/javascripts/d3/plugins/geo/projection/aitoff.js +40 -0
- data/vendor/assets/javascripts/d3/plugins/geo/projection/armadillo.js +79 -0
- data/vendor/assets/javascripts/d3/plugins/geo/projection/august.js +15 -0
- data/vendor/assets/javascripts/d3/plugins/geo/projection/baker.js +28 -0
- data/vendor/assets/javascripts/d3/plugins/geo/projection/berghaus.js +60 -0
- data/vendor/assets/javascripts/d3/plugins/geo/projection/boggs.js +27 -0
- data/vendor/assets/javascripts/d3/plugins/geo/projection/bonne.js +29 -0
- data/vendor/assets/javascripts/d3/plugins/geo/projection/bromley.js +5 -0
- data/vendor/assets/javascripts/d3/plugins/geo/projection/collignon.js +17 -0
- data/vendor/assets/javascripts/d3/plugins/geo/projection/conic-conformal.js +29 -0
- data/vendor/assets/javascripts/d3/plugins/geo/projection/conic-equidistant.js +27 -0
- data/vendor/assets/javascripts/d3/plugins/geo/projection/craig.js +24 -0
- data/vendor/assets/javascripts/d3/plugins/geo/projection/craster.js +18 -0
- data/vendor/assets/javascripts/d3/plugins/geo/projection/cylindrical-equal-area.js +23 -0
- data/vendor/assets/javascripts/d3/plugins/geo/projection/eckert1.js +18 -0
- data/vendor/assets/javascripts/d3/plugins/geo/projection/eckert2.js +17 -0
- data/vendor/assets/javascripts/d3/plugins/geo/projection/eckert3.js +17 -0
- data/vendor/assets/javascripts/d3/plugins/geo/projection/eckert4.js +24 -0
- data/vendor/assets/javascripts/d3/plugins/geo/projection/eckert5.js +17 -0
- data/vendor/assets/javascripts/d3/plugins/geo/projection/eckert6.js +22 -0
- data/vendor/assets/javascripts/d3/plugins/geo/projection/eisenlohr.js +16 -0
- data/vendor/assets/javascripts/d3/plugins/geo/projection/end.js +1 -0
- data/vendor/assets/javascripts/d3/plugins/geo/projection/gringorten.js +111 -0
- data/vendor/assets/javascripts/d3/plugins/geo/projection/guyou.js +46 -0
- data/vendor/assets/javascripts/d3/plugins/geo/projection/hammer-retroazimuthal.js +75 -0
- data/vendor/assets/javascripts/d3/plugins/geo/projection/hammer.js +51 -0
- data/vendor/assets/javascripts/d3/plugins/geo/projection/hatano.js +25 -0
- data/vendor/assets/javascripts/d3/plugins/geo/projection/healpix.js +64 -0
- data/vendor/assets/javascripts/d3/plugins/geo/projection/hill.js +64 -0
- data/vendor/assets/javascripts/d3/plugins/geo/projection/homolosine.js +17 -0
- data/vendor/assets/javascripts/d3/plugins/geo/projection/interrupt.js +111 -0
- data/vendor/assets/javascripts/d3/plugins/geo/projection/kavrayskiy7.js +15 -0
- data/vendor/assets/javascripts/d3/plugins/geo/projection/lagrange.js +27 -0
- data/vendor/assets/javascripts/d3/plugins/geo/projection/larrivee.js +39 -0
- data/vendor/assets/javascripts/d3/plugins/geo/projection/laskowski.js +31 -0
- data/vendor/assets/javascripts/d3/plugins/geo/projection/littrow.js +21 -0
- data/vendor/assets/javascripts/d3/plugins/geo/projection/loximuthal.js +29 -0
- data/vendor/assets/javascripts/d3/plugins/geo/projection/miller.js +15 -0
- data/vendor/assets/javascripts/d3/plugins/geo/projection/mollweide.js +35 -0
- data/vendor/assets/javascripts/d3/plugins/geo/projection/mt-flat-polar-parabolic.js +21 -0
- data/vendor/assets/javascripts/d3/plugins/geo/projection/mt-flat-polar-quartic.js +23 -0
- data/vendor/assets/javascripts/d3/plugins/geo/projection/mt-flat-polar-sinusoidal.js +25 -0
- data/vendor/assets/javascripts/d3/plugins/geo/projection/natural-earth.js +22 -0
- data/vendor/assets/javascripts/d3/plugins/geo/projection/nell-hammer.js +20 -0
- data/vendor/assets/javascripts/d3/plugins/geo/projection/parallel1.js +12 -0
- data/vendor/assets/javascripts/d3/plugins/geo/projection/parallel2.js +13 -0
- data/vendor/assets/javascripts/d3/plugins/geo/projection/peirce-quincuncial.js +14 -0
- data/vendor/assets/javascripts/d3/plugins/geo/projection/polyconic.js +25 -0
- data/vendor/assets/javascripts/d3/plugins/geo/projection/projection.js +29 -0
- data/vendor/assets/javascripts/d3/plugins/geo/projection/robinson.js +83 -0
- data/vendor/assets/javascripts/d3/plugins/geo/projection/satellite.js +68 -0
- data/vendor/assets/javascripts/d3/plugins/geo/projection/sinu-mollweide.js +19 -0
- data/vendor/assets/javascripts/d3/plugins/geo/projection/sinusoidal.js +15 -0
- data/vendor/assets/javascripts/d3/plugins/geo/projection/start.js +1 -0
- data/vendor/assets/javascripts/d3/plugins/geo/projection/test/aitoff-test.js +26 -0
- data/vendor/assets/javascripts/d3/plugins/geo/projection/test/armadillo-test.js +28 -0
- data/vendor/assets/javascripts/d3/plugins/geo/projection/test/baker-test.js +26 -0
- data/vendor/assets/javascripts/d3/plugins/geo/projection/test/boggs-test.js +26 -0
- data/vendor/assets/javascripts/d3/plugins/geo/projection/test/bonne-test.js +45 -0
- data/vendor/assets/javascripts/d3/plugins/geo/projection/test/craig-test.js +25 -0
- data/vendor/assets/javascripts/d3/plugins/geo/projection/test/craster-test.js +25 -0
- data/vendor/assets/javascripts/d3/plugins/geo/projection/test/env.js +32 -0
- data/vendor/assets/javascripts/d3/plugins/geo/projection/test/equirectangular-test.js +97 -0
- data/vendor/assets/javascripts/d3/plugins/geo/projection/test/hammer-test.js +29 -0
- data/vendor/assets/javascripts/d3/plugins/geo/projection/test/hatano-test.js +25 -0
- data/vendor/assets/javascripts/d3/plugins/geo/projection/test/hill-test.js +26 -0
- data/vendor/assets/javascripts/d3/plugins/geo/projection/test/larrivee-test.js +25 -0
- data/vendor/assets/javascripts/d3/plugins/geo/projection/test/laskowski-test.js +26 -0
- data/vendor/assets/javascripts/d3/plugins/geo/projection/test/littrow-test.js +24 -0
- data/vendor/assets/javascripts/d3/plugins/geo/projection/test/loximuthal-test.js +25 -0
- data/vendor/assets/javascripts/d3/plugins/geo/projection/test/mollweide-test.js +26 -0
- data/vendor/assets/javascripts/d3/plugins/geo/projection/test/mt-flat-polar-parabolic-test.js +25 -0
- data/vendor/assets/javascripts/d3/plugins/geo/projection/test/mt-flat-polar-quartic-test.js +25 -0
- data/vendor/assets/javascripts/d3/plugins/geo/projection/test/mt-flat-polar-sinusoidal-test.js +25 -0
- data/vendor/assets/javascripts/d3/plugins/geo/projection/test/natural-earth-test.js +26 -0
- data/vendor/assets/javascripts/d3/plugins/geo/projection/test/quartic-authalic-test.js +0 -0
- data/vendor/assets/javascripts/d3/plugins/geo/projection/test/robinson-test.js +26 -0
- data/vendor/assets/javascripts/d3/plugins/geo/projection/test/wagner6-test.js +25 -0
- data/vendor/assets/javascripts/d3/plugins/geo/projection/test/winkel3-test.js +26 -0
- data/vendor/assets/javascripts/d3/plugins/geo/projection/van-der-grinten.js +41 -0
- data/vendor/assets/javascripts/d3/plugins/geo/projection/van-der-grinten4.js +22 -0
- data/vendor/assets/javascripts/d3/plugins/geo/projection/wagner4.js +9 -0
- data/vendor/assets/javascripts/d3/plugins/geo/projection/wagner6.js +15 -0
- data/vendor/assets/javascripts/d3/plugins/geo/projection/wagner7.js +22 -0
- data/vendor/assets/javascripts/d3/plugins/geo/projection/wiechel.js +14 -0
- data/vendor/assets/javascripts/d3/plugins/geo/projection/winkel3.js +40 -0
- data/vendor/assets/javascripts/d3/plugins/geo/tile/README.md +6 -0
- data/vendor/assets/javascripts/d3/plugins/geo/tile/tile.js +53 -0
- data/vendor/assets/javascripts/d3/plugins/geodesic/README.md +3 -0
- data/vendor/assets/javascripts/d3/plugins/geodesic/geodesic.js +130 -0
- data/vendor/assets/javascripts/d3/plugins/geom/contour/README.md +5 -0
- data/vendor/assets/javascripts/d3/plugins/geom/contour/contour.js +72 -0
- data/vendor/assets/javascripts/d3/plugins/graph/README.md +148 -0
- data/vendor/assets/javascripts/d3/plugins/graph/data/cities-matrix.json +37 -0
- data/vendor/assets/javascripts/d3/plugins/graph/data/cities.csv +36 -0
- data/vendor/assets/javascripts/d3/plugins/graph/data/miserables.json +338 -0
- data/vendor/assets/javascripts/d3/plugins/graph/graph.js +161 -0
- data/vendor/assets/javascripts/d3/plugins/graph/index.html +37 -0
- data/vendor/assets/javascripts/d3/plugins/hexbin/README.md +58 -0
- data/vendor/assets/javascripts/d3/plugins/hexbin/hexbin.js +96 -0
- data/vendor/assets/javascripts/d3/plugins/hive/README.md +5 -0
- data/vendor/assets/javascripts/d3/plugins/hive/hive.js +80 -0
- data/vendor/assets/javascripts/d3/plugins/horizon/README.md +11 -0
- data/vendor/assets/javascripts/d3/plugins/horizon/horizon.js +192 -0
- data/vendor/assets/javascripts/d3/plugins/interpolate-zoom/README.md +11 -0
- data/vendor/assets/javascripts/d3/plugins/interpolate-zoom/interpolate-zoom.js +75 -0
- data/vendor/assets/javascripts/d3/plugins/jsonp/README.md +26 -0
- data/vendor/assets/javascripts/d3/plugins/jsonp/jsonp.js +25 -0
- data/vendor/assets/javascripts/d3/plugins/keybinding/README.md +17 -0
- data/vendor/assets/javascripts/d3/plugins/keybinding/keybinding.js +120 -0
- data/vendor/assets/javascripts/d3/plugins/longscroll/README.md +10 -0
- data/vendor/assets/javascripts/d3/plugins/longscroll/longscroll.js +75 -0
- data/vendor/assets/javascripts/d3/plugins/package.json +20 -0
- data/vendor/assets/javascripts/d3/plugins/qq/README.md +3 -0
- data/vendor/assets/javascripts/d3/plugins/qq/qq.js +249 -0
- data/vendor/assets/javascripts/d3/plugins/rollup/README.md +5 -0
- data/vendor/assets/javascripts/d3/plugins/rollup/rollup.js +131 -0
- data/vendor/assets/javascripts/d3/plugins/sankey/README.md +17 -0
- data/vendor/assets/javascripts/d3/plugins/sankey/sankey.js +292 -0
- data/vendor/assets/javascripts/d3/plugins/simplify/README.md +6 -0
- data/vendor/assets/javascripts/d3/plugins/simplify/simplify-test.js +193 -0
- data/vendor/assets/javascripts/d3/plugins/simplify/simplify.js +446 -0
- data/vendor/assets/javascripts/d3/plugins/superformula/superformula.js +98 -0
- data/vendor/assets/javascripts/d3/plugins/urlencode/urlencode-test.js +68 -0
- data/vendor/assets/javascripts/d3/plugins/urlencode/urlencode.js +37 -0
- metadata +218 -0
|
@@ -0,0 +1,37 @@
|
|
|
1
|
+
<script src="http://mbostock.github.com/d3/d3.v2.js"></script>
|
|
2
|
+
<script src="graph.js"></script>
|
|
3
|
+
<script>
|
|
4
|
+
var g = d3.graph();
|
|
5
|
+
|
|
6
|
+
g.nodes(['red', 'purple', 'orange']);
|
|
7
|
+
g.matrix([
|
|
8
|
+
[0,1,0],
|
|
9
|
+
[1,0,0],
|
|
10
|
+
[1,1,1]
|
|
11
|
+
]);
|
|
12
|
+
|
|
13
|
+
console.log('matrix to list', d3.graph.matrixToList([
|
|
14
|
+
[0,1,0],
|
|
15
|
+
[1,0,0],
|
|
16
|
+
[1,1,1]
|
|
17
|
+
]));
|
|
18
|
+
|
|
19
|
+
console.log('list to matrix', d3.graph.listToMatrix([
|
|
20
|
+
{"source":0,"target":1,"value":1},
|
|
21
|
+
{"source":1,"target":0,"value":1},
|
|
22
|
+
{"source":2,"target":0,"value":1},
|
|
23
|
+
{"source":2,"target":1,"value":1},
|
|
24
|
+
{"source":2,"target":2,"value":1}
|
|
25
|
+
]));
|
|
26
|
+
|
|
27
|
+
console.log('nodes', g.nodes() );
|
|
28
|
+
console.log('links', g.links() );
|
|
29
|
+
console.log('matrix', g.matrix() );
|
|
30
|
+
console.log('traversal', g.traverse().filter(function(d) { return d.indexOf('urp') > -1 }).value());
|
|
31
|
+
|
|
32
|
+
var m = d3.graph.matrix([
|
|
33
|
+
[1,1,0],
|
|
34
|
+
[0,0,0],
|
|
35
|
+
[2,1,1]
|
|
36
|
+
]);
|
|
37
|
+
</script>
|
|
@@ -0,0 +1,58 @@
|
|
|
1
|
+
# Hexagonal Binning
|
|
2
|
+
|
|
3
|
+
Examples:
|
|
4
|
+
|
|
5
|
+
* Color encoding: <http://bl.ocks.org/4248145>
|
|
6
|
+
* Area encoding: <http://bl.ocks.org/4248146>
|
|
7
|
+
|
|
8
|
+
The **d3.hexbin** plugin implements **hexagonal binning**, which is useful for aggregating data into a more coarse representation suitable for display. Rather than displaying a scatterplot with tens of thousands of points, you can bin points into gridded hexagons, and then display the distribution using color or area. This plugin was inspired by earlier work by [Zachary Forest Johnson](http://indiemaps.com/blog/2011/10/hexbins/).
|
|
9
|
+
|
|
10
|
+
<a name="hexbin" href="#hexbin">#</a> d3.<b>hexbin</b>()
|
|
11
|
+
|
|
12
|
+
Constructs a new default hexbin layout.
|
|
13
|
+
|
|
14
|
+
<a name="_hexbin" href="#_hexbin">#</a> <b>hexbin</b>(<i>points</i>)
|
|
15
|
+
|
|
16
|
+
Evaluates the hexbin layout on the specified array of *points*, returning an array of hexagonal *bins*. Each bin is an array containing the bin’s points, as well as some additional properties:
|
|
17
|
+
|
|
18
|
+
* x - the x-coordinate of the center of the associated bin’s hexagon
|
|
19
|
+
* y - the y-coordinate of the center of the associated bin’s hexagon
|
|
20
|
+
|
|
21
|
+
Bins that are empty are not omitted. The origin bin at ⟨0,0⟩ is in the top-left. The returned bins are designed to work with the layouts point and hexagon methods.
|
|
22
|
+
|
|
23
|
+
<a href="size" href="#size">#</a> hexbin.<b>size</b>([<i>size</i>])
|
|
24
|
+
|
|
25
|
+
If *size* is specified, sets the available layout size to the specified two-element array of numbers representing *x* and *y*. If *size* is not specified, returns the current size, which defaults to 1×1.
|
|
26
|
+
|
|
27
|
+
<a href="radius" href="#radius">#</a> hexbin.<b>radius</b>([<i>radius</i>])
|
|
28
|
+
|
|
29
|
+
If *radius* is specified, sets the hexagon radius to the specified numeric value. If *radius* is not specified, returns the current radius, which defaults to 1.
|
|
30
|
+
|
|
31
|
+
<a name="x" href="#x">#</a> hexbin.<b>x</b>([<i>accessor</i>])
|
|
32
|
+
|
|
33
|
+
Sets or gets the *x*-accessor function for the hexbin layout. If *accessor* is specified, sets the *x*-accessor function and returns the hexbin layout; if *accessor* is not specified, returns the current *x*-accessor function, which defaults to `function(d) { return d[0]; }`.
|
|
34
|
+
|
|
35
|
+
<a name="y" href="#y">#</a> hexbin.<b>y</b>([<i>accessor</i>])
|
|
36
|
+
|
|
37
|
+
Sets or gets the *y*-accessor function for the hexbin layout. If *accessor* is specified, sets the *y*-accessor function and returns the hexbin layout; if *accessor* is not specified, returns the current *y*-accessor function, which defaults to `function(d) { return d[1]; }`.
|
|
38
|
+
|
|
39
|
+
<a href="hexagon" href="#hexagon">#</a> hexbin.<b>hexagon</b>([<i>radius</i>])
|
|
40
|
+
|
|
41
|
+
Returns the SVG path string for the hexagon centered at the origin ⟨0,0⟩. The path string is defined with relative coordinates such that you can easily translate the hexagon to the desired position. For example:
|
|
42
|
+
|
|
43
|
+
```js
|
|
44
|
+
path.attr("d", function(d) { return "M" + d.x + "," + d.y + hexbin.hexagon(); });
|
|
45
|
+
```
|
|
46
|
+
|
|
47
|
+
Alternatively, use a transform attribute:
|
|
48
|
+
|
|
49
|
+
```js
|
|
50
|
+
path.attr("transform", function(d) { return "translate(" + d.x + "," + d.y + ")"; })
|
|
51
|
+
.attr("d", hexbin.hexagon);
|
|
52
|
+
```
|
|
53
|
+
|
|
54
|
+
If *radius* is not specified, the hexbin’s current radius is used. If *radius* is specified, a hexagon with the specified radius is returned, which is useful for area-encoded bivariate hexbins.
|
|
55
|
+
|
|
56
|
+
<a href="mesh" href="#mesh">#</a> hexbin.<b>mesh</b>()
|
|
57
|
+
|
|
58
|
+
Returns the SVG path string for a hexagonal mesh that covers the area of the layout (as determined by the layout size). The returned mesh is designed to be stroked. The mesh may extend slightly beyond the layout’s defined area, and thus may need to be clipped.
|
|
@@ -0,0 +1,96 @@
|
|
|
1
|
+
(function() {
|
|
2
|
+
|
|
3
|
+
d3.hexbin = function() {
|
|
4
|
+
var width = 1,
|
|
5
|
+
height = 1,
|
|
6
|
+
r,
|
|
7
|
+
x = d3_hexbinX,
|
|
8
|
+
y = d3_hexbinY,
|
|
9
|
+
dx,
|
|
10
|
+
dy;
|
|
11
|
+
|
|
12
|
+
function hexbin(points) {
|
|
13
|
+
var binsById = {};
|
|
14
|
+
|
|
15
|
+
points.forEach(function(point, i) {
|
|
16
|
+
var py = y.call(hexbin, point, i) / dy, pj = Math.round(py),
|
|
17
|
+
px = x.call(hexbin, point, i) / dx - (pj & 1 ? .5 : 0), pi = Math.round(px),
|
|
18
|
+
py1 = py - pj;
|
|
19
|
+
|
|
20
|
+
if (Math.abs(py1) * 3 > 1) {
|
|
21
|
+
var px1 = px - pi,
|
|
22
|
+
pi2 = pi + (px < pi ? -1 : 1) / 2,
|
|
23
|
+
pj2 = pj + (py < pj ? -1 : 1),
|
|
24
|
+
px2 = px - pi2,
|
|
25
|
+
py2 = py - pj2;
|
|
26
|
+
if (px1 * px1 + py1 * py1 > px2 * px2 + py2 * py2) pi = pi2 + (pj & 1 ? 1 : -1) / 2, pj = pj2;
|
|
27
|
+
}
|
|
28
|
+
|
|
29
|
+
var id = pi + "-" + pj, bin = binsById[id];
|
|
30
|
+
if (bin) bin.push(point); else {
|
|
31
|
+
bin = binsById[id] = [point];
|
|
32
|
+
bin.x = (pi + (pj & 1 ? 1 / 2 : 0)) * dx;
|
|
33
|
+
bin.y = pj * dy;
|
|
34
|
+
}
|
|
35
|
+
});
|
|
36
|
+
|
|
37
|
+
return d3.values(binsById);
|
|
38
|
+
}
|
|
39
|
+
|
|
40
|
+
hexbin.x = function(_) {
|
|
41
|
+
if (!arguments.length) return x;
|
|
42
|
+
x = _;
|
|
43
|
+
return hexbin;
|
|
44
|
+
};
|
|
45
|
+
|
|
46
|
+
hexbin.y = function(_) {
|
|
47
|
+
if (!arguments.length) return y;
|
|
48
|
+
y = _;
|
|
49
|
+
return hexbin;
|
|
50
|
+
};
|
|
51
|
+
|
|
52
|
+
hexbin.hexagon = function(radius) {
|
|
53
|
+
var x0 = 0, y0 = 0;
|
|
54
|
+
if (arguments.length < 1) radius = r;
|
|
55
|
+
return "m" + d3_hexbinAngles.map(function(angle) {
|
|
56
|
+
var x1 = Math.sin(angle) * radius,
|
|
57
|
+
y1 = -Math.cos(angle) * radius,
|
|
58
|
+
dx = x1 - x0,
|
|
59
|
+
dy = y1 - y0;
|
|
60
|
+
x0 = x1, y0 = y1;
|
|
61
|
+
return [dx, dy];
|
|
62
|
+
}).join("l") + "z";
|
|
63
|
+
};
|
|
64
|
+
|
|
65
|
+
hexbin.mesh = function() {
|
|
66
|
+
var path = [], mesh = hexbin.hexagon().slice(0, 4).join("l");
|
|
67
|
+
for (var y = 0, odd = false; y < height + r; y += dy, odd = !odd) {
|
|
68
|
+
for (var x = odd ? dx / 2 : 0; x < width; x += dx) {
|
|
69
|
+
path.push("M", x, ",", y, "m", mesh);
|
|
70
|
+
}
|
|
71
|
+
}
|
|
72
|
+
return path.join("");
|
|
73
|
+
};
|
|
74
|
+
|
|
75
|
+
hexbin.size = function(_) {
|
|
76
|
+
if (!arguments.length) return [width, height];
|
|
77
|
+
width = +_[0], height = +_[1];
|
|
78
|
+
return hexbin;
|
|
79
|
+
};
|
|
80
|
+
|
|
81
|
+
hexbin.radius = function(_) {
|
|
82
|
+
if (!arguments.length) return r;
|
|
83
|
+
r = +_;
|
|
84
|
+
dx = r * 2 * Math.sin(Math.PI / 3);
|
|
85
|
+
dy = r * 1.5;
|
|
86
|
+
return hexbin;
|
|
87
|
+
};
|
|
88
|
+
|
|
89
|
+
return hexbin.radius(1);
|
|
90
|
+
};
|
|
91
|
+
|
|
92
|
+
var d3_hexbinAngles = d3.range(0, 2 * Math.PI, Math.PI / 3),
|
|
93
|
+
d3_hexbinX = function(d) { return d[0]; },
|
|
94
|
+
d3_hexbinY = function(d) { return d[1]; };
|
|
95
|
+
|
|
96
|
+
})();
|
|
@@ -0,0 +1,80 @@
|
|
|
1
|
+
d3.hive = {};
|
|
2
|
+
|
|
3
|
+
d3.hive.link = function() {
|
|
4
|
+
var source = function(d) { return d.source; },
|
|
5
|
+
target = function(d) { return d.target; },
|
|
6
|
+
angle = function(d) { return d.angle; },
|
|
7
|
+
startRadius = function(d) { return d.radius; },
|
|
8
|
+
endRadius = startRadius,
|
|
9
|
+
arcOffset = -Math.PI / 2;
|
|
10
|
+
|
|
11
|
+
function link(d, i) {
|
|
12
|
+
var s = node(source, this, d, i),
|
|
13
|
+
t = node(target, this, d, i),
|
|
14
|
+
x;
|
|
15
|
+
if (t.a < s.a) x = t, t = s, s = x;
|
|
16
|
+
if (t.a - s.a > Math.PI) s.a += 2 * Math.PI;
|
|
17
|
+
var a1 = s.a + (t.a - s.a) / 3,
|
|
18
|
+
a2 = t.a - (t.a - s.a) / 3;
|
|
19
|
+
return s.r0 - s.r1 || t.r0 - t.r1
|
|
20
|
+
? "M" + Math.cos(s.a) * s.r0 + "," + Math.sin(s.a) * s.r0
|
|
21
|
+
+ "L" + Math.cos(s.a) * s.r1 + "," + Math.sin(s.a) * s.r1
|
|
22
|
+
+ "C" + Math.cos(a1) * s.r1 + "," + Math.sin(a1) * s.r1
|
|
23
|
+
+ " " + Math.cos(a2) * t.r1 + "," + Math.sin(a2) * t.r1
|
|
24
|
+
+ " " + Math.cos(t.a) * t.r1 + "," + Math.sin(t.a) * t.r1
|
|
25
|
+
+ "L" + Math.cos(t.a) * t.r0 + "," + Math.sin(t.a) * t.r0
|
|
26
|
+
+ "C" + Math.cos(a2) * t.r0 + "," + Math.sin(a2) * t.r0
|
|
27
|
+
+ " " + Math.cos(a1) * s.r0 + "," + Math.sin(a1) * s.r0
|
|
28
|
+
+ " " + Math.cos(s.a) * s.r0 + "," + Math.sin(s.a) * s.r0
|
|
29
|
+
: "M" + Math.cos(s.a) * s.r0 + "," + Math.sin(s.a) * s.r0
|
|
30
|
+
+ "C" + Math.cos(a1) * s.r1 + "," + Math.sin(a1) * s.r1
|
|
31
|
+
+ " " + Math.cos(a2) * t.r1 + "," + Math.sin(a2) * t.r1
|
|
32
|
+
+ " " + Math.cos(t.a) * t.r1 + "," + Math.sin(t.a) * t.r1;
|
|
33
|
+
}
|
|
34
|
+
|
|
35
|
+
function node(method, thiz, d, i) {
|
|
36
|
+
var node = method.call(thiz, d, i),
|
|
37
|
+
a = +(typeof angle === "function" ? angle.call(thiz, node, i) : angle) + arcOffset,
|
|
38
|
+
r0 = +(typeof startRadius === "function" ? startRadius.call(thiz, node, i) : startRadius),
|
|
39
|
+
r1 = (startRadius === endRadius ? r0 : +(typeof endRadius === "function" ? endRadius.call(thiz, node, i) : endRadius));
|
|
40
|
+
return {r0: r0, r1: r1, a: a};
|
|
41
|
+
}
|
|
42
|
+
|
|
43
|
+
link.source = function(_) {
|
|
44
|
+
if (!arguments.length) return source;
|
|
45
|
+
source = _;
|
|
46
|
+
return link;
|
|
47
|
+
};
|
|
48
|
+
|
|
49
|
+
link.target = function(_) {
|
|
50
|
+
if (!arguments.length) return target;
|
|
51
|
+
target = _;
|
|
52
|
+
return link;
|
|
53
|
+
};
|
|
54
|
+
|
|
55
|
+
link.angle = function(_) {
|
|
56
|
+
if (!arguments.length) return angle;
|
|
57
|
+
angle = _;
|
|
58
|
+
return link;
|
|
59
|
+
};
|
|
60
|
+
|
|
61
|
+
link.radius = function(_) {
|
|
62
|
+
if (!arguments.length) return startRadius;
|
|
63
|
+
startRadius = endRadius = _;
|
|
64
|
+
return link;
|
|
65
|
+
};
|
|
66
|
+
|
|
67
|
+
link.startRadius = function(_) {
|
|
68
|
+
if (!arguments.length) return startRadius;
|
|
69
|
+
startRadius = _;
|
|
70
|
+
return link;
|
|
71
|
+
};
|
|
72
|
+
|
|
73
|
+
link.endRadius = function(_) {
|
|
74
|
+
if (!arguments.length) return endRadius;
|
|
75
|
+
endRadius = _;
|
|
76
|
+
return link;
|
|
77
|
+
};
|
|
78
|
+
|
|
79
|
+
return link;
|
|
80
|
+
};
|
|
@@ -0,0 +1,11 @@
|
|
|
1
|
+
# d3.horizon
|
|
2
|
+
|
|
3
|
+
Demo: <http://bl.ocks.org/1483226>
|
|
4
|
+
|
|
5
|
+
|
|
6
|
+
|
|
7
|
+
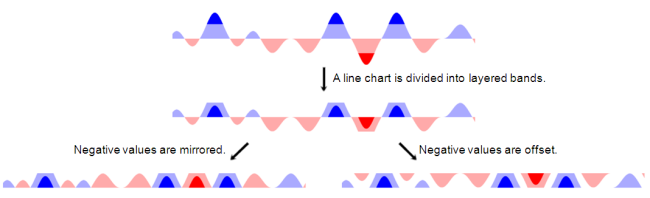
A horizon chart is a variation of a single-series area chart where the area is folded into multiple bands. Color is used to encode bands, allowing the size of the chart to be reduced significantly without impeding readability.
|
|
8
|
+
|
|
9
|
+
This layout algorithm is based on the work of J. Heer, N. Kong and M. Agrawala in "Sizing the Horizon: The Effects of Chart Size and Layering on the Graphical Perception of Time Series Visualizations", CHI 2009.
|
|
10
|
+
|
|
11
|
+
<http://hci.stanford.edu/publications/2009/heer-horizon-chi09.pdf>
|
|
@@ -0,0 +1,192 @@
|
|
|
1
|
+
(function() {
|
|
2
|
+
d3.horizon = function() {
|
|
3
|
+
var bands = 1, // between 1 and 5, typically
|
|
4
|
+
mode = "offset", // or mirror
|
|
5
|
+
interpolate = "linear", // or basis, monotone, step-before, etc.
|
|
6
|
+
x = d3_horizonX,
|
|
7
|
+
y = d3_horizonY,
|
|
8
|
+
w = 960,
|
|
9
|
+
h = 40,
|
|
10
|
+
duration = 0;
|
|
11
|
+
|
|
12
|
+
var color = d3.scale.linear()
|
|
13
|
+
.domain([-1, 0, 1])
|
|
14
|
+
.range(["#d62728", "#fff", "#1f77b4"]);
|
|
15
|
+
|
|
16
|
+
// For each small multiple…
|
|
17
|
+
function horizon(g) {
|
|
18
|
+
g.each(function(d) {
|
|
19
|
+
var g = d3.select(this),
|
|
20
|
+
xMin = Infinity,
|
|
21
|
+
xMax = -Infinity,
|
|
22
|
+
yMax = -Infinity,
|
|
23
|
+
x0, // old x-scale
|
|
24
|
+
y0, // old y-scale
|
|
25
|
+
t0,
|
|
26
|
+
id; // unique id for paths
|
|
27
|
+
|
|
28
|
+
// Compute x- and y-values along with extents.
|
|
29
|
+
var data = d.map(function(d, i) {
|
|
30
|
+
var xv = x.call(this, d, i),
|
|
31
|
+
yv = y.call(this, d, i);
|
|
32
|
+
if (xv < xMin) xMin = xv;
|
|
33
|
+
if (xv > xMax) xMax = xv;
|
|
34
|
+
if (-yv > yMax) yMax = -yv;
|
|
35
|
+
if (yv > yMax) yMax = yv;
|
|
36
|
+
return [xv, yv];
|
|
37
|
+
});
|
|
38
|
+
|
|
39
|
+
// Compute the new x- and y-scales, and transform.
|
|
40
|
+
var x1 = d3.scale.linear().domain([xMin, xMax]).range([0, w]),
|
|
41
|
+
y1 = d3.scale.linear().domain([0, yMax]).range([0, h * bands]),
|
|
42
|
+
t1 = d3_horizonTransform(bands, h, mode);
|
|
43
|
+
|
|
44
|
+
// Retrieve the old scales, if this is an update.
|
|
45
|
+
if (this.__chart__) {
|
|
46
|
+
x0 = this.__chart__.x;
|
|
47
|
+
y0 = this.__chart__.y;
|
|
48
|
+
t0 = this.__chart__.t;
|
|
49
|
+
id = this.__chart__.id;
|
|
50
|
+
} else {
|
|
51
|
+
x0 = x1.copy();
|
|
52
|
+
y0 = y1.copy();
|
|
53
|
+
t0 = t1;
|
|
54
|
+
id = ++d3_horizonId;
|
|
55
|
+
}
|
|
56
|
+
|
|
57
|
+
// We'll use a defs to store the area path and the clip path.
|
|
58
|
+
var defs = g.selectAll("defs")
|
|
59
|
+
.data([null]);
|
|
60
|
+
|
|
61
|
+
// The clip path is a simple rect.
|
|
62
|
+
defs.enter().append("defs").append("clipPath")
|
|
63
|
+
.attr("id", "d3_horizon_clip" + id)
|
|
64
|
+
.append("rect")
|
|
65
|
+
.attr("width", w)
|
|
66
|
+
.attr("height", h);
|
|
67
|
+
|
|
68
|
+
defs.select("rect").transition()
|
|
69
|
+
.duration(duration)
|
|
70
|
+
.attr("width", w)
|
|
71
|
+
.attr("height", h);
|
|
72
|
+
|
|
73
|
+
// We'll use a container to clip all horizon layers at once.
|
|
74
|
+
g.selectAll("g")
|
|
75
|
+
.data([null])
|
|
76
|
+
.enter().append("g")
|
|
77
|
+
.attr("clip-path", "url(#d3_horizon_clip" + id + ")");
|
|
78
|
+
|
|
79
|
+
// Instantiate each copy of the path with different transforms.
|
|
80
|
+
var path = g.select("g").selectAll("path")
|
|
81
|
+
.data(d3.range(-1, -bands - 1, -1).concat(d3.range(1, bands + 1)), Number);
|
|
82
|
+
|
|
83
|
+
var d0 = d3_horizonArea
|
|
84
|
+
.interpolate(interpolate)
|
|
85
|
+
.x(function(d) { return x0(d[0]); })
|
|
86
|
+
.y0(h * bands)
|
|
87
|
+
.y1(function(d) { return h * bands - y0(d[1]); })
|
|
88
|
+
(data);
|
|
89
|
+
|
|
90
|
+
var d1 = d3_horizonArea
|
|
91
|
+
.x(function(d) { return x1(d[0]); })
|
|
92
|
+
.y1(function(d) { return h * bands - y1(d[1]); })
|
|
93
|
+
(data);
|
|
94
|
+
|
|
95
|
+
path.enter().append("path")
|
|
96
|
+
.style("fill", color)
|
|
97
|
+
.attr("transform", t0)
|
|
98
|
+
.attr("d", d0);
|
|
99
|
+
|
|
100
|
+
path.transition()
|
|
101
|
+
.duration(duration)
|
|
102
|
+
.style("fill", color)
|
|
103
|
+
.attr("transform", t1)
|
|
104
|
+
.attr("d", d1);
|
|
105
|
+
|
|
106
|
+
path.exit().transition()
|
|
107
|
+
.duration(duration)
|
|
108
|
+
.attr("transform", t1)
|
|
109
|
+
.attr("d", d1)
|
|
110
|
+
.remove();
|
|
111
|
+
|
|
112
|
+
// Stash the new scales.
|
|
113
|
+
this.__chart__ = {x: x1, y: y1, t: t1, id: id};
|
|
114
|
+
});
|
|
115
|
+
d3.timer.flush();
|
|
116
|
+
}
|
|
117
|
+
|
|
118
|
+
horizon.duration = function(x) {
|
|
119
|
+
if (!arguments.length) return duration;
|
|
120
|
+
duration = +x;
|
|
121
|
+
return horizon;
|
|
122
|
+
};
|
|
123
|
+
|
|
124
|
+
horizon.bands = function(x) {
|
|
125
|
+
if (!arguments.length) return bands;
|
|
126
|
+
bands = +x;
|
|
127
|
+
color.domain([-bands, 0, bands]);
|
|
128
|
+
return horizon;
|
|
129
|
+
};
|
|
130
|
+
|
|
131
|
+
horizon.mode = function(x) {
|
|
132
|
+
if (!arguments.length) return mode;
|
|
133
|
+
mode = x + "";
|
|
134
|
+
return horizon;
|
|
135
|
+
};
|
|
136
|
+
|
|
137
|
+
horizon.colors = function(x) {
|
|
138
|
+
if (!arguments.length) return color.range();
|
|
139
|
+
color.range(x);
|
|
140
|
+
return horizon;
|
|
141
|
+
};
|
|
142
|
+
|
|
143
|
+
horizon.interpolate = function(x) {
|
|
144
|
+
if (!arguments.length) return interpolate;
|
|
145
|
+
interpolate = x + "";
|
|
146
|
+
return horizon;
|
|
147
|
+
};
|
|
148
|
+
|
|
149
|
+
horizon.x = function(z) {
|
|
150
|
+
if (!arguments.length) return x;
|
|
151
|
+
x = z;
|
|
152
|
+
return horizon;
|
|
153
|
+
};
|
|
154
|
+
|
|
155
|
+
horizon.y = function(z) {
|
|
156
|
+
if (!arguments.length) return y;
|
|
157
|
+
y = z;
|
|
158
|
+
return horizon;
|
|
159
|
+
};
|
|
160
|
+
|
|
161
|
+
horizon.width = function(x) {
|
|
162
|
+
if (!arguments.length) return w;
|
|
163
|
+
w = +x;
|
|
164
|
+
return horizon;
|
|
165
|
+
};
|
|
166
|
+
|
|
167
|
+
horizon.height = function(x) {
|
|
168
|
+
if (!arguments.length) return h;
|
|
169
|
+
h = +x;
|
|
170
|
+
return horizon;
|
|
171
|
+
};
|
|
172
|
+
|
|
173
|
+
return horizon;
|
|
174
|
+
};
|
|
175
|
+
|
|
176
|
+
var d3_horizonArea = d3.svg.area(),
|
|
177
|
+
d3_horizonId = 0;
|
|
178
|
+
|
|
179
|
+
function d3_horizonX(d) {
|
|
180
|
+
return d[0];
|
|
181
|
+
}
|
|
182
|
+
|
|
183
|
+
function d3_horizonY(d) {
|
|
184
|
+
return d[1];
|
|
185
|
+
}
|
|
186
|
+
|
|
187
|
+
function d3_horizonTransform(bands, h, mode) {
|
|
188
|
+
return mode == "offset"
|
|
189
|
+
? function(d) { return "translate(0," + (d + (d < 0) - bands) * h + ")"; }
|
|
190
|
+
: function(d) { return (d < 0 ? "scale(1,-1)" : "") + "translate(0," + (d - bands) * h + ")"; };
|
|
191
|
+
}
|
|
192
|
+
})();
|