charty 0.1.3.dev → 0.1.4.dev
This diff represents the content of publicly available package versions that have been released to one of the supported registries. The information contained in this diff is provided for informational purposes only and reflects changes between package versions as they appear in their respective public registries.
- checksums.yaml +4 -4
- data/.travis.yml +11 -0
- data/Dockerfile.dev +2 -0
- data/README.md +53 -37
- data/Rakefile +9 -1
- data/charty.gemspec +3 -1
- data/examples/active_record.ipynb +1 -1
- data/examples/daru.ipynb +1 -1
- data/examples/iris_dataset.ipynb +1 -1
- data/examples/nmatrix.ipynb +1 -1
- data/examples/numo-narray.ipynb +1 -1
- data/examples/sample_google_chart.ipynb +265 -0
- data/examples/sample_images/{bar_matplot.png → bar_pyplot.png} +0 -0
- data/examples/sample_images/{barh_matplot.png → barh_pyplot.png} +0 -0
- data/examples/sample_images/{boxplot_matplot.png → boxplot_pyplot.png} +0 -0
- data/examples/sample_images/{bubble_matplot.png → bubble_pyplot.png} +0 -0
- data/examples/sample_images/{curve_matplot.png → curve_pyplot.png} +0 -0
- data/examples/sample_images/{curve_with_function_matplot.png → curve_with_function_pyplot.png} +0 -0
- data/examples/sample_images/{errorbar_matplot.png → errorbar_pyplot.png} +0 -0
- data/examples/sample_images/{hist_matplot.png → hist_pyplot.png} +0 -0
- data/examples/sample_images/{scatter_matplot.png → scatter_pyplot.png} +0 -0
- data/examples/sample_images/{subplot2_matplot.png → subplot2_pyplot.png} +0 -0
- data/examples/sample_images/{subplot_matplot.png → subplot_pyplot.png} +0 -0
- data/examples/{sample_matplotlib.ipynb → sample_pyplot.ipynb} +12 -12
- data/lib/charty.rb +1 -0
- data/lib/charty/backends/google_chart.rb +167 -0
- data/lib/charty/{gruff.rb → backends/gruff.rb} +3 -1
- data/lib/charty/{matplot.rb → backends/pyplot.rb} +7 -3
- data/lib/charty/{rubyplot.rb → backends/rubyplot.rb} +3 -1
- data/lib/charty/plotter.rb +15 -30
- data/lib/charty/plotter_adapter.rb +17 -0
- data/lib/charty/version.rb +1 -1
- metadata +54 -21
checksums.yaml
CHANGED
|
@@ -1,7 +1,7 @@
|
|
|
1
1
|
---
|
|
2
2
|
SHA256:
|
|
3
|
-
metadata.gz:
|
|
4
|
-
data.tar.gz:
|
|
3
|
+
metadata.gz: ac0ecbfb31a75423c412a90df4e17bb155485a0cec9cc9cea06b93d92759ae57
|
|
4
|
+
data.tar.gz: 75010b133927cfc7e7a028b3b0abf9424aa1138b268712375a76a2cd1c5149bf
|
|
5
5
|
SHA512:
|
|
6
|
-
metadata.gz:
|
|
7
|
-
data.tar.gz:
|
|
6
|
+
metadata.gz: 2c2d710b65fccbf44338f3f42780130ad55ecff5a86a908664bfa448438d77ecd78e493b1c3a3d4ab30e53b2b4125096cf5784bf77d0df6cde2a11454efbde29
|
|
7
|
+
data.tar.gz: bed880d3aee1c5d6bd16b2ab30d4ea877cf4ede53609d100703042aefc6f2376adb0df188fb8f11a648ed6343f8c434664c715dd9b08b1a7b57693715995ce36
|
data/.travis.yml
ADDED
data/Dockerfile.dev
ADDED
data/README.md
CHANGED
|
@@ -1,5 +1,6 @@
|
|
|
1
1
|
# Charty - Visualizing your data in Ruby
|
|
2
2
|
|
|
3
|
+
[](https://travis-ci.org/red-data-tools/charty)
|
|
3
4
|
[](https://mybinder.org/v2/gh/red-data-tools/charty/master?filepath=iris_dataset.ipynb)
|
|
4
5
|
|
|
5
6
|
Charty is open-source Ruby library for visualizing your data in a simple way.
|
|
@@ -37,11 +38,26 @@ sudo apt install python3-pip
|
|
|
37
38
|
sudo python3 -m pip install -U pip matplotlib
|
|
38
39
|
```
|
|
39
40
|
|
|
41
|
+
## Development with Docker
|
|
42
|
+
|
|
43
|
+
e.g.
|
|
44
|
+
|
|
45
|
+
```
|
|
46
|
+
$ bundle install
|
|
47
|
+
$ docker build -f ./Dockerfile.dev -t charty-dev:0.1 .
|
|
48
|
+
$ docker run -it -v ${PWD}:/charty -w /charty charty-dev:0.1 ./bin/console
|
|
49
|
+
irb(main):001:0> Charty::VERSION
|
|
50
|
+
=> "0.1.4-dev"
|
|
51
|
+
|
|
52
|
+
# When using jupyter notebook
|
|
53
|
+
$ docker run -it -v ${PWD}:/charty -w /charty -p 8888:8888 charty-dev:0.1
|
|
54
|
+
```
|
|
55
|
+
|
|
40
56
|
## Usage
|
|
41
57
|
|
|
42
58
|
```ruby
|
|
43
59
|
require 'charty'
|
|
44
|
-
charty = Charty.new(:
|
|
60
|
+
charty = Charty::Plotter.new(:pyplot)
|
|
45
61
|
|
|
46
62
|
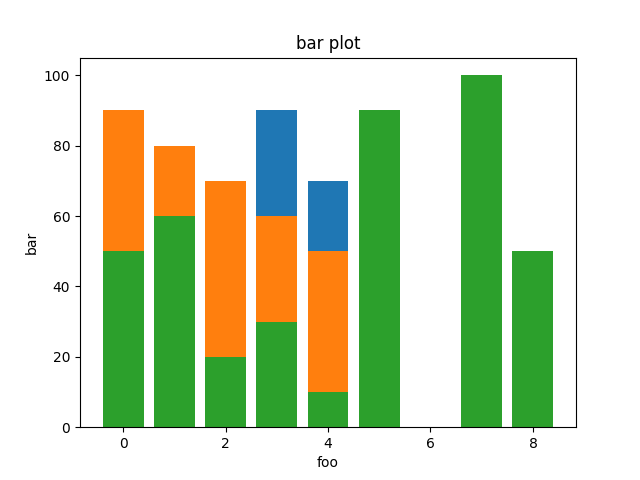
bar = charty.bar do
|
|
47
63
|
series [0,1,2,3,4], [10,40,20,90,70], label: "sample1"
|
|
@@ -52,7 +68,7 @@ bar = charty.bar do
|
|
|
52
68
|
ylabel 'bar'
|
|
53
69
|
title 'bar plot'
|
|
54
70
|
end
|
|
55
|
-
bar.render("sample_images/
|
|
71
|
+
bar.render("sample_images/bar_pyplot.png")
|
|
56
72
|
```
|
|
57
73
|
|
|
58
74
|
Charty also supports Daru::DataFrame, Numo::NArray, NMatrix and ActiveRecord as Data Abstraction Layer.
|
|
@@ -60,7 +76,7 @@ For example.
|
|
|
60
76
|
|
|
61
77
|
```ruby
|
|
62
78
|
require 'charty'
|
|
63
|
-
charty = Charty::Plotter.new(:
|
|
79
|
+
charty = Charty::Plotter.new(:pyplot)
|
|
64
80
|
|
|
65
81
|
|
|
66
82
|
### when Daru::DataFrame
|
|
@@ -126,14 +142,14 @@ create an instance of the library you want to use.
|
|
|
126
142
|
```ruby
|
|
127
143
|
require 'charty'
|
|
128
144
|
|
|
129
|
-
# when you want to use matplotlib
|
|
130
|
-
charty = Charty.new(:
|
|
145
|
+
# when you want to use matplotlib.pyplot
|
|
146
|
+
charty = Charty::Plotter.new(:pyplot)
|
|
131
147
|
|
|
132
148
|
# when you want to use gruff
|
|
133
|
-
charty = Charty.new(:gruff)
|
|
149
|
+
charty = Charty::Plotter.new(:gruff)
|
|
134
150
|
|
|
135
151
|
# when you wanto to use rubyplot
|
|
136
|
-
charty = Charty.new(:rubyplot)
|
|
152
|
+
charty = Charty::Plotter.new(:rubyplot)
|
|
137
153
|
```
|
|
138
154
|
|
|
139
155
|
### Bar
|
|
@@ -148,12 +164,12 @@ bar = charty.bar do
|
|
|
148
164
|
ylabel 'bar'
|
|
149
165
|
title 'bar plot'
|
|
150
166
|
end
|
|
151
|
-
bar.render("sample_images/
|
|
167
|
+
bar.render("sample_images/bar_pyplot.png")
|
|
152
168
|
```
|
|
153
169
|
|
|
154
|
-
####
|
|
170
|
+
#### PyPlot
|
|
155
171
|
|
|
156
|
-
|
|
157
173
|
|
|
158
174
|
#### Gruff
|
|
159
175
|
|
|
@@ -174,12 +190,12 @@ curve2 = charty.curve do
|
|
|
174
190
|
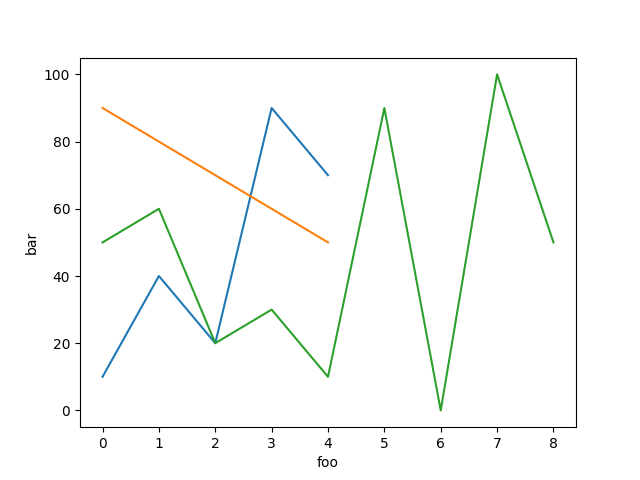
xlabel 'foo'
|
|
175
191
|
ylabel 'bar'
|
|
176
192
|
end
|
|
177
|
-
curve2.render("sample_images/
|
|
193
|
+
curve2.render("sample_images/curve_pyplot.png")
|
|
178
194
|
```
|
|
179
195
|
|
|
180
|
-
####
|
|
196
|
+
#### PyPlot
|
|
181
197
|
|
|
182
|
-
|
|
183
199
|
|
|
184
200
|
#### Gruff
|
|
185
201
|
|
|
@@ -198,12 +214,12 @@ curve = charty.curve do
|
|
|
198
214
|
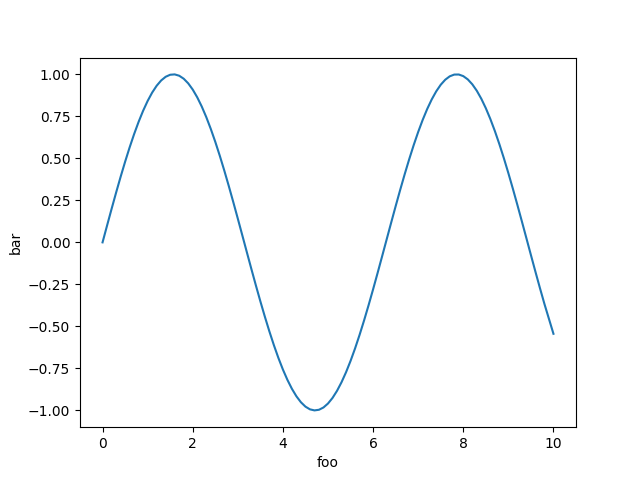
xlabel 'foo'
|
|
199
215
|
ylabel 'bar'
|
|
200
216
|
end
|
|
201
|
-
curve.render("sample_images/
|
|
217
|
+
curve.render("sample_images/curve_with_function_pyplot.png")
|
|
202
218
|
```
|
|
203
219
|
|
|
204
|
-
####
|
|
220
|
+
#### PyPlot
|
|
205
221
|
|
|
206
|
-
|
|
207
223
|
|
|
208
224
|
#### Gruff
|
|
209
225
|
|
|
@@ -223,12 +239,12 @@ box_plot = charty.box_plot do
|
|
|
223
239
|
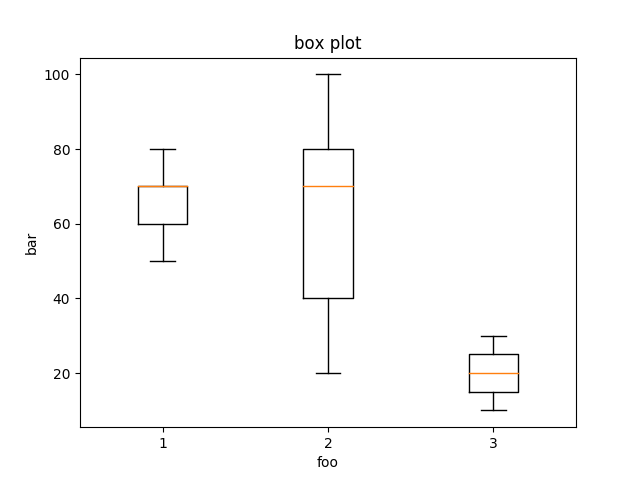
ylabel 'bar'
|
|
224
240
|
title 'box plot'
|
|
225
241
|
end
|
|
226
|
-
box_plot.render("sample_images/
|
|
242
|
+
box_plot.render("sample_images/box_plot_pyplot.png")
|
|
227
243
|
```
|
|
228
244
|
|
|
229
|
-
####
|
|
245
|
+
#### PyPlot
|
|
230
246
|
|
|
231
|
-
|
|
232
248
|
|
|
233
249
|
#### Gruff
|
|
234
250
|
|
|
@@ -251,12 +267,12 @@ scatter = charty.scatter do
|
|
|
251
267
|
ylabel 'y label'
|
|
252
268
|
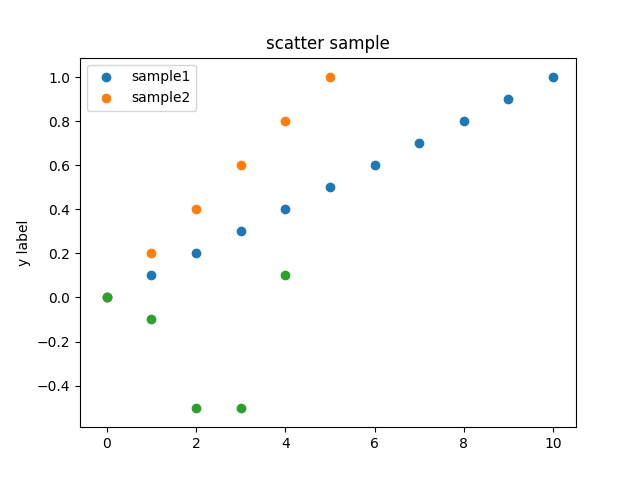
title 'scatter sample'
|
|
253
269
|
end
|
|
254
|
-
scatter.render("sample_images/
|
|
270
|
+
scatter.render("sample_images/scatter_pyplot.png")
|
|
255
271
|
```
|
|
256
272
|
|
|
257
|
-
####
|
|
273
|
+
#### PyPlot
|
|
258
274
|
|
|
259
|
-
|
|
260
276
|
|
|
261
277
|
#### Gruff
|
|
262
278
|
|
|
@@ -277,12 +293,12 @@ error_bar = charty.error_bar do
|
|
|
277
293
|
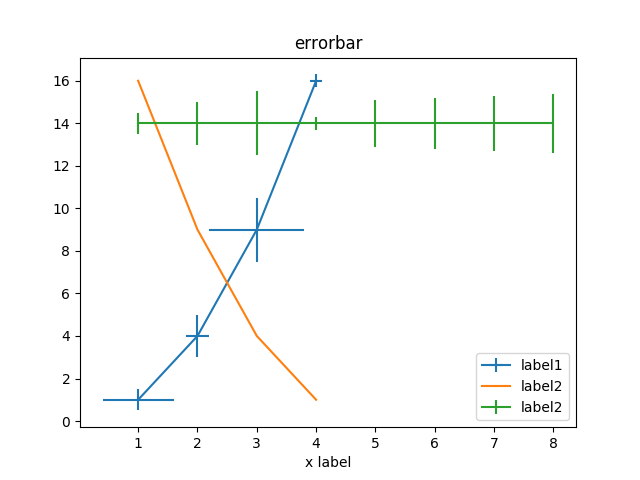
xlabel 'x label'
|
|
278
294
|
title 'error_bar'
|
|
279
295
|
end
|
|
280
|
-
error_bar.render("sample_images/
|
|
296
|
+
error_bar.render("sample_images/error_bar_pyplot.png")
|
|
281
297
|
```
|
|
282
298
|
|
|
283
|
-
####
|
|
299
|
+
#### PyPlot
|
|
284
300
|
|
|
285
|
-
|
|
286
302
|
|
|
287
303
|
#### Gruff
|
|
288
304
|
|
|
@@ -304,12 +320,12 @@ bubble = charty.bubble do
|
|
|
304
320
|
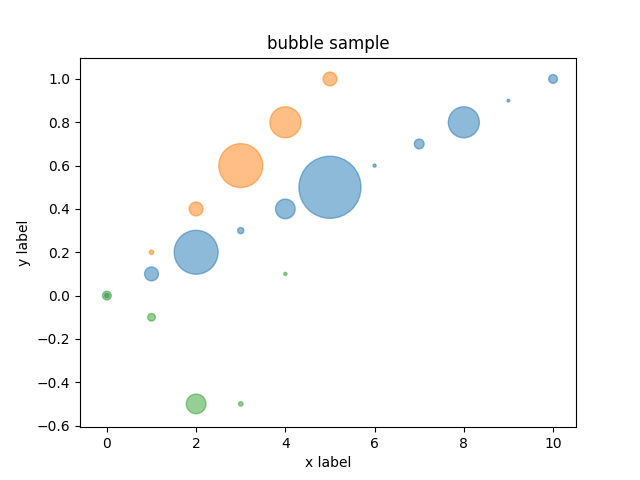
ylabel 'y label'
|
|
305
321
|
title 'bubble sample'
|
|
306
322
|
end
|
|
307
|
-
bubble.render("sample_images/
|
|
323
|
+
bubble.render("sample_images/bubble_pyplot.png")
|
|
308
324
|
```
|
|
309
325
|
|
|
310
|
-
####
|
|
326
|
+
#### PyPlot
|
|
311
327
|
|
|
312
|
-
|
|
313
329
|
|
|
314
330
|
#### Gruff
|
|
315
331
|
|
|
@@ -329,12 +345,12 @@ hist = charty.hist do
|
|
|
329
345
|
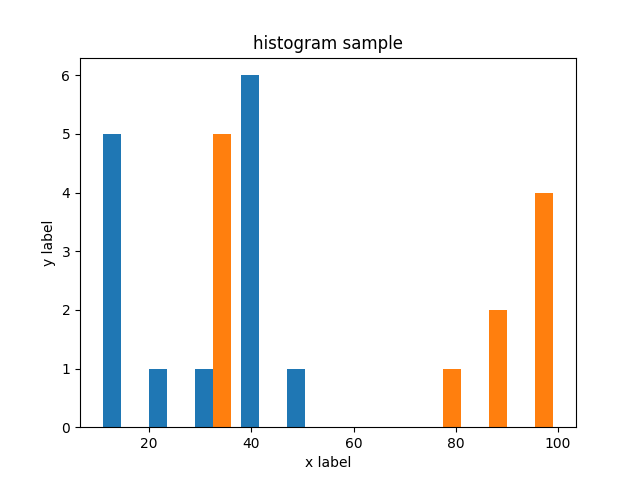
ylabel 'y label'
|
|
330
346
|
title 'histogram sample'
|
|
331
347
|
end
|
|
332
|
-
hist.render("sample_images/
|
|
348
|
+
hist.render("sample_images/hist_pyplot.png")
|
|
333
349
|
```
|
|
334
350
|
|
|
335
|
-
####
|
|
351
|
+
#### PyPlot
|
|
336
352
|
|
|
337
|
-
|
|
338
354
|
|
|
339
355
|
#### Gruff
|
|
340
356
|
|
|
@@ -350,12 +366,12 @@ Not supported
|
|
|
350
366
|
layout = charty.layout
|
|
351
367
|
layout << curve
|
|
352
368
|
layout << scatter
|
|
353
|
-
layout.render("sample_images/
|
|
369
|
+
layout.render("sample_images/subplot_pyplot.png")
|
|
354
370
|
```
|
|
355
371
|
|
|
356
|
-
####
|
|
372
|
+
#### PyPlot
|
|
357
373
|
|
|
358
|
-
|
|
359
375
|
|
|
360
376
|
#### Gruff
|
|
361
377
|
|
|
@@ -385,12 +401,12 @@ end
|
|
|
385
401
|
grid_layout = charty.layout(:grid2x2)
|
|
386
402
|
grid_layout << curve_list
|
|
387
403
|
grid_layout << scatter_list
|
|
388
|
-
grid_layout.render("sample_images/
|
|
404
|
+
grid_layout.render("sample_images/subplot2_pyplot.png")
|
|
389
405
|
```
|
|
390
406
|
|
|
391
|
-
####
|
|
407
|
+
#### PyPlot
|
|
392
408
|
|
|
393
|
-
|
|
394
410
|
|
|
395
411
|
#### Gruff
|
|
396
412
|
|
data/Rakefile
CHANGED
data/charty.gemspec
CHANGED
|
@@ -27,6 +27,8 @@ Gem::Specification.new do |spec|
|
|
|
27
27
|
spec.require_paths = ["lib"]
|
|
28
28
|
|
|
29
29
|
spec.add_development_dependency "bundler", ">= 1.16"
|
|
30
|
-
spec.add_development_dependency "rake"
|
|
30
|
+
spec.add_development_dependency "rake"
|
|
31
|
+
spec.add_development_dependency "test-unit"
|
|
31
32
|
spec.add_development_dependency "matplotlib"
|
|
33
|
+
spec.add_development_dependency "gruff"
|
|
32
34
|
end
|
data/examples/daru.ipynb
CHANGED
data/examples/iris_dataset.ipynb
CHANGED
data/examples/nmatrix.ipynb
CHANGED
data/examples/numo-narray.ipynb
CHANGED
|
@@ -0,0 +1,265 @@
|
|
|
1
|
+
{
|
|
2
|
+
"cells": [
|
|
3
|
+
{
|
|
4
|
+
"cell_type": "code",
|
|
5
|
+
"execution_count": 1,
|
|
6
|
+
"metadata": {},
|
|
7
|
+
"outputs": [
|
|
8
|
+
{
|
|
9
|
+
"data": {
|
|
10
|
+
"text/plain": [
|
|
11
|
+
"#<Charty::Plotter:0x00007fc44239a540 @plotter_adapter=#<Charty::GoogleChart:0x00007fc4440b3780>>"
|
|
12
|
+
]
|
|
13
|
+
},
|
|
14
|
+
"execution_count": 1,
|
|
15
|
+
"metadata": {},
|
|
16
|
+
"output_type": "execute_result"
|
|
17
|
+
}
|
|
18
|
+
],
|
|
19
|
+
"source": [
|
|
20
|
+
"require 'charty'\n",
|
|
21
|
+
"charty = Charty::Plotter.new(:google_chart)"
|
|
22
|
+
]
|
|
23
|
+
},
|
|
24
|
+
{
|
|
25
|
+
"cell_type": "code",
|
|
26
|
+
"execution_count": 2,
|
|
27
|
+
"metadata": {},
|
|
28
|
+
"outputs": [
|
|
29
|
+
{
|
|
30
|
+
"data": {
|
|
31
|
+
"text/html": [
|
|
32
|
+
" <script type='text/javascript' src='https://www.gstatic.com/charts/loader.js'></script>\n",
|
|
33
|
+
" <script type=\"text/javascript\">\n",
|
|
34
|
+
" google.charts.load(\"current\", {packages:[\"corechart\"]});\n",
|
|
35
|
+
" google.charts.setOnLoadCallback(drawChart);\n",
|
|
36
|
+
" function drawChart() {\n",
|
|
37
|
+
" const data = google.visualization.arrayToDataTable(\n",
|
|
38
|
+
" [[\"foo\", \"\", \"\"], [\"0\", 10, 30], [\"1\", 20, 40], [\"2\", 70, 50], [\"4\", 60, \"null\"]]\n",
|
|
39
|
+
" );\n",
|
|
40
|
+
"\n",
|
|
41
|
+
" const view = new google.visualization.DataView(data);\n",
|
|
42
|
+
"\n",
|
|
43
|
+
" const options = {\n",
|
|
44
|
+
" title: \"this is the title\",\n",
|
|
45
|
+
" vAxis: {\n",
|
|
46
|
+
" title: \"bara\",\n",
|
|
47
|
+
" viewWindow: {\n",
|
|
48
|
+
" max: null,\n",
|
|
49
|
+
" min: null,\n",
|
|
50
|
+
" },\n",
|
|
51
|
+
" },\n",
|
|
52
|
+
" hAxis: {\n",
|
|
53
|
+
" title: \"foo\",\n",
|
|
54
|
+
" viewWindow: {\n",
|
|
55
|
+
" max: null,\n",
|
|
56
|
+
" min: null,\n",
|
|
57
|
+
" }\n",
|
|
58
|
+
" },\n",
|
|
59
|
+
" legend: { position: \"none\" },\n",
|
|
60
|
+
" };\n",
|
|
61
|
+
" const chart = new google.visualization.BarChart(document.getElementById(\"BarChart-1\"));\n",
|
|
62
|
+
" chart.draw(view, options);\n",
|
|
63
|
+
" }\n",
|
|
64
|
+
" </script>\n",
|
|
65
|
+
" <div id=\"BarChart-1\" style=\"width: 900px; height: 300px;\"></div>\n"
|
|
66
|
+
],
|
|
67
|
+
"text/plain": [
|
|
68
|
+
"\" <script type='text/javascript' src='https://www.gstatic.com/charts/loader.js'></script>\\n <script type=\\\"text/javascript\\\">\\n google.charts.load(\\\"current\\\", {packages:[\\\"corechart\\\"]});\\n google.charts.setOnLoadCallback(drawChart);\\n function drawChart() {\\n const data = google.visualization.arrayToDataTable(\\n [[\\\"foo\\\", \\\"\\\", \\\"\\\"], [\\\"0\\\", 10, 30], [\\\"1\\\", 20, 40], [\\\"2\\\", 70, 50], [\\\"4\\\", 60, \\\"null\\\"]]\\n );\\n\\n const view = new google.visualization.DataView(data);\\n\\n const options = {\\n title: \\\"this is the title\\\",\\n vAxis: {\\n title: \\\"bara\\\",\\n viewWindow: {\\n max: null,\\n min: null,\\n },\\n },\\n hAxis: {\\n title: \\\"foo\\\",\\n viewWindow: {\\n max: null,\\n min: null,\\n }\\n },\\n legend: { position: \\\"none\\\" },\\n };\\n const chart = new google.visualization.BarChart(document.getElementById(\\\"BarChart-1\\\"));\\n chart.draw(view, options);\\n }\\n </script>\\n <div id=\\\"BarChart-1\\\" style=\\\"width: 900px; height: 300px;\\\"></div>\\n\""
|
|
69
|
+
]
|
|
70
|
+
},
|
|
71
|
+
"metadata": {},
|
|
72
|
+
"output_type": "display_data"
|
|
73
|
+
},
|
|
74
|
+
{
|
|
75
|
+
"data": {
|
|
76
|
+
"text/plain": [
|
|
77
|
+
"#<CZTop::Socket::PUB:0x7fc4430de3c0 last_endpoint=\"tcp://127.0.0.1:49318\">"
|
|
78
|
+
]
|
|
79
|
+
},
|
|
80
|
+
"execution_count": 2,
|
|
81
|
+
"metadata": {},
|
|
82
|
+
"output_type": "execute_result"
|
|
83
|
+
}
|
|
84
|
+
],
|
|
85
|
+
"source": [
|
|
86
|
+
"bar = charty.bar do\n",
|
|
87
|
+
" xlabel 'foo'\n",
|
|
88
|
+
" ylabel 'bara'\n",
|
|
89
|
+
" series [0, 1, 4, 2], [10, 20, 60, 70]\n",
|
|
90
|
+
" series [0, 1, 2], [30, 40, 50]\n",
|
|
91
|
+
" title 'this is the title'\n",
|
|
92
|
+
"end\n",
|
|
93
|
+
"IRuby.display(IRuby.html(bar.render))"
|
|
94
|
+
]
|
|
95
|
+
},
|
|
96
|
+
{
|
|
97
|
+
"cell_type": "code",
|
|
98
|
+
"execution_count": 3,
|
|
99
|
+
"metadata": {},
|
|
100
|
+
"outputs": [
|
|
101
|
+
{
|
|
102
|
+
"data": {
|
|
103
|
+
"text/html": [
|
|
104
|
+
" <script type='text/javascript' src='https://www.gstatic.com/charts/loader.js'></script>\n",
|
|
105
|
+
" <script type=\"text/javascript\">\n",
|
|
106
|
+
" google.charts.load(\"current\", {packages:[\"corechart\"]});\n",
|
|
107
|
+
" google.charts.setOnLoadCallback(drawChart);\n",
|
|
108
|
+
" function drawChart() {\n",
|
|
109
|
+
" const data = google.visualization.arrayToDataTable(\n",
|
|
110
|
+
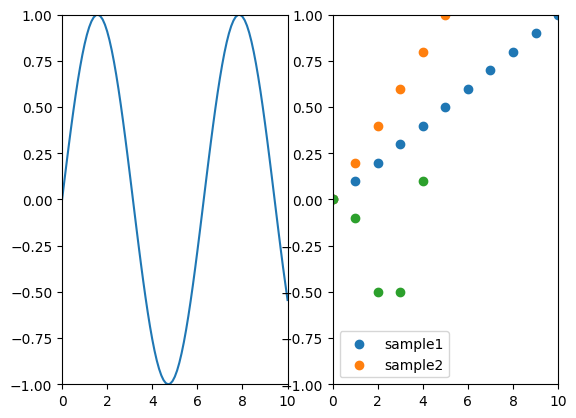
" [[\"\", \"sample1\", \"sample2\", \"\"], [\"0\", 0.0, 0.0, 0], [\"1\", 0.1, 0.2, -0.1], [\"2\", 0.2, 0.4, -0.5], [\"3\", 0.30000000000000004, 0.6000000000000001, -0.5], [\"4\", 0.4, 0.8, 0.1], [\"5\", 0.5, 1.0, \"null\"], [\"6\", 0.6000000000000001, \"null\", \"null\"], [\"7\", 0.7000000000000001, \"null\", \"null\"], [\"8\", 0.8, \"null\", \"null\"], [\"9\", 0.9, \"null\", \"null\"], [\"10\", 1.0, \"null\", \"null\"]]\n",
|
|
111
|
+
" );\n",
|
|
112
|
+
"\n",
|
|
113
|
+
" const view = new google.visualization.DataView(data);\n",
|
|
114
|
+
"\n",
|
|
115
|
+
" const options = {\n",
|
|
116
|
+
" title: \"scatter sample\",\n",
|
|
117
|
+
" vAxis: {\n",
|
|
118
|
+
" title: \"y label\",\n",
|
|
119
|
+
" viewWindow: {\n",
|
|
120
|
+
" max: null,\n",
|
|
121
|
+
" min: null,\n",
|
|
122
|
+
" },\n",
|
|
123
|
+
" },\n",
|
|
124
|
+
" hAxis: {\n",
|
|
125
|
+
" title: \"\",\n",
|
|
126
|
+
" viewWindow: {\n",
|
|
127
|
+
" max: null,\n",
|
|
128
|
+
" min: null,\n",
|
|
129
|
+
" }\n",
|
|
130
|
+
" },\n",
|
|
131
|
+
" legend: { position: \"none\" },\n",
|
|
132
|
+
" };\n",
|
|
133
|
+
" const chart = new google.visualization.ScatterChart(document.getElementById(\"ScatterChart-2\"));\n",
|
|
134
|
+
" chart.draw(view, options);\n",
|
|
135
|
+
" }\n",
|
|
136
|
+
" </script>\n",
|
|
137
|
+
" <div id=\"ScatterChart-2\" style=\"width: 900px; height: 300px;\"></div>\n"
|
|
138
|
+
],
|
|
139
|
+
"text/plain": [
|
|
140
|
+
"\" <script type='text/javascript' src='https://www.gstatic.com/charts/loader.js'></script>\\n <script type=\\\"text/javascript\\\">\\n google.charts.load(\\\"current\\\", {packages:[\\\"corechart\\\"]});\\n google.charts.setOnLoadCallback(drawChart);\\n function drawChart() {\\n const data = google.visualization.arrayToDataTable(\\n [[\\\"\\\", \\\"sample1\\\", \\\"sample2\\\", \\\"\\\"], [\\\"0\\\", 0.0, 0.0, 0], [\\\"1\\\", 0.1, 0.2, -0.1], [\\\"2\\\", 0.2, 0.4, -0.5], [\\\"3\\\", 0.30000000000000004, 0.6000000000000001, -0.5], [\\\"4\\\", 0.4, 0.8, 0.1], [\\\"5\\\", 0.5, 1.0, \\\"null\\\"], [\\\"6\\\", 0.6000000000000001, \\\"null\\\", \\\"null\\\"], [\\\"7\\\", 0.7000000000000001, \\\"null\\\", \\\"null\\\"], [\\\"8\\\", 0.8, \\\"null\\\", \\\"null\\\"], [\\\"9\\\", 0.9, \\\"null\\\", \\\"null\\\"], [\\\"10\\\", 1.0, \\\"null\\\", \\\"null\\\"]]\\n );\\n\\n const view = new google.visualization.DataView(data);\\n\\n const options = {\\n title: \\\"scatter sample\\\",\\n vAxis: {\\n title: \\\"y label\\\",\\n viewWindow: {\\n max: null,\\n min: null,\\n },\\n },\\n hAxis: {\\n title: \\\"\\\",\\n viewWindow: {\\n max: null,\\n min: null,\\n }\\n },\\n legend: { position: \\\"none\\\" },\\n };\\n const chart = new google.visualization.ScatterChart(document.getElementById(\\\"ScatterChart-2\\\"));\\n chart.draw(view, options);\\n }\\n </script>\\n <div id=\\\"ScatterChart-2\\\" style=\\\"width: 900px; height: 300px;\\\"></div>\\n\""
|
|
141
|
+
]
|
|
142
|
+
},
|
|
143
|
+
"metadata": {},
|
|
144
|
+
"output_type": "display_data"
|
|
145
|
+
},
|
|
146
|
+
{
|
|
147
|
+
"data": {
|
|
148
|
+
"text/plain": [
|
|
149
|
+
"#<CZTop::Socket::PUB:0x7fc4430de3c0 last_endpoint=\"tcp://127.0.0.1:49318\">"
|
|
150
|
+
]
|
|
151
|
+
},
|
|
152
|
+
"execution_count": 3,
|
|
153
|
+
"metadata": {},
|
|
154
|
+
"output_type": "execute_result"
|
|
155
|
+
}
|
|
156
|
+
],
|
|
157
|
+
"source": [
|
|
158
|
+
"scatter = charty.scatter do\n",
|
|
159
|
+
" series 0..10, (0..1).step(0.1), label: 'sample1'\n",
|
|
160
|
+
" series 0..5, (0..1).step(0.2), label: 'sample2'\n",
|
|
161
|
+
" series [0, 1, 2, 3, 4], [0, -0.1, -0.5, -0.5, 0.1]\n",
|
|
162
|
+
" ylabel 'y label'\n",
|
|
163
|
+
" title 'scatter sample'\n",
|
|
164
|
+
"end\n",
|
|
165
|
+
"IRuby.display(IRuby.html(scatter.render))"
|
|
166
|
+
]
|
|
167
|
+
},
|
|
168
|
+
{
|
|
169
|
+
"cell_type": "code",
|
|
170
|
+
"execution_count": 4,
|
|
171
|
+
"metadata": {},
|
|
172
|
+
"outputs": [
|
|
173
|
+
{
|
|
174
|
+
"data": {
|
|
175
|
+
"text/html": [
|
|
176
|
+
" <script type='text/javascript' src='https://www.gstatic.com/charts/loader.js'></script>\n",
|
|
177
|
+
" <script type=\"text/javascript\">\n",
|
|
178
|
+
" google.charts.load(\"current\", {packages:[\"corechart\"]});\n",
|
|
179
|
+
" google.charts.setOnLoadCallback(drawChart);\n",
|
|
180
|
+
" function drawChart() {\n",
|
|
181
|
+
" const data = google.visualization.arrayToDataTable(\n",
|
|
182
|
+
" [[\"ID\", \"X\", \"Y\", \"GROUP\", \"SIZE\"], [\"\", 0, 0.0, \"sample1\", 10], [\"\", 1, 0.1, \"sample1\", 100], [\"\", 2, 0.2, \"sample1\", 1000], [\"\", 3, 0.30000000000000004, \"sample1\", 20], [\"\", 4, 0.4, \"sample1\", 200], [\"\", 5, 0.5, \"sample1\", 2000], [\"\", 6, 0.6000000000000001, \"sample1\", 5], [\"\", 7, 0.7000000000000001, \"sample1\", 50], [\"\", 8, 0.8, \"sample1\", 500], [\"\", 9, 0.9, \"sample1\", 4], [\"\", 10, 1.0, \"sample1\", 40], [\"\", 0, 0.0, \"sample2\", 1], [\"\", 1, 0.2, \"sample2\", 10], [\"\", 2, 0.4, \"sample2\", 100], [\"\", 3, 0.6000000000000001, \"sample2\", 1000], [\"\", 4, 0.8, \"sample2\", 500], [\"\", 5, 1.0, \"sample2\", 100], [\"\", 0, 0, 2, 40], [\"\", 1, -0.1, 2, 30], [\"\", 2, -0.5, 2, 200], [\"\", 3, -0.5, 2, 10], [\"\", 4, 0.1, 2, 5]]\n",
|
|
183
|
+
" );\n",
|
|
184
|
+
"\n",
|
|
185
|
+
" const view = new google.visualization.DataView(data);\n",
|
|
186
|
+
"\n",
|
|
187
|
+
" const options = {\n",
|
|
188
|
+
" title: \"bubble sample\",\n",
|
|
189
|
+
" vAxis: {\n",
|
|
190
|
+
" title: \"y label\",\n",
|
|
191
|
+
" viewWindow: {\n",
|
|
192
|
+
" max: 1,\n",
|
|
193
|
+
" min: -1,\n",
|
|
194
|
+
" },\n",
|
|
195
|
+
" },\n",
|
|
196
|
+
" hAxis: {\n",
|
|
197
|
+
" title: \"x label\",\n",
|
|
198
|
+
" viewWindow: {\n",
|
|
199
|
+
" max: 10,\n",
|
|
200
|
+
" min: 0,\n",
|
|
201
|
+
" }\n",
|
|
202
|
+
" },\n",
|
|
203
|
+
" legend: { position: \"none\" },\n",
|
|
204
|
+
" };\n",
|
|
205
|
+
" const chart = new google.visualization.BubbleChart(document.getElementById(\"BubbleChart-3\"));\n",
|
|
206
|
+
" chart.draw(view, options);\n",
|
|
207
|
+
" }\n",
|
|
208
|
+
" </script>\n",
|
|
209
|
+
" <div id=\"BubbleChart-3\" style=\"width: 900px; height: 300px;\"></div>\n"
|
|
210
|
+
],
|
|
211
|
+
"text/plain": [
|
|
212
|
+
"\" <script type='text/javascript' src='https://www.gstatic.com/charts/loader.js'></script>\\n <script type=\\\"text/javascript\\\">\\n google.charts.load(\\\"current\\\", {packages:[\\\"corechart\\\"]});\\n google.charts.setOnLoadCallback(drawChart);\\n function drawChart() {\\n const data = google.visualization.arrayToDataTable(\\n [[\\\"ID\\\", \\\"X\\\", \\\"Y\\\", \\\"GROUP\\\", \\\"SIZE\\\"], [\\\"\\\", 0, 0.0, \\\"sample1\\\", 10], [\\\"\\\", 1, 0.1, \\\"sample1\\\", 100], [\\\"\\\", 2, 0.2, \\\"sample1\\\", 1000], [\\\"\\\", 3, 0.30000000000000004, \\\"sample1\\\", 20], [\\\"\\\", 4, 0.4, \\\"sample1\\\", 200], [\\\"\\\", 5, 0.5, \\\"sample1\\\", 2000], [\\\"\\\", 6, 0.6000000000000001, \\\"sample1\\\", 5], [\\\"\\\", 7, 0.7000000000000001, \\\"sample1\\\", 50], [\\\"\\\", 8, 0.8, \\\"sample1\\\", 500], [\\\"\\\", 9, 0.9, \\\"sample1\\\", 4], [\\\"\\\", 10, 1.0, \\\"sample1\\\", 40], [\\\"\\\", 0, 0.0, \\\"sample2\\\", 1], [\\\"\\\", 1, 0.2, \\\"sample2\\\", 10], [\\\"\\\", 2, 0.4, \\\"sample2\\\", 100], [\\\"\\\", 3, 0.6000000000000001, \\\"sample2\\\", 1000], [\\\"\\\", 4, 0.8, \\\"sample2\\\", 500], [\\\"\\\", 5, 1.0, \\\"sample2\\\", 100], [\\\"\\\", 0, 0, 2, 40], [\\\"\\\", 1, -0.1, 2, 30], [\\\"\\\", 2, -0.5, 2, 200], [\\\"\\\", 3, -0.5, 2, 10], [\\\"\\\", 4, 0.1, 2, 5]]\\n );\\n\\n const view = new google.visualization.DataView(data);\\n\\n const options = {\\n title: \\\"bubble sample\\\",\\n vAxis: {\\n title: \\\"y label\\\",\\n viewWindow: {\\n max: 1,\\n min: -1,\\n },\\n },\\n hAxis: {\\n title: \\\"x label\\\",\\n viewWindow: {\\n max: 10,\\n min: 0,\\n }\\n },\\n legend: { position: \\\"none\\\" },\\n };\\n const chart = new google.visualization.BubbleChart(document.getElementById(\\\"BubbleChart-3\\\"));\\n chart.draw(view, options);\\n }\\n </script>\\n <div id=\\\"BubbleChart-3\\\" style=\\\"width: 900px; height: 300px;\\\"></div>\\n\""
|
|
213
|
+
]
|
|
214
|
+
},
|
|
215
|
+
"metadata": {},
|
|
216
|
+
"output_type": "display_data"
|
|
217
|
+
},
|
|
218
|
+
{
|
|
219
|
+
"data": {
|
|
220
|
+
"text/plain": [
|
|
221
|
+
"#<CZTop::Socket::PUB:0x7fc4430de3c0 last_endpoint=\"tcp://127.0.0.1:49318\">"
|
|
222
|
+
]
|
|
223
|
+
},
|
|
224
|
+
"execution_count": 4,
|
|
225
|
+
"metadata": {},
|
|
226
|
+
"output_type": "execute_result"
|
|
227
|
+
}
|
|
228
|
+
],
|
|
229
|
+
"source": [
|
|
230
|
+
"bubble = charty.bubble do\n",
|
|
231
|
+
" series 0..10, (0..1).step(0.1), [10, 100, 1000, 20, 200, 2000, 5, 50, 500, 4, 40], label: 'sample1'\n",
|
|
232
|
+
" series 0..5, (0..1).step(0.2), [1, 10, 100, 1000, 500, 100], label: 'sample2'\n",
|
|
233
|
+
" series [0, 1, 2, 3, 4], [0, -0.1, -0.5, -0.5, 0.1], [40, 30, 200, 10, 5]\n",
|
|
234
|
+
" range x: 0..10, y: -1..1\n",
|
|
235
|
+
" xlabel 'x label'\n",
|
|
236
|
+
" ylabel 'y label'\n",
|
|
237
|
+
" title 'bubble sample'\n",
|
|
238
|
+
"end\n",
|
|
239
|
+
"IRuby.display(IRuby.html(bubble.render))"
|
|
240
|
+
]
|
|
241
|
+
},
|
|
242
|
+
{
|
|
243
|
+
"cell_type": "code",
|
|
244
|
+
"execution_count": null,
|
|
245
|
+
"metadata": {},
|
|
246
|
+
"outputs": [],
|
|
247
|
+
"source": []
|
|
248
|
+
}
|
|
249
|
+
],
|
|
250
|
+
"metadata": {
|
|
251
|
+
"kernelspec": {
|
|
252
|
+
"display_name": "Ruby 2.5.5",
|
|
253
|
+
"language": "ruby",
|
|
254
|
+
"name": "ruby"
|
|
255
|
+
},
|
|
256
|
+
"language_info": {
|
|
257
|
+
"file_extension": ".rb",
|
|
258
|
+
"mimetype": "application/x-ruby",
|
|
259
|
+
"name": "ruby",
|
|
260
|
+
"version": "2.5.5"
|
|
261
|
+
}
|
|
262
|
+
},
|
|
263
|
+
"nbformat": 4,
|
|
264
|
+
"nbformat_minor": 2
|
|
265
|
+
}
|
|
File without changes
|
|
File without changes
|
|
File without changes
|
|
File without changes
|
|
File without changes
|
data/examples/sample_images/{curve_with_function_matplot.png → curve_with_function_pyplot.png}
RENAMED
|
File without changes
|
|
File without changes
|
|
File without changes
|
|
File without changes
|
|
File without changes
|
|
File without changes
|
|
@@ -19,7 +19,7 @@
|
|
|
19
19
|
"source": [
|
|
20
20
|
"require 'charty'\n",
|
|
21
21
|
"\n",
|
|
22
|
-
"charty = Charty::Plotter.new(:
|
|
22
|
+
"charty = Charty::Plotter.new(:pyplot)\n",
|
|
23
23
|
"Charty::Matplot.activate_iruby_integration"
|
|
24
24
|
]
|
|
25
25
|
},
|
|
@@ -47,7 +47,7 @@
|
|
|
47
47
|
" xlabel 'foo'\n",
|
|
48
48
|
" ylabel 'bar'\n",
|
|
49
49
|
"end\n",
|
|
50
|
-
"curve.render(\"sample_images/
|
|
50
|
+
"curve.render(\"sample_images/curve_with_function_pyplot.png\")"
|
|
51
51
|
]
|
|
52
52
|
},
|
|
53
53
|
{
|
|
@@ -76,7 +76,7 @@
|
|
|
76
76
|
" xlabel 'foo'\n",
|
|
77
77
|
" ylabel 'bar'\n",
|
|
78
78
|
"end\n",
|
|
79
|
-
"curve2.render(\"sample_images/
|
|
79
|
+
"curve2.render(\"sample_images/curve_pyplot.png\")"
|
|
80
80
|
]
|
|
81
81
|
},
|
|
82
82
|
{
|
|
@@ -106,7 +106,7 @@
|
|
|
106
106
|
" ylabel 'bar'\n",
|
|
107
107
|
" title 'bar plot'\n",
|
|
108
108
|
"end\n",
|
|
109
|
-
"bar.render(\"sample_images/
|
|
109
|
+
"bar.render(\"sample_images/bar_pyplot.png\")"
|
|
110
110
|
]
|
|
111
111
|
},
|
|
112
112
|
{
|
|
@@ -136,7 +136,7 @@
|
|
|
136
136
|
" ylabel 'bar'\n",
|
|
137
137
|
" title 'bar plot'\n",
|
|
138
138
|
"end\n",
|
|
139
|
-
"barh.render(\"sample_images/
|
|
139
|
+
"barh.render(\"sample_images/barh_pyplot.png\")"
|
|
140
140
|
]
|
|
141
141
|
},
|
|
142
142
|
{
|
|
@@ -164,7 +164,7 @@
|
|
|
164
164
|
" ylabel 'bar'\n",
|
|
165
165
|
" title 'box plot'\n",
|
|
166
166
|
"end\n",
|
|
167
|
-
"box_plot.render(\"sample_images/
|
|
167
|
+
"box_plot.render(\"sample_images/box_plot_pyplot.png\")"
|
|
168
168
|
]
|
|
169
169
|
},
|
|
170
170
|
{
|
|
@@ -195,7 +195,7 @@
|
|
|
195
195
|
" ylabel 'y label'\n",
|
|
196
196
|
" title 'scatter sample'\n",
|
|
197
197
|
"end\n",
|
|
198
|
-
"scatter.render(\"sample_images/
|
|
198
|
+
"scatter.render(\"sample_images/scatter_pyplot.png\")"
|
|
199
199
|
]
|
|
200
200
|
},
|
|
201
201
|
{
|
|
@@ -238,7 +238,7 @@
|
|
|
238
238
|
"source": [
|
|
239
239
|
"layout << curve\n",
|
|
240
240
|
"layout << scatter\n",
|
|
241
|
-
"layout.render(\"sample_images/
|
|
241
|
+
"layout.render(\"sample_images/subplot_pyplot.png\")"
|
|
242
242
|
]
|
|
243
243
|
},
|
|
244
244
|
{
|
|
@@ -276,7 +276,7 @@
|
|
|
276
276
|
"grid_layout = charty.layout(:grid2x2)\n",
|
|
277
277
|
"grid_layout << curve_list\n",
|
|
278
278
|
"grid_layout << scatter_list\n",
|
|
279
|
-
"grid_layout.render(\"sample_images/
|
|
279
|
+
"grid_layout.render(\"sample_images/subplot2_pyplot.png\")"
|
|
280
280
|
]
|
|
281
281
|
},
|
|
282
282
|
{
|
|
@@ -305,7 +305,7 @@
|
|
|
305
305
|
" xlabel 'x label' \n",
|
|
306
306
|
" title 'errorbar'\n",
|
|
307
307
|
"end\n",
|
|
308
|
-
"error_bar.render(\"sample_images/
|
|
308
|
+
"error_bar.render(\"sample_images/error_bar_pyplot.png\")"
|
|
309
309
|
]
|
|
310
310
|
},
|
|
311
311
|
{
|
|
@@ -335,7 +335,7 @@
|
|
|
335
335
|
" ylabel 'y label'\n",
|
|
336
336
|
" title 'bubble sample'\n",
|
|
337
337
|
"end\n",
|
|
338
|
-
"bubble.render(\"sample_images/
|
|
338
|
+
"bubble.render(\"sample_images/bubble_pyplot.png\")"
|
|
339
339
|
]
|
|
340
340
|
},
|
|
341
341
|
{
|
|
@@ -363,7 +363,7 @@
|
|
|
363
363
|
" ylabel 'y label'\n",
|
|
364
364
|
" title 'histogram sample'\n",
|
|
365
365
|
"end\n",
|
|
366
|
-
"hist.render(\"sample_images/
|
|
366
|
+
"hist.render(\"sample_images/hist_pyplot.png\")"
|
|
367
367
|
]
|
|
368
368
|
},
|
|
369
369
|
{
|
data/lib/charty.rb
CHANGED
|
@@ -0,0 +1,167 @@
|
|
|
1
|
+
module Charty
|
|
2
|
+
class GoogleChart < PlotterAdapter
|
|
3
|
+
Name = "google_chart"
|
|
4
|
+
attr_reader :context
|
|
5
|
+
|
|
6
|
+
def self.chart_id=(chart_id)
|
|
7
|
+
@chart_id = chart_id
|
|
8
|
+
end
|
|
9
|
+
|
|
10
|
+
def self.chart_id
|
|
11
|
+
@chart_id ||= 0
|
|
12
|
+
end
|
|
13
|
+
|
|
14
|
+
def initilize
|
|
15
|
+
end
|
|
16
|
+
|
|
17
|
+
def label(x, y)
|
|
18
|
+
end
|
|
19
|
+
|
|
20
|
+
def series=(series)
|
|
21
|
+
@series = series
|
|
22
|
+
end
|
|
23
|
+
|
|
24
|
+
def render(context, filename)
|
|
25
|
+
plot(nil, context)
|
|
26
|
+
end
|
|
27
|
+
|
|
28
|
+
def plot(plot, context)
|
|
29
|
+
@context = context
|
|
30
|
+
self.class.chart_id = self.class.chart_id + 1
|
|
31
|
+
|
|
32
|
+
case context.method
|
|
33
|
+
when :bar
|
|
34
|
+
generate_render_js("BarChart")
|
|
35
|
+
when :scatter
|
|
36
|
+
generate_render_js("ScatterChart")
|
|
37
|
+
when :bubble
|
|
38
|
+
generate_render_js("BubbleChart")
|
|
39
|
+
else
|
|
40
|
+
raise NotImplementedError
|
|
41
|
+
end
|
|
42
|
+
end
|
|
43
|
+
|
|
44
|
+
private
|
|
45
|
+
|
|
46
|
+
def google_chart_load_tag
|
|
47
|
+
"<script type='text/javascript' src='https://www.gstatic.com/charts/loader.js'></script>"
|
|
48
|
+
end
|
|
49
|
+
|
|
50
|
+
def headers
|
|
51
|
+
[].tap do |header|
|
|
52
|
+
header << context.xlabel
|
|
53
|
+
context.series.to_a.each_with_index do |series_data, index|
|
|
54
|
+
header << series_data.label || index
|
|
55
|
+
end
|
|
56
|
+
end
|
|
57
|
+
end
|
|
58
|
+
|
|
59
|
+
def x_labels
|
|
60
|
+
[].tap do |label|
|
|
61
|
+
context.series.each do |series|
|
|
62
|
+
series.xs.each do |xs_data|
|
|
63
|
+
label << xs_data unless label.any? { |label| label == xs_data }
|
|
64
|
+
end
|
|
65
|
+
end
|
|
66
|
+
end
|
|
67
|
+
end
|
|
68
|
+
|
|
69
|
+
def data_hash
|
|
70
|
+
{}.tap do |hash|
|
|
71
|
+
context.series.to_a.each_with_index do |series_data, series_index|
|
|
72
|
+
x_labels.sort.each do |x_label|
|
|
73
|
+
unless hash[x_label]
|
|
74
|
+
hash[x_label] = []
|
|
75
|
+
end
|
|
76
|
+
|
|
77
|
+
if data_index = series_data.xs.to_a.index(x_label)
|
|
78
|
+
hash[x_label] << series_data.ys.to_a[data_index]
|
|
79
|
+
else
|
|
80
|
+
hash[x_label] << "null"
|
|
81
|
+
end
|
|
82
|
+
end
|
|
83
|
+
end
|
|
84
|
+
end
|
|
85
|
+
end
|
|
86
|
+
|
|
87
|
+
def formatted_data_array
|
|
88
|
+
case context.method
|
|
89
|
+
when :bubble
|
|
90
|
+
[["ID", "X", "Y", "GROUP", "SIZE"]].tap do |data_array|
|
|
91
|
+
context.series.to_a.each_with_index do |series_data, series_index|
|
|
92
|
+
series_data.xs.to_a.each_with_index do |data, data_index|
|
|
93
|
+
data_array << [
|
|
94
|
+
"",
|
|
95
|
+
series_data.xs.to_a[data_index] || "null",
|
|
96
|
+
series_data.ys.to_a[data_index] || "null",
|
|
97
|
+
series_data[:label] || series_index,
|
|
98
|
+
series_data.zs.to_a[data_index] || "null",
|
|
99
|
+
]
|
|
100
|
+
end
|
|
101
|
+
end
|
|
102
|
+
end
|
|
103
|
+
else
|
|
104
|
+
[headers.map(&:to_s)].tap do |data_array|
|
|
105
|
+
data_hash.each do |k, v|
|
|
106
|
+
data_array << [k.to_s, v].flatten
|
|
107
|
+
end
|
|
108
|
+
end
|
|
109
|
+
end
|
|
110
|
+
end
|
|
111
|
+
|
|
112
|
+
def x_range_option
|
|
113
|
+
x_range = context&.range&.fetch(:x, nil)
|
|
114
|
+
{
|
|
115
|
+
max: x_range&.max,
|
|
116
|
+
min: x_range&.min,
|
|
117
|
+
}.reject { |_k, v| v.nil? }
|
|
118
|
+
end
|
|
119
|
+
|
|
120
|
+
def y_range_option
|
|
121
|
+
y_range = context&.range&.fetch(:y, nil)
|
|
122
|
+
{
|
|
123
|
+
max: y_range&.max,
|
|
124
|
+
min: y_range&.min,
|
|
125
|
+
}.reject { |_k, v| v.nil? }
|
|
126
|
+
end
|
|
127
|
+
|
|
128
|
+
def generate_render_js(chart_type)
|
|
129
|
+
js = <<-JS
|
|
130
|
+
#{google_chart_load_tag}
|
|
131
|
+
<script type="text/javascript">
|
|
132
|
+
google.charts.load("current", {packages:["corechart"]});
|
|
133
|
+
google.charts.setOnLoadCallback(drawChart);
|
|
134
|
+
function drawChart() {
|
|
135
|
+
const data = google.visualization.arrayToDataTable(
|
|
136
|
+
#{formatted_data_array}
|
|
137
|
+
);
|
|
138
|
+
|
|
139
|
+
const view = new google.visualization.DataView(data);
|
|
140
|
+
|
|
141
|
+
const options = {
|
|
142
|
+
title: "#{context.title}",
|
|
143
|
+
vAxis: {
|
|
144
|
+
title: "#{context.ylabel}",
|
|
145
|
+
viewWindow: {
|
|
146
|
+
max: #{y_range_option[:max] || "null"},
|
|
147
|
+
min: #{y_range_option[:min] || "null"},
|
|
148
|
+
},
|
|
149
|
+
},
|
|
150
|
+
hAxis: {
|
|
151
|
+
title: "#{context.xlabel}",
|
|
152
|
+
viewWindow: {
|
|
153
|
+
max: #{x_range_option[:max] || "null"},
|
|
154
|
+
min: #{x_range_option[:min] || "null"},
|
|
155
|
+
}
|
|
156
|
+
},
|
|
157
|
+
legend: { position: "none" },
|
|
158
|
+
};
|
|
159
|
+
const chart = new google.visualization.#{chart_type}(document.getElementById("#{chart_type}-#{self.class.chart_id}"));
|
|
160
|
+
chart.draw(view, options);
|
|
161
|
+
}
|
|
162
|
+
</script>
|
|
163
|
+
<div id="#{chart_type}-#{self.class.chart_id}" style="width: 900px; height: 300px;"></div>
|
|
164
|
+
JS
|
|
165
|
+
end
|
|
166
|
+
end
|
|
167
|
+
end
|
|
@@ -1,7 +1,9 @@
|
|
|
1
1
|
require 'matplotlib/pyplot'
|
|
2
2
|
|
|
3
3
|
module Charty
|
|
4
|
-
class
|
|
4
|
+
class PyPlot < PlotterAdapter
|
|
5
|
+
Name = "pyplot"
|
|
6
|
+
|
|
5
7
|
def initialize
|
|
6
8
|
@plot = Matplotlib::Pyplot
|
|
7
9
|
end
|
|
@@ -58,8 +60,9 @@ module Charty
|
|
|
58
60
|
case context.method
|
|
59
61
|
when :bar
|
|
60
62
|
context.series.each do |data|
|
|
61
|
-
plot.bar(data.xs.to_a.map(&:to_s), data.ys.to_a)
|
|
63
|
+
plot.bar(data.xs.to_a.map(&:to_s), data.ys.to_a, label: data.label)
|
|
62
64
|
end
|
|
65
|
+
plot.legend()
|
|
63
66
|
when :barh
|
|
64
67
|
context.series.each do |data|
|
|
65
68
|
plot.barh(data.xs.to_a.map(&:to_s), data.ys.to_a)
|
|
@@ -68,8 +71,9 @@ module Charty
|
|
|
68
71
|
plot.boxplot(context.data.to_a)
|
|
69
72
|
when :bubble
|
|
70
73
|
context.series.each do |data|
|
|
71
|
-
plot.scatter(data.xs.to_a, data.ys.to_a, s: data.zs.to_a, alpha: 0.5)
|
|
74
|
+
plot.scatter(data.xs.to_a, data.ys.to_a, s: data.zs.to_a, alpha: 0.5, label: data.label)
|
|
72
75
|
end
|
|
76
|
+
plot.legend()
|
|
73
77
|
when :curve
|
|
74
78
|
context.series.each do |data|
|
|
75
79
|
plot.plot(data.xs.to_a, data.ys.to_a)
|
data/lib/charty/plotter.rb
CHANGED
|
@@ -1,22 +1,7 @@
|
|
|
1
1
|
module Charty
|
|
2
2
|
class Plotter
|
|
3
|
-
def initialize(
|
|
4
|
-
@
|
|
5
|
-
when :matplot
|
|
6
|
-
require_relative "matplot"
|
|
7
|
-
Charty::Matplot.new
|
|
8
|
-
when :gruff
|
|
9
|
-
require_relative "gruff"
|
|
10
|
-
Charty::Gruff.new
|
|
11
|
-
when :rubyplot
|
|
12
|
-
require_relative "rubyplot"
|
|
13
|
-
Charty::Rubyplot.new
|
|
14
|
-
when :chartjs
|
|
15
|
-
require_relative "chartjs"
|
|
16
|
-
Charty::Chartjs.new
|
|
17
|
-
else
|
|
18
|
-
raise NotImplementedError
|
|
19
|
-
end
|
|
3
|
+
def initialize(adapter_name)
|
|
4
|
+
@plotter_adapter = PlotterAdapter.create(adapter_name)
|
|
20
5
|
end
|
|
21
6
|
|
|
22
7
|
def table=(data, **kwargs)
|
|
@@ -124,46 +109,46 @@ module Charty
|
|
|
124
109
|
|
|
125
110
|
def bar(**args, &block)
|
|
126
111
|
context = RenderContext.new :bar, **args, &block
|
|
127
|
-
context.apply(@
|
|
112
|
+
context.apply(@plotter_adapter)
|
|
128
113
|
end
|
|
129
114
|
|
|
130
115
|
def barh(**args, &block)
|
|
131
116
|
context = RenderContext.new :barh, **args, &block
|
|
132
|
-
context.apply(@
|
|
117
|
+
context.apply(@plotter_adapter)
|
|
133
118
|
end
|
|
134
119
|
|
|
135
120
|
def box_plot(**args, &block)
|
|
136
121
|
context = RenderContext.new :box_plot, **args, &block
|
|
137
|
-
context.apply(@
|
|
122
|
+
context.apply(@plotter_adapter)
|
|
138
123
|
end
|
|
139
124
|
|
|
140
125
|
def bubble(**args, &block)
|
|
141
126
|
context = RenderContext.new :bubble, **args, &block
|
|
142
|
-
context.apply(@
|
|
127
|
+
context.apply(@plotter_adapter)
|
|
143
128
|
end
|
|
144
129
|
|
|
145
130
|
def curve(**args, &block)
|
|
146
131
|
context = RenderContext.new :curve, **args, &block
|
|
147
|
-
context.apply(@
|
|
132
|
+
context.apply(@plotter_adapter)
|
|
148
133
|
end
|
|
149
134
|
|
|
150
135
|
def scatter(**args, &block)
|
|
151
136
|
context = RenderContext.new :scatter, **args, &block
|
|
152
|
-
context.apply(@
|
|
137
|
+
context.apply(@plotter_adapter)
|
|
153
138
|
end
|
|
154
139
|
|
|
155
140
|
def error_bar(**args, &block)
|
|
156
141
|
context = RenderContext.new :error_bar, **args, &block
|
|
157
|
-
context.apply(@
|
|
142
|
+
context.apply(@plotter_adapter)
|
|
158
143
|
end
|
|
159
144
|
|
|
160
145
|
def hist(**args, &block)
|
|
161
146
|
context = RenderContext.new :hist, **args, &block
|
|
162
|
-
context.apply(@
|
|
147
|
+
context.apply(@plotter_adapter)
|
|
163
148
|
end
|
|
164
149
|
|
|
165
150
|
def layout(definition=:horizontal)
|
|
166
|
-
Layout.new(@
|
|
151
|
+
Layout.new(@plotter_adapter, definition)
|
|
167
152
|
end
|
|
168
153
|
end
|
|
169
154
|
|
|
@@ -240,13 +225,13 @@ module Charty
|
|
|
240
225
|
end
|
|
241
226
|
|
|
242
227
|
def render(filename=nil)
|
|
243
|
-
@
|
|
228
|
+
@plotter_adapter.render(self, filename)
|
|
244
229
|
end
|
|
245
230
|
|
|
246
|
-
def apply(
|
|
231
|
+
def apply(plotter_adapter)
|
|
247
232
|
case
|
|
248
233
|
when !@series.empty?
|
|
249
|
-
|
|
234
|
+
plotter_adapter.series = @series
|
|
250
235
|
when @function
|
|
251
236
|
linspace = Linspace.new(@range[:x], 100)
|
|
252
237
|
# TODO: set label with function
|
|
@@ -254,7 +239,7 @@ module Charty
|
|
|
254
239
|
@series << Series.new(linspace.to_a, linspace.map{|x| @function.call(x) }, label: "function" )
|
|
255
240
|
end
|
|
256
241
|
|
|
257
|
-
@
|
|
242
|
+
@plotter_adapter = plotter_adapter
|
|
258
243
|
self
|
|
259
244
|
end
|
|
260
245
|
end
|
|
@@ -0,0 +1,17 @@
|
|
|
1
|
+
module Charty
|
|
2
|
+
class AdapterNotLoadedError < RuntimeError; end
|
|
3
|
+
|
|
4
|
+
class PlotterAdapter
|
|
5
|
+
def self.inherited(adapter_class)
|
|
6
|
+
@adapters ||= []
|
|
7
|
+
@adapters << adapter_class
|
|
8
|
+
end
|
|
9
|
+
|
|
10
|
+
def self.create(adapter_name)
|
|
11
|
+
require "charty/backends/#{adapter_name}"
|
|
12
|
+
adapter = @adapters.find {|adapter| adapter::Name.to_s == adapter_name.to_s }
|
|
13
|
+
raise AdapterNotLoadedError.new("Adapter for '#{adapter_name}' is not found.") unless adapter
|
|
14
|
+
adapter.new
|
|
15
|
+
end
|
|
16
|
+
end
|
|
17
|
+
end
|
data/lib/charty/version.rb
CHANGED
metadata
CHANGED
|
@@ -1,7 +1,7 @@
|
|
|
1
1
|
--- !ruby/object:Gem::Specification
|
|
2
2
|
name: charty
|
|
3
3
|
version: !ruby/object:Gem::Version
|
|
4
|
-
version: 0.1.
|
|
4
|
+
version: 0.1.4.dev
|
|
5
5
|
platform: ruby
|
|
6
6
|
authors:
|
|
7
7
|
- youchan
|
|
@@ -10,7 +10,7 @@ authors:
|
|
|
10
10
|
autorequire:
|
|
11
11
|
bindir: exe
|
|
12
12
|
cert_chain: []
|
|
13
|
-
date: 2019-
|
|
13
|
+
date: 2019-06-06 00:00:00.000000000 Z
|
|
14
14
|
dependencies:
|
|
15
15
|
- !ruby/object:Gem::Dependency
|
|
16
16
|
name: bundler
|
|
@@ -30,16 +30,30 @@ dependencies:
|
|
|
30
30
|
name: rake
|
|
31
31
|
requirement: !ruby/object:Gem::Requirement
|
|
32
32
|
requirements:
|
|
33
|
-
- - "
|
|
33
|
+
- - ">="
|
|
34
|
+
- !ruby/object:Gem::Version
|
|
35
|
+
version: '0'
|
|
36
|
+
type: :development
|
|
37
|
+
prerelease: false
|
|
38
|
+
version_requirements: !ruby/object:Gem::Requirement
|
|
39
|
+
requirements:
|
|
40
|
+
- - ">="
|
|
34
41
|
- !ruby/object:Gem::Version
|
|
35
|
-
version: '
|
|
42
|
+
version: '0'
|
|
43
|
+
- !ruby/object:Gem::Dependency
|
|
44
|
+
name: test-unit
|
|
45
|
+
requirement: !ruby/object:Gem::Requirement
|
|
46
|
+
requirements:
|
|
47
|
+
- - ">="
|
|
48
|
+
- !ruby/object:Gem::Version
|
|
49
|
+
version: '0'
|
|
36
50
|
type: :development
|
|
37
51
|
prerelease: false
|
|
38
52
|
version_requirements: !ruby/object:Gem::Requirement
|
|
39
53
|
requirements:
|
|
40
|
-
- - "
|
|
54
|
+
- - ">="
|
|
41
55
|
- !ruby/object:Gem::Version
|
|
42
|
-
version: '
|
|
56
|
+
version: '0'
|
|
43
57
|
- !ruby/object:Gem::Dependency
|
|
44
58
|
name: matplotlib
|
|
45
59
|
requirement: !ruby/object:Gem::Requirement
|
|
@@ -54,6 +68,20 @@ dependencies:
|
|
|
54
68
|
- - ">="
|
|
55
69
|
- !ruby/object:Gem::Version
|
|
56
70
|
version: '0'
|
|
71
|
+
- !ruby/object:Gem::Dependency
|
|
72
|
+
name: gruff
|
|
73
|
+
requirement: !ruby/object:Gem::Requirement
|
|
74
|
+
requirements:
|
|
75
|
+
- - ">="
|
|
76
|
+
- !ruby/object:Gem::Version
|
|
77
|
+
version: '0'
|
|
78
|
+
type: :development
|
|
79
|
+
prerelease: false
|
|
80
|
+
version_requirements: !ruby/object:Gem::Requirement
|
|
81
|
+
requirements:
|
|
82
|
+
- - ">="
|
|
83
|
+
- !ruby/object:Gem::Version
|
|
84
|
+
version: '0'
|
|
57
85
|
description: Visualizing your data in a simple way.
|
|
58
86
|
email:
|
|
59
87
|
- youchan01@gmail.com
|
|
@@ -64,6 +92,8 @@ extensions: []
|
|
|
64
92
|
extra_rdoc_files: []
|
|
65
93
|
files:
|
|
66
94
|
- ".gitignore"
|
|
95
|
+
- ".travis.yml"
|
|
96
|
+
- Dockerfile.dev
|
|
67
97
|
- Gemfile
|
|
68
98
|
- LICENSE
|
|
69
99
|
- README.md
|
|
@@ -78,36 +108,39 @@ files:
|
|
|
78
108
|
- examples/iris_dataset.ipynb
|
|
79
109
|
- examples/nmatrix.ipynb
|
|
80
110
|
- examples/numo-narray.ipynb
|
|
111
|
+
- examples/sample_google_chart.ipynb
|
|
81
112
|
- examples/sample_gruff.ipynb
|
|
82
113
|
- examples/sample_images/bar_gruff.png
|
|
83
|
-
- examples/sample_images/
|
|
114
|
+
- examples/sample_images/bar_pyplot.png
|
|
84
115
|
- examples/sample_images/bar_rubyplot.png
|
|
85
|
-
- examples/sample_images/
|
|
86
|
-
- examples/sample_images/
|
|
87
|
-
- examples/sample_images/
|
|
116
|
+
- examples/sample_images/barh_pyplot.png
|
|
117
|
+
- examples/sample_images/boxplot_pyplot.png
|
|
118
|
+
- examples/sample_images/bubble_pyplot.png
|
|
88
119
|
- examples/sample_images/bubble_rubyplot.png
|
|
89
120
|
- examples/sample_images/curve_gruff.png
|
|
90
|
-
- examples/sample_images/
|
|
121
|
+
- examples/sample_images/curve_pyplot.png
|
|
91
122
|
- examples/sample_images/curve_rubyplot.png
|
|
92
|
-
- examples/sample_images/
|
|
123
|
+
- examples/sample_images/curve_with_function_pyplot.png
|
|
93
124
|
- examples/sample_images/curve_with_function_rubyplot.png
|
|
94
|
-
- examples/sample_images/
|
|
95
|
-
- examples/sample_images/
|
|
125
|
+
- examples/sample_images/errorbar_pyplot.png
|
|
126
|
+
- examples/sample_images/hist_pyplot.png
|
|
96
127
|
- examples/sample_images/scatter_gruff.png
|
|
97
|
-
- examples/sample_images/
|
|
128
|
+
- examples/sample_images/scatter_pyplot.png
|
|
98
129
|
- examples/sample_images/scatter_rubyplot.png
|
|
99
|
-
- examples/sample_images/
|
|
100
|
-
- examples/sample_images/
|
|
101
|
-
- examples/
|
|
130
|
+
- examples/sample_images/subplot2_pyplot.png
|
|
131
|
+
- examples/sample_images/subplot_pyplot.png
|
|
132
|
+
- examples/sample_pyplot.ipynb
|
|
102
133
|
- examples/sample_rubyplot.ipynb
|
|
103
134
|
- images/design_concept.png
|
|
104
135
|
- lib/charty.rb
|
|
105
|
-
- lib/charty/
|
|
136
|
+
- lib/charty/backends/google_chart.rb
|
|
137
|
+
- lib/charty/backends/gruff.rb
|
|
138
|
+
- lib/charty/backends/pyplot.rb
|
|
139
|
+
- lib/charty/backends/rubyplot.rb
|
|
106
140
|
- lib/charty/layout.rb
|
|
107
141
|
- lib/charty/linspace.rb
|
|
108
|
-
- lib/charty/matplot.rb
|
|
109
142
|
- lib/charty/plotter.rb
|
|
110
|
-
- lib/charty/
|
|
143
|
+
- lib/charty/plotter_adapter.rb
|
|
111
144
|
- lib/charty/table.rb
|
|
112
145
|
- lib/charty/version.rb
|
|
113
146
|
homepage: https://github.com/red-data-tools/charty
|