charty 0.1.1.dev
This diff represents the content of publicly available package versions that have been released to one of the supported registries. The information contained in this diff is provided for informational purposes only and reflects changes between package versions as they appear in their respective public registries.
- checksums.yaml +7 -0
- data/.gitignore +62 -0
- data/Gemfile +6 -0
- data/LICENSE +21 -0
- data/LICENSE.txt +21 -0
- data/README.md +388 -0
- data/Rakefile +2 -0
- data/bin/console +14 -0
- data/bin/setup +8 -0
- data/charty.gemspec +31 -0
- data/examples/Gemfile +29 -0
- data/examples/active_record.ipynb +281 -0
- data/examples/daru.ipynb +308 -0
- data/examples/nmatrix.ipynb +242 -0
- data/examples/numo-narray.ipynb +245 -0
- data/examples/sample_gruff.ipynb +465 -0
- data/examples/sample_images/bar_gruff.png +0 -0
- data/examples/sample_images/bar_matplot.png +0 -0
- data/examples/sample_images/bar_rubyplot.png +0 -0
- data/examples/sample_images/boxplot_matplot.png +0 -0
- data/examples/sample_images/bubble_matplot.png +0 -0
- data/examples/sample_images/bubble_rubyplot.png +0 -0
- data/examples/sample_images/curve_gruff.png +0 -0
- data/examples/sample_images/curve_matplot.png +0 -0
- data/examples/sample_images/curve_rubyplot.png +0 -0
- data/examples/sample_images/curve_with_function_matplot.png +0 -0
- data/examples/sample_images/curve_with_function_rubyplot.png +0 -0
- data/examples/sample_images/errorbar_matplot.png +0 -0
- data/examples/sample_images/hist_matplot.png +0 -0
- data/examples/sample_images/scatter_gruff.png +0 -0
- data/examples/sample_images/scatter_matplot.png +0 -0
- data/examples/sample_images/scatter_rubyplot.png +0 -0
- data/examples/sample_images/subplot2_matplot.png +0 -0
- data/examples/sample_images/subplot_matplot.png +0 -0
- data/examples/sample_matplotlib.ipynb +372 -0
- data/examples/sample_rubyplot.ipynb +432 -0
- data/images/design_concept.png +0 -0
- data/lib/charty.rb +12 -0
- data/lib/charty/gruff.rb +75 -0
- data/lib/charty/layout.rb +75 -0
- data/lib/charty/linspace.rb +21 -0
- data/lib/charty/matplot.rb +91 -0
- data/lib/charty/plotter.rb +241 -0
- data/lib/charty/rubyplot.rb +90 -0
- data/lib/charty/table.rb +41 -0
- data/lib/charty/version.rb +9 -0
- metadata +120 -0
checksums.yaml
ADDED
|
@@ -0,0 +1,7 @@
|
|
|
1
|
+
---
|
|
2
|
+
SHA256:
|
|
3
|
+
metadata.gz: bb9fdb9e499c1493700ffba1db8561e29e26eddbc8842d394b5e6ac26ccf7a1f
|
|
4
|
+
data.tar.gz: 0f05d86efa78d95d7c7b20e8369e18acec052a81565b030d9e69d050a7b09009
|
|
5
|
+
SHA512:
|
|
6
|
+
metadata.gz: 43f1f5663637f044b95b32f3600478933f0ceb5b6b75869577af9e04361893fc08a6a1ed69c3c8d3a35d22074ee9069a350faeb3f4547844a203c75e25b92cc4
|
|
7
|
+
data.tar.gz: 4a5851e82336d73dbbf838f5451350ccbb1f951008bd5b2cd2a7538f15bff4ce3ecdd6e73d1a3ac4d5cd7d545a84ff5bf6b27d3888030a1f4c81c01b04a617f9
|
data/.gitignore
ADDED
|
@@ -0,0 +1,62 @@
|
|
|
1
|
+
*.gem
|
|
2
|
+
*.rbc
|
|
3
|
+
/.config
|
|
4
|
+
/coverage/
|
|
5
|
+
/InstalledFiles
|
|
6
|
+
/pkg/
|
|
7
|
+
/spec/reports/
|
|
8
|
+
/spec/examples.txt
|
|
9
|
+
/test/tmp/
|
|
10
|
+
/test/version_tmp/
|
|
11
|
+
/tmp/
|
|
12
|
+
|
|
13
|
+
# Used by dotenv library to load environment variables.
|
|
14
|
+
# .env
|
|
15
|
+
|
|
16
|
+
## Specific to RubyMotion:
|
|
17
|
+
.dat*
|
|
18
|
+
.repl_history
|
|
19
|
+
build/
|
|
20
|
+
*.bridgesupport
|
|
21
|
+
build-iPhoneOS/
|
|
22
|
+
build-iPhoneSimulator/
|
|
23
|
+
|
|
24
|
+
## Specific to RubyMotion (use of CocoaPods):
|
|
25
|
+
#
|
|
26
|
+
# We recommend against adding the Pods directory to your .gitignore. However
|
|
27
|
+
# you should judge for yourself, the pros and cons are mentioned at:
|
|
28
|
+
# https://guides.cocoapods.org/using/using-cocoapods.html#should-i-check-the-pods-directory-into-source-control
|
|
29
|
+
#
|
|
30
|
+
# vendor/Pods/
|
|
31
|
+
|
|
32
|
+
## Documentation cache and generated files:
|
|
33
|
+
/.yardoc/
|
|
34
|
+
/_yardoc/
|
|
35
|
+
/doc/
|
|
36
|
+
/rdoc/
|
|
37
|
+
|
|
38
|
+
## Environment normalization:
|
|
39
|
+
/.bundle/
|
|
40
|
+
/vendor/bundle
|
|
41
|
+
/lib/bundler/man/
|
|
42
|
+
|
|
43
|
+
# for a library or gem, you might want to ignore these files since the code is
|
|
44
|
+
# intended to run in multiple environments; otherwise, check them in:
|
|
45
|
+
Gemfile.lock
|
|
46
|
+
.ruby-version
|
|
47
|
+
.ruby-gemset
|
|
48
|
+
|
|
49
|
+
# unless supporting rvm < 1.11.0 or doing something fancy, ignore this:
|
|
50
|
+
.rvmrc
|
|
51
|
+
|
|
52
|
+
# Jupyter notebook
|
|
53
|
+
.ipynb_checkpoints/
|
|
54
|
+
|
|
55
|
+
# Python
|
|
56
|
+
__pycache__/
|
|
57
|
+
|
|
58
|
+
# Object files
|
|
59
|
+
*.bundle
|
|
60
|
+
*.so
|
|
61
|
+
*.o
|
|
62
|
+
*.pyc
|
data/Gemfile
ADDED
data/LICENSE
ADDED
|
@@ -0,0 +1,21 @@
|
|
|
1
|
+
MIT License
|
|
2
|
+
|
|
3
|
+
Copyright (c) 2018 Red Data Tools
|
|
4
|
+
|
|
5
|
+
Permission is hereby granted, free of charge, to any person obtaining a copy
|
|
6
|
+
of this software and associated documentation files (the "Software"), to deal
|
|
7
|
+
in the Software without restriction, including without limitation the rights
|
|
8
|
+
to use, copy, modify, merge, publish, distribute, sublicense, and/or sell
|
|
9
|
+
copies of the Software, and to permit persons to whom the Software is
|
|
10
|
+
furnished to do so, subject to the following conditions:
|
|
11
|
+
|
|
12
|
+
The above copyright notice and this permission notice shall be included in all
|
|
13
|
+
copies or substantial portions of the Software.
|
|
14
|
+
|
|
15
|
+
THE SOFTWARE IS PROVIDED "AS IS", WITHOUT WARRANTY OF ANY KIND, EXPRESS OR
|
|
16
|
+
IMPLIED, INCLUDING BUT NOT LIMITED TO THE WARRANTIES OF MERCHANTABILITY,
|
|
17
|
+
FITNESS FOR A PARTICULAR PURPOSE AND NONINFRINGEMENT. IN NO EVENT SHALL THE
|
|
18
|
+
AUTHORS OR COPYRIGHT HOLDERS BE LIABLE FOR ANY CLAIM, DAMAGES OR OTHER
|
|
19
|
+
LIABILITY, WHETHER IN AN ACTION OF CONTRACT, TORT OR OTHERWISE, ARISING FROM,
|
|
20
|
+
OUT OF OR IN CONNECTION WITH THE SOFTWARE OR THE USE OR OTHER DEALINGS IN THE
|
|
21
|
+
SOFTWARE.
|
data/LICENSE.txt
ADDED
|
@@ -0,0 +1,21 @@
|
|
|
1
|
+
The MIT License (MIT)
|
|
2
|
+
|
|
3
|
+
Copyright (c) 2018 youchan
|
|
4
|
+
|
|
5
|
+
Permission is hereby granted, free of charge, to any person obtaining a copy
|
|
6
|
+
of this software and associated documentation files (the "Software"), to deal
|
|
7
|
+
in the Software without restriction, including without limitation the rights
|
|
8
|
+
to use, copy, modify, merge, publish, distribute, sublicense, and/or sell
|
|
9
|
+
copies of the Software, and to permit persons to whom the Software is
|
|
10
|
+
furnished to do so, subject to the following conditions:
|
|
11
|
+
|
|
12
|
+
The above copyright notice and this permission notice shall be included in
|
|
13
|
+
all copies or substantial portions of the Software.
|
|
14
|
+
|
|
15
|
+
THE SOFTWARE IS PROVIDED "AS IS", WITHOUT WARRANTY OF ANY KIND, EXPRESS OR
|
|
16
|
+
IMPLIED, INCLUDING BUT NOT LIMITED TO THE WARRANTIES OF MERCHANTABILITY,
|
|
17
|
+
FITNESS FOR A PARTICULAR PURPOSE AND NONINFRINGEMENT. IN NO EVENT SHALL THE
|
|
18
|
+
AUTHORS OR COPYRIGHT HOLDERS BE LIABLE FOR ANY CLAIM, DAMAGES OR OTHER
|
|
19
|
+
LIABILITY, WHETHER IN AN ACTION OF CONTRACT, TORT OR OTHERWISE, ARISING FROM,
|
|
20
|
+
OUT OF OR IN CONNECTION WITH THE SOFTWARE OR THE USE OR OTHER DEALINGS IN
|
|
21
|
+
THE SOFTWARE.
|
data/README.md
ADDED
|
@@ -0,0 +1,388 @@
|
|
|
1
|
+
# Charty - Visualizing your data in Ruby
|
|
2
|
+
|
|
3
|
+
Charty is open-source Ruby library for visualizing your data in a simple way.
|
|
4
|
+
In Charty, you need to write very few lines of code for representing what you want to do.
|
|
5
|
+
It lets you focus on your analysis of data, instead of plotting.
|
|
6
|
+
|
|
7
|
+

|
|
8
|
+
|
|
9
|
+
## Installation
|
|
10
|
+
|
|
11
|
+
To be described later.
|
|
12
|
+
|
|
13
|
+
## Usage
|
|
14
|
+
|
|
15
|
+
```ruby
|
|
16
|
+
require 'charty'
|
|
17
|
+
charty = Charty.new(:matplot)
|
|
18
|
+
|
|
19
|
+
bar = charty.bar do
|
|
20
|
+
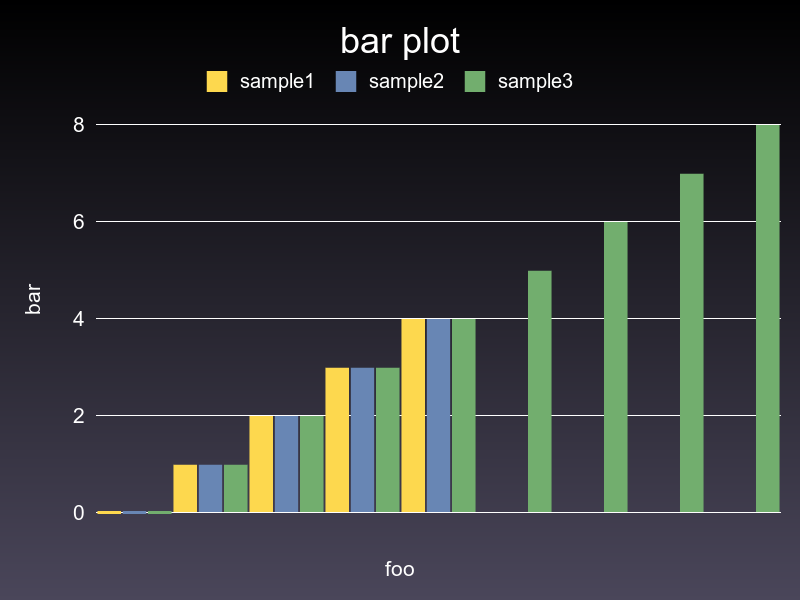
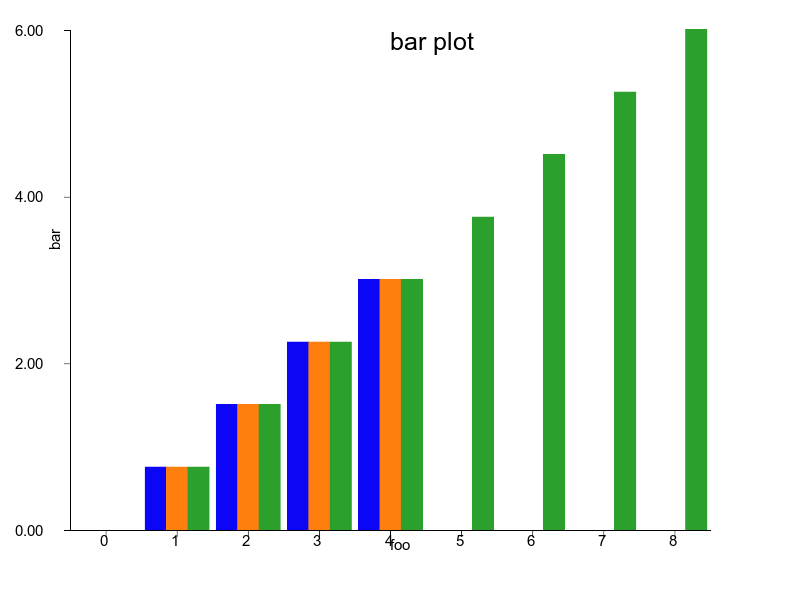
series [0,1,2,3,4], [10,40,20,90,70]
|
|
21
|
+
series [0,1,2,3,4], [90,80,70,60,50]
|
|
22
|
+
series [0,1,2,3,4,5,6,7,8], [50,60,20,30,10, 90, 0, 100, 50]
|
|
23
|
+
range x: 0..10, y: 1..100
|
|
24
|
+
xlabel 'foo'
|
|
25
|
+
ylabel 'bar'
|
|
26
|
+
title 'bar plot'
|
|
27
|
+
end
|
|
28
|
+
bar.render("sample_images/bar_matplot.png")
|
|
29
|
+
```
|
|
30
|
+
|
|
31
|
+
Charty also supports Daru::DataFrame, Numo::NArray, NMatrix and ActiveRecord as Data Abstraction Layer.
|
|
32
|
+
For example.
|
|
33
|
+
|
|
34
|
+
```ruby
|
|
35
|
+
require 'charty'
|
|
36
|
+
charty = Charty::Plotter.new(:matplot)
|
|
37
|
+
|
|
38
|
+
|
|
39
|
+
### when Daru::DataFrame
|
|
40
|
+
require 'daru'
|
|
41
|
+
df = Daru::DataFrame.new({'a':[1,2,3,4], 'b':[4,5,6,7], 'c':[8, 9, 10, 11]})
|
|
42
|
+
charty.table = df
|
|
43
|
+
|
|
44
|
+
|
|
45
|
+
### when Numo::NArray
|
|
46
|
+
require "numo/narray"
|
|
47
|
+
narray = Numo::DFloat.new(3,5).seq
|
|
48
|
+
charty.table = narray
|
|
49
|
+
|
|
50
|
+
|
|
51
|
+
### when NMatrix
|
|
52
|
+
require "nmatrix"
|
|
53
|
+
nmatrix = NMatrix.new([3, 4], [0, 1, 2, 3, 4, 5, 6, 7, 8, 9, 10, 11], dtype: :int64)
|
|
54
|
+
charty.table = nmatrix
|
|
55
|
+
|
|
56
|
+
|
|
57
|
+
### when ActiveRecord
|
|
58
|
+
require "active_record"
|
|
59
|
+
ActiveRecord::Base.establish_connection(adapter: "sqlite3", database: ":memory:")
|
|
60
|
+
ActiveRecord::Schema.define do
|
|
61
|
+
create_table :foos do |t|
|
|
62
|
+
t.integer :price
|
|
63
|
+
t.integer :sales
|
|
64
|
+
end
|
|
65
|
+
end
|
|
66
|
+
class Foo < ActiveRecord::Base
|
|
67
|
+
end
|
|
68
|
+
100.times{|i| Foo.create!(price: 10 * i, sales: (1..100).to_a.sample) }
|
|
69
|
+
sales = Foo.where("sales >= 40")
|
|
70
|
+
charty.table = sales
|
|
71
|
+
|
|
72
|
+
|
|
73
|
+
bar = charty.to_bar(:price, :sales)
|
|
74
|
+
bar.render('sample')
|
|
75
|
+
|
|
76
|
+
boxplot = charty.to_boxplot(:price, :sales)
|
|
77
|
+
boxplot.render('sample')
|
|
78
|
+
|
|
79
|
+
bubble = charty.to_bubble(:price, :sales, :id)
|
|
80
|
+
bubble.render('sample')
|
|
81
|
+
|
|
82
|
+
curve = charty.to_curve(:price, :sales)
|
|
83
|
+
curve.render('sample')
|
|
84
|
+
|
|
85
|
+
scatter = charty.to_scatter(:price, :sales)
|
|
86
|
+
scatter.render('sample')
|
|
87
|
+
|
|
88
|
+
errorbar = charty.to_errorbar(:price, :sales)
|
|
89
|
+
errorbar.render('sample')
|
|
90
|
+
|
|
91
|
+
hst= charty.to_hst(:price, :sales)
|
|
92
|
+
hst.render('sample')
|
|
93
|
+
```
|
|
94
|
+
|
|
95
|
+
## Examples
|
|
96
|
+
|
|
97
|
+
create an instance of the library you want to use.
|
|
98
|
+
|
|
99
|
+
```ruby
|
|
100
|
+
require 'charty'
|
|
101
|
+
|
|
102
|
+
# when you want to use matplotlib
|
|
103
|
+
charty = Charty.new(:matplot)
|
|
104
|
+
|
|
105
|
+
# when you want to use gruff
|
|
106
|
+
charty = Charty.new(:gruff)
|
|
107
|
+
|
|
108
|
+
# when you wanto to use rubyplot
|
|
109
|
+
charty = Charty.new(:rubyplot)
|
|
110
|
+
```
|
|
111
|
+
|
|
112
|
+
### Bar
|
|
113
|
+
|
|
114
|
+
```ruby
|
|
115
|
+
bar = charty.bar do
|
|
116
|
+
series [0,1,2,3,4], [10,40,20,90,70]
|
|
117
|
+
series [0,1,2,3,4], [90,80,70,60,50]
|
|
118
|
+
series [0,1,2,3,4,5,6,7,8], [50,60,20,30,10, 90, 0, 100, 50]
|
|
119
|
+
range x: 0..10, y: 1..100
|
|
120
|
+
xlabel 'foo'
|
|
121
|
+
ylabel 'bar'
|
|
122
|
+
title 'bar plot'
|
|
123
|
+
end
|
|
124
|
+
bar.render("sample_images/bar_matplot.png")
|
|
125
|
+
```
|
|
126
|
+
|
|
127
|
+
#### Matplotlib
|
|
128
|
+
|
|
129
|
+

|
|
130
|
+
|
|
131
|
+
#### Gruff
|
|
132
|
+
|
|
133
|
+
|
|
134
|
+
|
|
135
|
+
#### Rubyplot
|
|
136
|
+
|
|
137
|
+
|
|
138
|
+
|
|
139
|
+
### Curve
|
|
140
|
+
|
|
141
|
+
```ruby
|
|
142
|
+
curve2 = charty.curve do
|
|
143
|
+
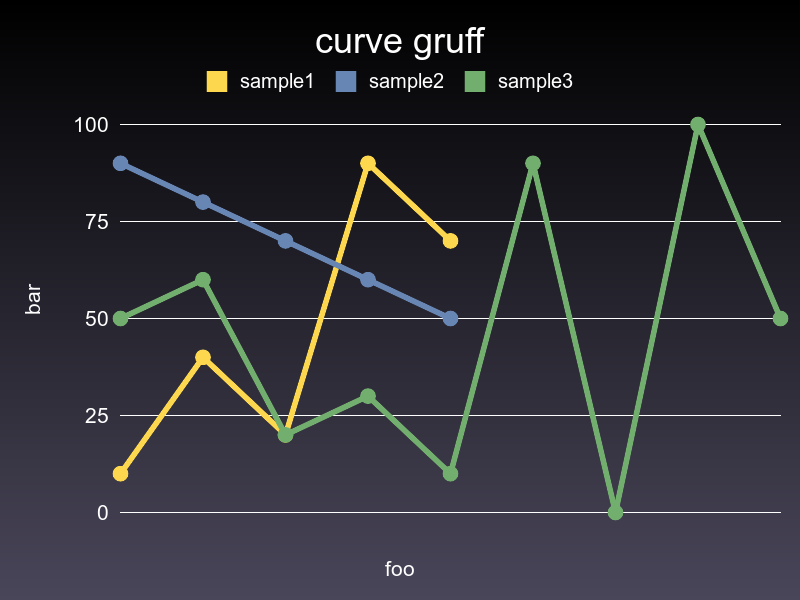
series [0,1,2,3,4], [10,40,20,90,70]
|
|
144
|
+
series [0,1,2,3,4], [90,80,70,60,50]
|
|
145
|
+
series [0,1,2,3,4,5,6,7,8], [50,60,20,30,10, 90, 0, 100, 50]
|
|
146
|
+
range x: 0..10, y: 1..100
|
|
147
|
+
xlabel 'foo'
|
|
148
|
+
ylabel 'bar'
|
|
149
|
+
end
|
|
150
|
+
curve2.render("sample_images/curve_matplot.png")
|
|
151
|
+
```
|
|
152
|
+
|
|
153
|
+
#### Matplotlib
|
|
154
|
+
|
|
155
|
+

|
|
156
|
+
|
|
157
|
+
#### Gruff
|
|
158
|
+
|
|
159
|
+
|
|
160
|
+
|
|
161
|
+
#### Rubyplot
|
|
162
|
+
|
|
163
|
+
|
|
164
|
+
|
|
165
|
+
### Curve with function
|
|
166
|
+
|
|
167
|
+
```ruby
|
|
168
|
+
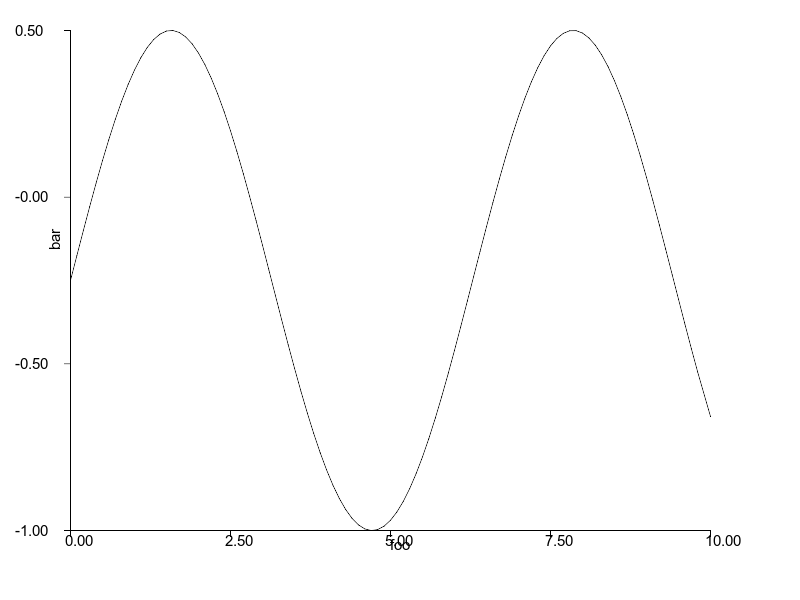
curve = charty.curve do
|
|
169
|
+
function {|x| Math.sin(x) }
|
|
170
|
+
range x: 0..10, y: -1..1
|
|
171
|
+
xlabel 'foo'
|
|
172
|
+
ylabel 'bar'
|
|
173
|
+
end
|
|
174
|
+
curve.render("sample_images/curve_with_function_matplot.png")
|
|
175
|
+
```
|
|
176
|
+
|
|
177
|
+
#### Matplotlib
|
|
178
|
+
|
|
179
|
+

|
|
180
|
+
|
|
181
|
+
#### Gruff
|
|
182
|
+
|
|
183
|
+
Not supported
|
|
184
|
+
|
|
185
|
+
#### Rubyplot
|
|
186
|
+
|
|
187
|
+
|
|
188
|
+
|
|
189
|
+
### Box plot
|
|
190
|
+
|
|
191
|
+
```ruby
|
|
192
|
+
boxplot = charty.boxplot do
|
|
193
|
+
data [[60,70,80,70,50], [100,40,20,80,70], [30, 10]]
|
|
194
|
+
range x: 0..10, y: 1..100
|
|
195
|
+
xlabel 'foo'
|
|
196
|
+
ylabel 'bar'
|
|
197
|
+
title 'box plot'
|
|
198
|
+
end
|
|
199
|
+
boxplot.render("sample_images/boxplot_matplot.png")
|
|
200
|
+
```
|
|
201
|
+
|
|
202
|
+
#### Matplotlib
|
|
203
|
+
|
|
204
|
+

|
|
205
|
+
|
|
206
|
+
#### Gruff
|
|
207
|
+
|
|
208
|
+
Not supported
|
|
209
|
+
|
|
210
|
+
#### Rubyplot
|
|
211
|
+
|
|
212
|
+
Not supported
|
|
213
|
+
|
|
214
|
+
### Scatter
|
|
215
|
+
|
|
216
|
+
```ruby
|
|
217
|
+
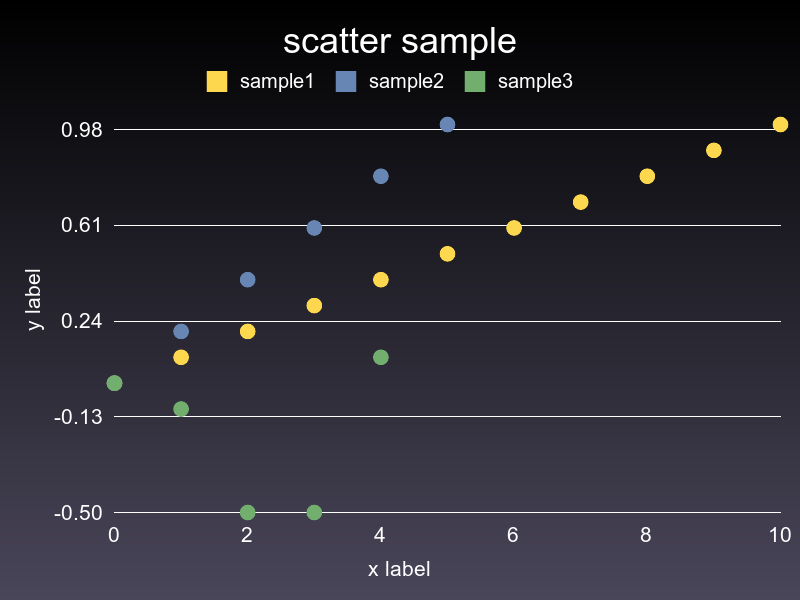
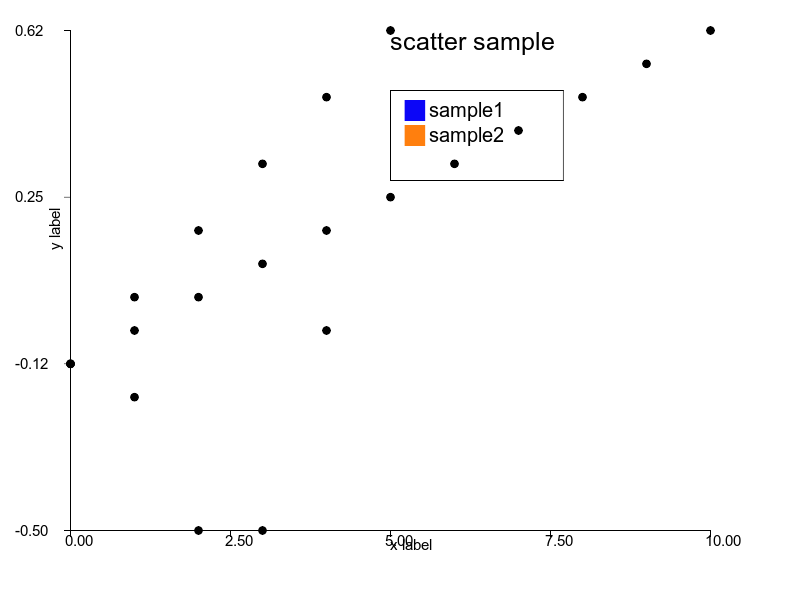
scatter = charty.scatter do
|
|
218
|
+
series 0..10, (0..1).step(0.1), label: 'sample1'
|
|
219
|
+
series 0..5, (0..1).step(0.2), label: 'sample2'
|
|
220
|
+
series [0, 1, 2, 3, 4], [0, -0.1, -0.5, -0.5, 0.1]
|
|
221
|
+
range x: 0..10, y: -1..1
|
|
222
|
+
# xlabel 'x label'
|
|
223
|
+
# xlabel ''
|
|
224
|
+
ylabel 'y label'
|
|
225
|
+
title 'scatter sample'
|
|
226
|
+
end
|
|
227
|
+
scatter.render("sample_images/scatter_matplot.png")
|
|
228
|
+
```
|
|
229
|
+
|
|
230
|
+
#### Matplotlib
|
|
231
|
+
|
|
232
|
+

|
|
233
|
+
|
|
234
|
+
#### Gruff
|
|
235
|
+
|
|
236
|
+
|
|
237
|
+
|
|
238
|
+
#### Rubyplot
|
|
239
|
+
|
|
240
|
+
|
|
241
|
+
|
|
242
|
+
### Errorbar
|
|
243
|
+
|
|
244
|
+
```ruby
|
|
245
|
+
errorbar = charty.errorbar do
|
|
246
|
+
series [1,2,3,4], [1,4,9,16], xerr: [0.5,1.0,1.5,0.3], yerr: [0.6,0.2,0.8,0.1], label: 'label1'
|
|
247
|
+
series [1,2,3,4], [16,9,4,1], label: 'label2'
|
|
248
|
+
series [1,2,3,4,5,6,7,8], [14,14,14,14,14,14,14,14], label: 'label2', xerr: [0.5,1.0,1.5,0.3, 1.1, 1.2, 1.3, 1.4]
|
|
249
|
+
range x: 0..10, y: -1..20
|
|
250
|
+
xlabel 'x label'
|
|
251
|
+
title 'errorbar'
|
|
252
|
+
end
|
|
253
|
+
errorbar.render("sample_images/errorbar_matplot.png")
|
|
254
|
+
```
|
|
255
|
+
|
|
256
|
+
#### Matplotlib
|
|
257
|
+
|
|
258
|
+

|
|
259
|
+
|
|
260
|
+
#### Gruff
|
|
261
|
+
|
|
262
|
+
Not supported
|
|
263
|
+
|
|
264
|
+
#### Rubyplot
|
|
265
|
+
|
|
266
|
+
Not supported
|
|
267
|
+
|
|
268
|
+
### Bubble chart
|
|
269
|
+
|
|
270
|
+
```ruby
|
|
271
|
+
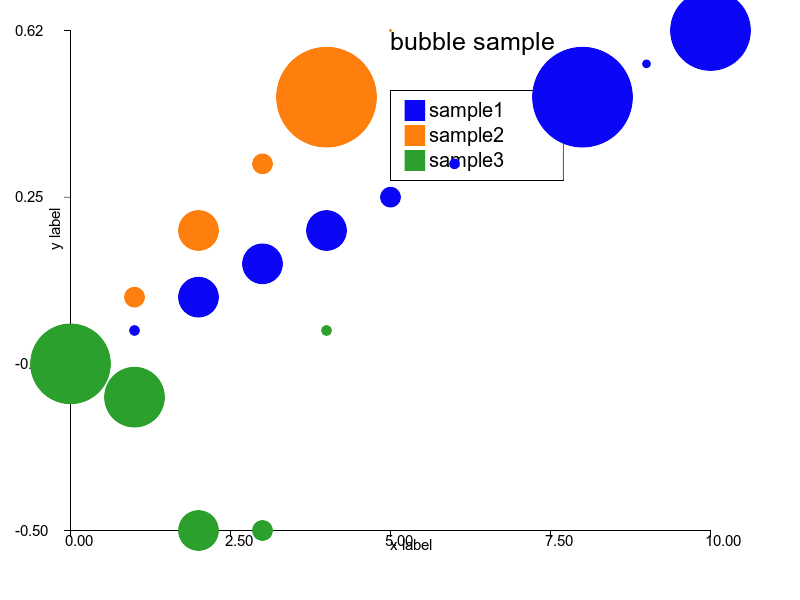
bubble = charty.bubble do
|
|
272
|
+
series 0..10, (0..1).step(0.1), [10, 100, 1000, 20, 200, 2000, 5, 50, 500, 4, 40], label: 'sample1'
|
|
273
|
+
series 0..5, (0..1).step(0.2), [1, 10, 100, 1000, 500, 100], label: 'sample2'
|
|
274
|
+
series [0, 1, 2, 3, 4], [0, -0.1, -0.5, -0.5, 0.1], [40, 30, 200, 10, 5]
|
|
275
|
+
range x: 0..10, y: -1..1
|
|
276
|
+
xlabel 'x label'
|
|
277
|
+
ylabel 'y label'
|
|
278
|
+
title 'bubble sample'
|
|
279
|
+
end
|
|
280
|
+
bubble.render("sample_images/bubble_matplot.png")
|
|
281
|
+
```
|
|
282
|
+
|
|
283
|
+
#### Matplotlib
|
|
284
|
+
|
|
285
|
+

|
|
286
|
+
|
|
287
|
+
#### Gruff
|
|
288
|
+
|
|
289
|
+
Not supported
|
|
290
|
+
|
|
291
|
+
#### Rubyplot
|
|
292
|
+
|
|
293
|
+
|
|
294
|
+
|
|
295
|
+
### Histogram
|
|
296
|
+
|
|
297
|
+
```ruby
|
|
298
|
+
hist = charty.hist do
|
|
299
|
+
data [[10, 10, 20, 30, 40, 40,40,40,40,40, 50, 10, 10, 10], [100, 100, 100, 100, 90, 90, 80, 30, 30, 30, 30, 30]]
|
|
300
|
+
range x: 0..100, y: 0..7
|
|
301
|
+
xlabel 'x label'
|
|
302
|
+
ylabel 'y label'
|
|
303
|
+
title 'histogram sample'
|
|
304
|
+
end
|
|
305
|
+
hist.render("sample_images/hist_matplot.png")
|
|
306
|
+
```
|
|
307
|
+
|
|
308
|
+
#### Matplotlib
|
|
309
|
+
|
|
310
|
+

|
|
311
|
+
|
|
312
|
+
#### Gruff
|
|
313
|
+
|
|
314
|
+
Not supported
|
|
315
|
+
|
|
316
|
+
#### Rubyplot
|
|
317
|
+
|
|
318
|
+
Not supported
|
|
319
|
+
|
|
320
|
+
### Subplots
|
|
321
|
+
|
|
322
|
+
```ruby
|
|
323
|
+
layout = charty.layout
|
|
324
|
+
layout << curve
|
|
325
|
+
layout << scatter
|
|
326
|
+
layout.render("sample_images/subplot_matplot.png")
|
|
327
|
+
```
|
|
328
|
+
|
|
329
|
+
#### Matplotlib
|
|
330
|
+
|
|
331
|
+

|
|
332
|
+
|
|
333
|
+
#### Gruff
|
|
334
|
+
|
|
335
|
+
Not supported
|
|
336
|
+
|
|
337
|
+
#### Rubyplot
|
|
338
|
+
|
|
339
|
+
Not supported
|
|
340
|
+
|
|
341
|
+
### Subplots 2
|
|
342
|
+
|
|
343
|
+
```ruby
|
|
344
|
+
curve_list = [0.5, 0.75].map do |f|
|
|
345
|
+
charty.curve(f:f) do
|
|
346
|
+
function {|x| Math.sin(f*x) }
|
|
347
|
+
range x: 0..10, y: -1..1
|
|
348
|
+
end
|
|
349
|
+
end
|
|
350
|
+
|
|
351
|
+
scatter_list = [-0.5, 0.5].map do |f|
|
|
352
|
+
charty.scatter(f: f) do
|
|
353
|
+
series Charty::Linspace.new(0..10, 20), Charty::Linspace.new(0..f, 20)
|
|
354
|
+
range x: 0..10, y: -1..1
|
|
355
|
+
end
|
|
356
|
+
end
|
|
357
|
+
|
|
358
|
+
grid_layout = charty.layout(:grid2x2)
|
|
359
|
+
grid_layout << curve_list
|
|
360
|
+
grid_layout << scatter_list
|
|
361
|
+
grid_layout.render("sample_images/subplot2_matplot.png")
|
|
362
|
+
```
|
|
363
|
+
|
|
364
|
+
#### Matplotlib
|
|
365
|
+
|
|
366
|
+

|
|
367
|
+
|
|
368
|
+
#### Gruff
|
|
369
|
+
|
|
370
|
+
Not supported
|
|
371
|
+
|
|
372
|
+
#### Rubyplot
|
|
373
|
+
|
|
374
|
+
Not supported
|
|
375
|
+
|
|
376
|
+
|
|
377
|
+
## Acknowledgements
|
|
378
|
+
|
|
379
|
+
- The concepts of this library is borrowed from Python's [HoloViews](http://holoviews.org/) and Julia's [Plots ecosystem](https://juliaplots.github.io/).
|
|
380
|
+
|
|
381
|
+
## Authors
|
|
382
|
+
|
|
383
|
+
- Kenta Murata \<mrkn@mrkn.jp\>
|
|
384
|
+
- Kazuma Furuhashi \<k.furuhashi10@gmail.com\>
|
|
385
|
+
|
|
386
|
+
## License
|
|
387
|
+
|
|
388
|
+
MIT License
|