chartx 0.0.1
This diff represents the content of publicly available package versions that have been released to one of the supported registries. The information contained in this diff is provided for informational purposes only and reflects changes between package versions as they appear in their respective public registries.
- data/.gitignore +17 -0
- data/.gitmodules +3 -0
- data/Gemfile +4 -0
- data/LICENSE.txt +22 -0
- data/README.md +145 -0
- data/Rakefile +1 -0
- data/chartx.gemspec +40 -0
- data/lib/chartx/engine.rb +11 -0
- data/lib/chartx/helper.rb +184 -0
- data/lib/chartx/version.rb +3 -0
- data/lib/chartx.rb +3 -0
- data/screenshots/barchart.png +0 -0
- data/screenshots/bulletchart.png +0 -0
- data/screenshots/horizontalbarchart.png +0 -0
- data/screenshots/linechart.png +0 -0
- data/screenshots/linewithfocuschart.png +0 -0
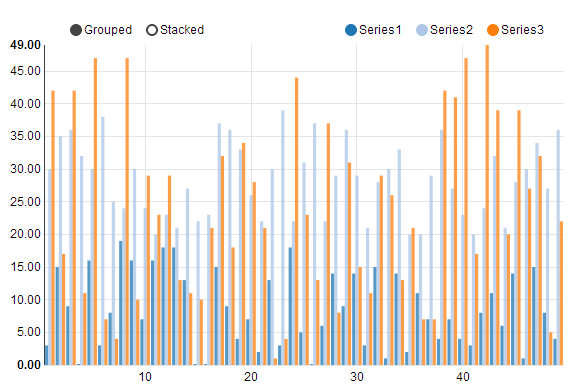
- data/screenshots/multibarchart2.png +0 -0
- data/screenshots/piechart.png +0 -0
- data/screenshots/scatterchart.png +0 -0
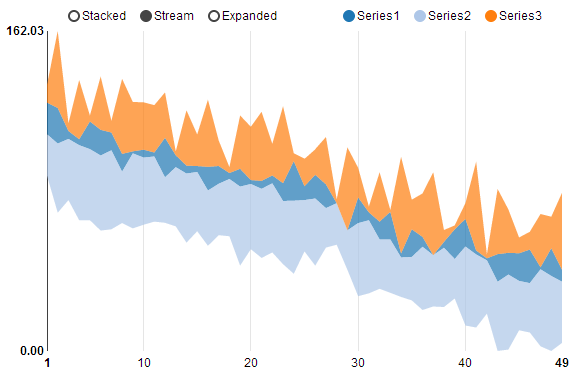
- data/screenshots/stackedareachart.png +0 -0
- data/screenshots/stackedareachart3.png +0 -0
- data/vendor/assets/javascripts/chartx-core.js +9 -0
- data/vendor/assets/javascripts/chartx-models.js +2 -0
- data/vendor/assets/javascripts/nvd3/.gitignore +27 -0
- data/vendor/assets/javascripts/nvd3/.jshintrc +3 -0
- data/vendor/assets/javascripts/nvd3/LICENSE.md +49 -0
- data/vendor/assets/javascripts/nvd3/README.md +1 -0
- data/vendor/assets/javascripts/nvd3/lib/cie.js +155 -0
- data/vendor/assets/javascripts/nvd3/lib/crossfilter.js +1180 -0
- data/vendor/assets/javascripts/nvd3/lib/crossfilter.min.js +1 -0
- data/vendor/assets/javascripts/nvd3/lib/d3.js +8798 -0
- data/vendor/assets/javascripts/nvd3/lib/d3.min.js +5 -0
- data/vendor/assets/javascripts/nvd3/lib/fisheye.js +86 -0
- data/vendor/assets/javascripts/nvd3/lib/hive.js +80 -0
- data/vendor/assets/javascripts/nvd3/lib/horizon.js +192 -0
- data/vendor/assets/javascripts/nvd3/lib/sankey.js +292 -0
- data/vendor/assets/javascripts/nvd3/nv.d3.js +13048 -0
- data/vendor/assets/javascripts/nvd3/nv.d3.min.js +6 -0
- data/vendor/assets/javascripts/nvd3/src/core.js +118 -0
- data/vendor/assets/javascripts/nvd3/src/intro.js +1 -0
- data/vendor/assets/javascripts/nvd3/src/models/axis.js +398 -0
- data/vendor/assets/javascripts/nvd3/src/models/boilerplate.js +102 -0
- data/vendor/assets/javascripts/nvd3/src/models/bullet.js +377 -0
- data/vendor/assets/javascripts/nvd3/src/models/bulletChart.js +341 -0
- data/vendor/assets/javascripts/nvd3/src/models/cumulativeLineChart.js +685 -0
- data/vendor/assets/javascripts/nvd3/src/models/discreteBar.js +327 -0
- data/vendor/assets/javascripts/nvd3/src/models/discreteBarChart.js +290 -0
- data/vendor/assets/javascripts/nvd3/src/models/distribution.js +146 -0
- data/vendor/assets/javascripts/nvd3/src/models/historicalBar.js +289 -0
- data/vendor/assets/javascripts/nvd3/src/models/historicalBarChart.js +421 -0
- data/vendor/assets/javascripts/nvd3/src/models/indentedTree.js +317 -0
- data/vendor/assets/javascripts/nvd3/src/models/legend.js +207 -0
- data/vendor/assets/javascripts/nvd3/src/models/line.js +284 -0
- data/vendor/assets/javascripts/nvd3/src/models/lineChart.js +421 -0
- data/vendor/assets/javascripts/nvd3/src/models/linePlusBarChart.js +455 -0
- data/vendor/assets/javascripts/nvd3/src/models/linePlusBarWithFocusChart.js +665 -0
- data/vendor/assets/javascripts/nvd3/src/models/lineWithFisheye.js +197 -0
- data/vendor/assets/javascripts/nvd3/src/models/lineWithFisheyeChart.js +319 -0
- data/vendor/assets/javascripts/nvd3/src/models/lineWithFocusChart.js +560 -0
- data/vendor/assets/javascripts/nvd3/src/models/multiBar.js +442 -0
- data/vendor/assets/javascripts/nvd3/src/models/multiBarChart.js +506 -0
- data/vendor/assets/javascripts/nvd3/src/models/multiBarHorizontal.js +420 -0
- data/vendor/assets/javascripts/nvd3/src/models/multiBarHorizontalChart.js +448 -0
- data/vendor/assets/javascripts/nvd3/src/models/multiBarTimeSeries.js +371 -0
- data/vendor/assets/javascripts/nvd3/src/models/multiBarTimeSeriesChart.js +403 -0
- data/vendor/assets/javascripts/nvd3/src/models/multiChart.js +444 -0
- data/vendor/assets/javascripts/nvd3/src/models/ohlcBar.js +365 -0
- data/vendor/assets/javascripts/nvd3/src/models/parallelCoordinates.js +238 -0
- data/vendor/assets/javascripts/nvd3/src/models/pie.js +386 -0
- data/vendor/assets/javascripts/nvd3/src/models/pieChart.js +302 -0
- data/vendor/assets/javascripts/nvd3/src/models/scatter.js +660 -0
- data/vendor/assets/javascripts/nvd3/src/models/scatterChart.js +614 -0
- data/vendor/assets/javascripts/nvd3/src/models/scatterPlusLineChart.js +610 -0
- data/vendor/assets/javascripts/nvd3/src/models/sparkline.js +179 -0
- data/vendor/assets/javascripts/nvd3/src/models/sparklinePlus.js +293 -0
- data/vendor/assets/javascripts/nvd3/src/models/stackedArea.js +336 -0
- data/vendor/assets/javascripts/nvd3/src/models/stackedAreaChart.js +490 -0
- data/vendor/assets/javascripts/nvd3/src/nv.d3.css +704 -0
- data/vendor/assets/javascripts/nvd3/src/outro.js +1 -0
- data/vendor/assets/javascripts/nvd3/src/tooltip.js +133 -0
- data/vendor/assets/javascripts/nvd3/src/utils.js +118 -0
- data/vendor/assets/javascripts/set-env.js.erb +1 -0
- data/vendor/assets/stylesheets/chartx.css +3 -0
- metadata +189 -0
data/.gitignore
ADDED
data/.gitmodules
ADDED
data/Gemfile
ADDED
data/LICENSE.txt
ADDED
|
@@ -0,0 +1,22 @@
|
|
|
1
|
+
Copyright (c) 2013 Xianheng Ma
|
|
2
|
+
|
|
3
|
+
MIT License
|
|
4
|
+
|
|
5
|
+
Permission is hereby granted, free of charge, to any person obtaining
|
|
6
|
+
a copy of this software and associated documentation files (the
|
|
7
|
+
"Software"), to deal in the Software without restriction, including
|
|
8
|
+
without limitation the rights to use, copy, modify, merge, publish,
|
|
9
|
+
distribute, sublicense, and/or sell copies of the Software, and to
|
|
10
|
+
permit persons to whom the Software is furnished to do so, subject to
|
|
11
|
+
the following conditions:
|
|
12
|
+
|
|
13
|
+
The above copyright notice and this permission notice shall be
|
|
14
|
+
included in all copies or substantial portions of the Software.
|
|
15
|
+
|
|
16
|
+
THE SOFTWARE IS PROVIDED "AS IS", WITHOUT WARRANTY OF ANY KIND,
|
|
17
|
+
EXPRESS OR IMPLIED, INCLUDING BUT NOT LIMITED TO THE WARRANTIES OF
|
|
18
|
+
MERCHANTABILITY, FITNESS FOR A PARTICULAR PURPOSE AND
|
|
19
|
+
NONINFRINGEMENT. IN NO EVENT SHALL THE AUTHORS OR COPYRIGHT HOLDERS BE
|
|
20
|
+
LIABLE FOR ANY CLAIM, DAMAGES OR OTHER LIABILITY, WHETHER IN AN ACTION
|
|
21
|
+
OF CONTRACT, TORT OR OTHERWISE, ARISING FROM, OUT OF OR IN CONNECTION
|
|
22
|
+
WITH THE SOFTWARE OR THE USE OR OTHER DEALINGS IN THE SOFTWARE.
|
data/README.md
ADDED
|
@@ -0,0 +1,145 @@
|
|
|
1
|
+
# Chartx
|
|
2
|
+
|
|
3
|
+
Chartx is a Ruby gem helps you to develop fancy interactive data visualizations with one line of Ruby code!:)
|
|
4
|
+
It's a ruby wrapper of nvd3, which is an attempt to build re-usable charts and chart components for d3.js without taking away the power that d3.js gives you.
|
|
5
|
+
|
|
6
|
+
## Installation
|
|
7
|
+
|
|
8
|
+
To include Chartx into your rails project, add this line to your application's Gemfile:
|
|
9
|
+
|
|
10
|
+
gem 'chartx'
|
|
11
|
+
|
|
12
|
+
And then execute:
|
|
13
|
+
|
|
14
|
+
$ bundle install
|
|
15
|
+
|
|
16
|
+
To add the necessary javascript files into your asset pipeline add
|
|
17
|
+
|
|
18
|
+
//= require chartx
|
|
19
|
+
|
|
20
|
+
in ```app/assets/javascripts/application.js```
|
|
21
|
+
|
|
22
|
+
If you only need a subset of models e.g. lineChart you can add
|
|
23
|
+
|
|
24
|
+
//= require nvd3/lib/d3.v2
|
|
25
|
+
//= require nvd3/src/core
|
|
26
|
+
//= require nvd3/src/tooltip
|
|
27
|
+
//= require nvd3/src/utils.js
|
|
28
|
+
//= require nvd3/src/models/lineChart
|
|
29
|
+
//= require nvd3/src/models/legend.js
|
|
30
|
+
//= require nvd3/src/models/axis.js
|
|
31
|
+
//= require nvd3/src/models/scatter.js
|
|
32
|
+
//= require nvd3/src/models/line.js
|
|
33
|
+
|
|
34
|
+
to your ```application.js```. All the models can be found in https://github.com/xianhengma/nvd3/tree/chartx-branch/src/models
|
|
35
|
+
|
|
36
|
+
## Examples
|
|
37
|
+
|
|
38
|
+
Pie Chart:
|
|
39
|
+
|
|
40
|
+
```erb
|
|
41
|
+
<%= pie_chart @pie_data %>
|
|
42
|
+
```
|
|
43
|
+

|
|
44
|
+
|
|
45
|
+
Line Chart:
|
|
46
|
+
|
|
47
|
+
```erb
|
|
48
|
+
<%= line_chart @line_data %>
|
|
49
|
+
```
|
|
50
|
+

|
|
51
|
+
|
|
52
|
+
Discrete Bar Chart:
|
|
53
|
+
```erb
|
|
54
|
+
<%= discrete_bar_chart @discrete_bar_data %>
|
|
55
|
+
```
|
|
56
|
+

|
|
57
|
+
|
|
58
|
+
Line Chart with Focus (View Finder):
|
|
59
|
+
```erb
|
|
60
|
+
<%= line_with_focus_chart @line_with_focus_data %>
|
|
61
|
+
```
|
|
62
|
+
|
|
63
|
+
|
|
64
|
+
Scatter Chart:
|
|
65
|
+
```erb
|
|
66
|
+
<%= scatter_chart @scatter_data %>
|
|
67
|
+
```
|
|
68
|
+
|
|
69
|
+
|
|
70
|
+
Bullet Chart:
|
|
71
|
+
```erb
|
|
72
|
+
<%= bullet_chart @bullet_data %>
|
|
73
|
+
```
|
|
74
|
+
|
|
75
|
+
|
|
76
|
+
Stacked Area Bar Chart:
|
|
77
|
+
```erb
|
|
78
|
+
<%= stacked_area_chart @stacked_area_data %>
|
|
79
|
+
```
|
|
80
|
+
|
|
81
|
+
|
|
82
|
+
|
|
83
|
+
|
|
84
|
+
Multi Bar Chart:
|
|
85
|
+
```erb
|
|
86
|
+
<%= multi_bar_chart @multi_bar_data %>
|
|
87
|
+
```
|
|
88
|
+
|
|
89
|
+
|
|
90
|
+
Multi Horizontal Bar Chart:
|
|
91
|
+
```erb
|
|
92
|
+
<%= multi_bar_horizontal_chart @multi_bar_horizontal_data %>
|
|
93
|
+
```
|
|
94
|
+

|
|
95
|
+
|
|
96
|
+
## Data Format
|
|
97
|
+
|
|
98
|
+
Data for Chartx (except Pie Chart) are in the following format:
|
|
99
|
+
|
|
100
|
+
```js
|
|
101
|
+
@data = [
|
|
102
|
+
{
|
|
103
|
+
:key => "<Series name>",
|
|
104
|
+
:color => "<CSS color>"
|
|
105
|
+
:values => [
|
|
106
|
+
{:label => 0, :value => 10},
|
|
107
|
+
{:label => 1, :value => 20},
|
|
108
|
+
{:label => 2, :value => 30}
|
|
109
|
+
....
|
|
110
|
+
]
|
|
111
|
+
},
|
|
112
|
+
{
|
|
113
|
+
key: "<Series name>"
|
|
114
|
+
...
|
|
115
|
+
}
|
|
116
|
+
]
|
|
117
|
+
```
|
|
118
|
+
|
|
119
|
+
Data for Pie Chart is in the following format:
|
|
120
|
+
|
|
121
|
+
```js
|
|
122
|
+
@data = [
|
|
123
|
+
{
|
|
124
|
+
:label => "<name1>",
|
|
125
|
+
:value => 31
|
|
126
|
+
},
|
|
127
|
+
{
|
|
128
|
+
:label => "<name2>",
|
|
129
|
+
:value => 31
|
|
130
|
+
|
|
131
|
+
},
|
|
132
|
+
{
|
|
133
|
+
...
|
|
134
|
+
}
|
|
135
|
+
|
|
136
|
+
]
|
|
137
|
+
```
|
|
138
|
+
|
|
139
|
+
## Contributing
|
|
140
|
+
|
|
141
|
+
1. Fork it
|
|
142
|
+
2. Create your feature branch (`git checkout -b my-new-feature`)
|
|
143
|
+
3. Commit your changes (`git commit -am 'Add some feature'`)
|
|
144
|
+
4. Push to the branch (`git push origin my-new-feature`)
|
|
145
|
+
5. Create new Pull Request
|
data/Rakefile
ADDED
|
@@ -0,0 +1 @@
|
|
|
1
|
+
require "bundler/gem_tasks"
|
data/chartx.gemspec
ADDED
|
@@ -0,0 +1,40 @@
|
|
|
1
|
+
# coding: utf-8
|
|
2
|
+
lib = File.expand_path('../lib', __FILE__)
|
|
3
|
+
$LOAD_PATH.unshift(lib) unless $LOAD_PATH.include?(lib)
|
|
4
|
+
require 'chartx/version'
|
|
5
|
+
|
|
6
|
+
Gem::Specification.new do |spec|
|
|
7
|
+
spec.name = "chartx"
|
|
8
|
+
spec.version = Chartx::VERSION
|
|
9
|
+
spec.platform = Gem::Platform::RUBY
|
|
10
|
+
spec.authors = ["Xianheng Ma"]
|
|
11
|
+
spec.email = ["xianheng.ma@gmail.com"]
|
|
12
|
+
spec.description = "Generate beautiful charts in rails"
|
|
13
|
+
spec.summary = "Generate beautiful charts in rails"
|
|
14
|
+
spec.homepage = ""
|
|
15
|
+
spec.license = "MIT"
|
|
16
|
+
|
|
17
|
+
spec.files = `git ls-files`.split($/)
|
|
18
|
+
spec.executables = spec.files.grep(%r{^bin/}) { |f| File.basename(f) }
|
|
19
|
+
spec.require_paths = ["lib"]
|
|
20
|
+
|
|
21
|
+
spec.add_development_dependency "bundler", "~> 1.3"
|
|
22
|
+
spec.add_development_dependency "rake"
|
|
23
|
+
spec.add_dependency "railties", ">= 3.2.0", "< 5.0"
|
|
24
|
+
|
|
25
|
+
`git submodule --quiet foreach pwd`.split($\).each do |sub_path|
|
|
26
|
+
Dir.chdir(sub_path) do
|
|
27
|
+
|
|
28
|
+
sub_files = `git ls-files`.split($\)
|
|
29
|
+
sub_files_fullpaths = sub_files.map do |filename|
|
|
30
|
+
"#{sub_path}/#{filename}"
|
|
31
|
+
end
|
|
32
|
+
|
|
33
|
+
sub_files_paths = sub_files_fullpaths.map do |filename|
|
|
34
|
+
filename.gsub "#{File.dirname(__FILE__)}/", ""
|
|
35
|
+
end
|
|
36
|
+
|
|
37
|
+
spec.files += sub_files_paths
|
|
38
|
+
end
|
|
39
|
+
end
|
|
40
|
+
end
|
|
@@ -0,0 +1,184 @@
|
|
|
1
|
+
require "json"
|
|
2
|
+
require "erb"
|
|
3
|
+
|
|
4
|
+
module Chartx
|
|
5
|
+
module Helper
|
|
6
|
+
|
|
7
|
+
#pie_chart has different input data format LoL
|
|
8
|
+
#TODO: fix the input data format
|
|
9
|
+
def pie_chart(data_source, options = {})
|
|
10
|
+
chartx "pie", data_source, options
|
|
11
|
+
end
|
|
12
|
+
|
|
13
|
+
def discrete_bar_chart(data_source, options = {})
|
|
14
|
+
chartx "discrete_bar", data_source, options
|
|
15
|
+
end
|
|
16
|
+
|
|
17
|
+
def multi_bar_chart(data_source, options = {})
|
|
18
|
+
chartx "multi_bar", data_source, options
|
|
19
|
+
end
|
|
20
|
+
|
|
21
|
+
def multi_bar_horizontal_chart(data_source, options = {})
|
|
22
|
+
chartx "multi_bar_horizontal", data_source, options
|
|
23
|
+
end
|
|
24
|
+
|
|
25
|
+
def line_chart(data_source, options = {})
|
|
26
|
+
chartx "line", data_source, options
|
|
27
|
+
end
|
|
28
|
+
|
|
29
|
+
def line_with_focus_chart(data_source, options = {})
|
|
30
|
+
chartx "line_with_focus", data_source, options
|
|
31
|
+
end
|
|
32
|
+
|
|
33
|
+
def scatter_chart(data_source, options = {})
|
|
34
|
+
chartx "scatter", data_source, options
|
|
35
|
+
end
|
|
36
|
+
|
|
37
|
+
def stacked_area_chart(data_source, options = {})
|
|
38
|
+
chartx "stacked_area", data_source, options
|
|
39
|
+
end
|
|
40
|
+
|
|
41
|
+
def bullet_chart(data_source, options = {})
|
|
42
|
+
chartx "bullet", data_source, options
|
|
43
|
+
end
|
|
44
|
+
|
|
45
|
+
def chartx(chart_type, data_source, options, &block)
|
|
46
|
+
|
|
47
|
+
options = options.dup
|
|
48
|
+
@chartx_id ||= 0
|
|
49
|
+
|
|
50
|
+
height = options.delete(:height) || "600"
|
|
51
|
+
width = options.delete(:width) || "600"
|
|
52
|
+
elem_id = options.delete(:id) || "chart-#{@chartx_id += 1}"
|
|
53
|
+
|
|
54
|
+
x_name = options.delete(:x_name) || "label"
|
|
55
|
+
y_name = options.delete(:y_name) || "value"
|
|
56
|
+
|
|
57
|
+
stagger_labels = options.delete(:stagger_labels) || true
|
|
58
|
+
show_tooltips = options.delete(:show_tooltips) || false
|
|
59
|
+
show_values = options.delete(:show_values) || false
|
|
60
|
+
show_labels = options.delete(:show_labels) || true
|
|
61
|
+
color = options.delete(:color) || "category10"
|
|
62
|
+
show_controls = options.delete(:show_controls) || false
|
|
63
|
+
|
|
64
|
+
show_dist_x = options.delete(:show_x_dist) || true
|
|
65
|
+
show_dist_y = options.delete(:show_y_dist) || true
|
|
66
|
+
|
|
67
|
+
x_axis_format = options.delete(:x_axis_format) || ',f'
|
|
68
|
+
y_axis_format = options.delete(:y_axis_format) || ',.2f'
|
|
69
|
+
y2_axis_format = options.delete(:y2_axis_format) || '.2f'
|
|
70
|
+
|
|
71
|
+
clip_edge = options.delete(:clip_edge) || true
|
|
72
|
+
|
|
73
|
+
case chart_type
|
|
74
|
+
when "discrete_bar"
|
|
75
|
+
chart_str = "var chart = nv.models.discreteBarChart()
|
|
76
|
+
.x(function(d) { return d.#{x_name} })
|
|
77
|
+
.y(function(d) { return d.#{y_name} })
|
|
78
|
+
.staggerLabels(#{stagger_labels})
|
|
79
|
+
.tooltips(#{show_tooltips})
|
|
80
|
+
.showValues(#{show_values})
|
|
81
|
+
.width(#{width})
|
|
82
|
+
.height(#{height});"
|
|
83
|
+
|
|
84
|
+
when "pie"
|
|
85
|
+
data_source = [data_source] # bug of nvd3
|
|
86
|
+
chart_str = "var chart = nv.models.pieChart()
|
|
87
|
+
.x(function(d) { return d.#{x_name} })
|
|
88
|
+
.y(function(d) { return d.#{y_name} })
|
|
89
|
+
.values(function(d) { return d })
|
|
90
|
+
.color(d3.scale.#{color}().range())
|
|
91
|
+
.width(#{width})
|
|
92
|
+
.height(#{height});"
|
|
93
|
+
|
|
94
|
+
when "multi_bar"
|
|
95
|
+
chart_str = "var chart = nv.models.multiBarChart()
|
|
96
|
+
.width(#{width})
|
|
97
|
+
.height(#{height});
|
|
98
|
+
chart.xAxis.tickFormat(d3.format('#{x_axis_format}'));
|
|
99
|
+
chart.yAxis.tickFormat(d3.format('#{y_axis_format}'));"
|
|
100
|
+
|
|
101
|
+
when "line"
|
|
102
|
+
chart_str = "var chart = nv.models.lineChart()
|
|
103
|
+
.width(#{width})
|
|
104
|
+
.height(#{height});
|
|
105
|
+
chart.xAxis.tickFormat(d3.format('#{x_axis_format}'));
|
|
106
|
+
chart.yAxis.tickFormat(d3.format('#{y_axis_format}'));"
|
|
107
|
+
|
|
108
|
+
when "multi_bar_horizontal"
|
|
109
|
+
chart_str = "var chart = nv.models.multiBarHorizontalChart()
|
|
110
|
+
.x(function(d) { return d.#{x_name} })
|
|
111
|
+
.y(function(d) { return d.#{y_name} })
|
|
112
|
+
.showValues(#{show_values})
|
|
113
|
+
.tooltips(#{show_tooltips})
|
|
114
|
+
.showControls(#{show_controls})
|
|
115
|
+
.width(#{width})
|
|
116
|
+
.height(#{height});
|
|
117
|
+
chart.yAxis.tickFormat(d3.format('#{x_axis_format}'));"
|
|
118
|
+
|
|
119
|
+
when "line_with_focus"
|
|
120
|
+
chart_str = "var chart = nv.models.lineWithFocusChart()
|
|
121
|
+
.width(#{width})
|
|
122
|
+
.height(#{height});
|
|
123
|
+
chart.xAxis.tickFormat(d3.format('#{x_axis_format}'));
|
|
124
|
+
chart.yAxis.tickFormat(d3.format('#{y_axis_format}'));
|
|
125
|
+
chart.y2Axis.tickFormat(d3.format('#{y2_axis_format}'));"
|
|
126
|
+
|
|
127
|
+
when "scatter"
|
|
128
|
+
chart_str = "chart = nv.models.scatterChart()
|
|
129
|
+
.showDistX(#{show_dist_x})
|
|
130
|
+
.showDistY(#{show_dist_y})
|
|
131
|
+
.useVoronoi(true)
|
|
132
|
+
.color(d3.scale.category10().range())
|
|
133
|
+
.width(#{width})
|
|
134
|
+
.height(#{height});
|
|
135
|
+
chart.xAxis.tickFormat(d3.format('#{x_axis_format}'));
|
|
136
|
+
chart.yAxis.tickFormat(d3.format('#{y_axis_format}'));"
|
|
137
|
+
|
|
138
|
+
when "stacked_area"
|
|
139
|
+
chart_str = "var chart = nv.models.stackedAreaChart()
|
|
140
|
+
.x(function(d) { return d.#{x_name} })
|
|
141
|
+
.y(function(d) { return d.#{y_name} })
|
|
142
|
+
.clipEdge(#{clip_edge})
|
|
143
|
+
.width(#{width})
|
|
144
|
+
.height(#{height});
|
|
145
|
+
chart.xAxis.tickFormat(d3.format('#{x_axis_format}'));
|
|
146
|
+
chart.yAxis.tickFormat(d3.format('#{y_axis_format}'));"
|
|
147
|
+
|
|
148
|
+
when "bullet"
|
|
149
|
+
chart_str = "var chart = nv.models.bulletChart();"
|
|
150
|
+
end
|
|
151
|
+
|
|
152
|
+
html = <<HTML
|
|
153
|
+
<div id="#{ERB::Util.html_escape(elem_id)}" style="height: #{ERB::Util.html_escape(height)}px;">
|
|
154
|
+
<svg></svg>
|
|
155
|
+
</div>
|
|
156
|
+
HTML
|
|
157
|
+
|
|
158
|
+
js = <<JS
|
|
159
|
+
<script type="text/javascript">
|
|
160
|
+
nv.addGraph(function() {
|
|
161
|
+
#{chart_str}
|
|
162
|
+
|
|
163
|
+
d3.select("##{elem_id} svg")
|
|
164
|
+
.datum(#{data_source.to_json})
|
|
165
|
+
.transition().duration(500)
|
|
166
|
+
.call(chart);
|
|
167
|
+
|
|
168
|
+
return chart;
|
|
169
|
+
});
|
|
170
|
+
</script>
|
|
171
|
+
JS
|
|
172
|
+
|
|
173
|
+
if options[:content_for]
|
|
174
|
+
content_for(options[:content_for]) { js.respond_to?(:html_safe) ? js.html_safe : js }
|
|
175
|
+
else
|
|
176
|
+
html += js
|
|
177
|
+
end
|
|
178
|
+
|
|
179
|
+
html.respond_to?(:html_safe) ? html.html_safe : html
|
|
180
|
+
|
|
181
|
+
end
|
|
182
|
+
|
|
183
|
+
end
|
|
184
|
+
end
|
data/lib/chartx.rb
ADDED
|
Binary file
|
|
Binary file
|
|
Binary file
|
|
Binary file
|
|
Binary file
|
|
Binary file
|
|
Binary file
|
|
Binary file
|
|
Binary file
|
|
Binary file
|
|
@@ -0,0 +1,9 @@
|
|
|
1
|
+
// This is a manifest file that'll be compiled into chartx-core.js, which will include all the files
|
|
2
|
+
// listed below.
|
|
3
|
+
// Please make sure you include this file before using Chartx
|
|
4
|
+
//
|
|
5
|
+
|
|
6
|
+
//= require ./nvd3/lib/d3.min
|
|
7
|
+
//= require ./nvd3/nv.d3.min
|
|
8
|
+
//= require ./nvd3/src/utils.js
|
|
9
|
+
//= require set-env.js.erb
|
|
@@ -0,0 +1,27 @@
|
|
|
1
|
+
|
|
2
|
+
# Jekyll Files #
|
|
3
|
+
################
|
|
4
|
+
_site
|
|
5
|
+
|
|
6
|
+
|
|
7
|
+
# Random Files #
|
|
8
|
+
################
|
|
9
|
+
*.swp
|
|
10
|
+
*~
|
|
11
|
+
*.log
|
|
12
|
+
|
|
13
|
+
|
|
14
|
+
# Private Test Data #
|
|
15
|
+
#####################
|
|
16
|
+
*REALDATA*
|
|
17
|
+
|
|
18
|
+
|
|
19
|
+
# OS generated files #
|
|
20
|
+
######################
|
|
21
|
+
.DS_Store*
|
|
22
|
+
ehthumbs.db
|
|
23
|
+
Icon?
|
|
24
|
+
Thumbs.db
|
|
25
|
+
# nodejs packages #
|
|
26
|
+
######################
|
|
27
|
+
node_modules
|
|
@@ -0,0 +1,49 @@
|
|
|
1
|
+
|
|
2
|
+
##nvd3.js License
|
|
3
|
+
|
|
4
|
+
Copyright (c) 2011, 2012 [Novus Partners, Inc.][novus]
|
|
5
|
+
|
|
6
|
+
Licensed under the Apache License, Version 2.0 (the "License");
|
|
7
|
+
you may not use this file except in compliance with the License.
|
|
8
|
+
You may obtain a copy of the License at
|
|
9
|
+
|
|
10
|
+
http://www.apache.org/licenses/LICENSE-2.0
|
|
11
|
+
|
|
12
|
+
Unless required by applicable law or agreed to in writing, software
|
|
13
|
+
distributed under the License is distributed on an "AS IS" BASIS,
|
|
14
|
+
WITHOUT WARRANTIES OR CONDITIONS OF ANY KIND, either express or implied.
|
|
15
|
+
See the License for the specific language governing permissions and
|
|
16
|
+
limitations under the License.
|
|
17
|
+
|
|
18
|
+
[novus]: https://www.novus.com/
|
|
19
|
+
|
|
20
|
+
|
|
21
|
+
|
|
22
|
+
##d3.js License
|
|
23
|
+
|
|
24
|
+
Copyright (c) 2012, Michael Bostock
|
|
25
|
+
All rights reserved.
|
|
26
|
+
|
|
27
|
+
Redistribution and use in source and binary forms, with or without
|
|
28
|
+
modification, are permitted provided that the following conditions are met:
|
|
29
|
+
|
|
30
|
+
* Redistributions of source code must retain the above copyright notice, this
|
|
31
|
+
list of conditions and the following disclaimer.
|
|
32
|
+
|
|
33
|
+
* Redistributions in binary form must reproduce the above copyright notice,
|
|
34
|
+
this list of conditions and the following disclaimer in the documentation
|
|
35
|
+
and/or other materials provided with the distribution.
|
|
36
|
+
|
|
37
|
+
* The name Michael Bostock may not be used to endorse or promote products
|
|
38
|
+
derived from this software without specific prior written permission.
|
|
39
|
+
|
|
40
|
+
THIS SOFTWARE IS PROVIDED BY THE COPYRIGHT HOLDERS AND CONTRIBUTORS "AS IS"
|
|
41
|
+
AND ANY EXPRESS OR IMPLIED WARRANTIES, INCLUDING, BUT NOT LIMITED TO, THE
|
|
42
|
+
IMPLIED WARRANTIES OF MERCHANTABILITY AND FITNESS FOR A PARTICULAR PURPOSE ARE
|
|
43
|
+
DISCLAIMED. IN NO EVENT SHALL MICHAEL BOSTOCK BE LIABLE FOR ANY DIRECT,
|
|
44
|
+
INDIRECT, INCIDENTAL, SPECIAL, EXEMPLARY, OR CONSEQUENTIAL DAMAGES (INCLUDING,
|
|
45
|
+
BUT NOT LIMITED TO, PROCUREMENT OF SUBSTITUTE GOODS OR SERVICES; LOSS OF USE,
|
|
46
|
+
DATA, OR PROFITS; OR BUSINESS INTERRUPTION) HOWEVER CAUSED AND ON ANY THEORY
|
|
47
|
+
OF LIABILITY, WHETHER IN CONTRACT, STRICT LIABILITY, OR TORT (INCLUDING
|
|
48
|
+
NEGLIGENCE OR OTHERWISE) ARISING IN ANY WAY OUT OF THE USE OF THIS SOFTWARE,
|
|
49
|
+
EVEN IF ADVISED OF THE POSSIBILITY OF SUCH DAMAGE.
|
|
@@ -0,0 +1 @@
|
|
|
1
|
+
This is a branch for Chartx.
|