ziptrend 0.1.0__tar.gz
This diff represents the content of publicly available package versions that have been released to one of the supported registries. The information contained in this diff is provided for informational purposes only and reflects changes between package versions as they appear in their respective public registries.
- ziptrend-0.1.0/LICENSE +21 -0
- ziptrend-0.1.0/PKG-INFO +131 -0
- ziptrend-0.1.0/README.md +94 -0
- ziptrend-0.1.0/pyproject.toml +51 -0
- ziptrend-0.1.0/setup.cfg +4 -0
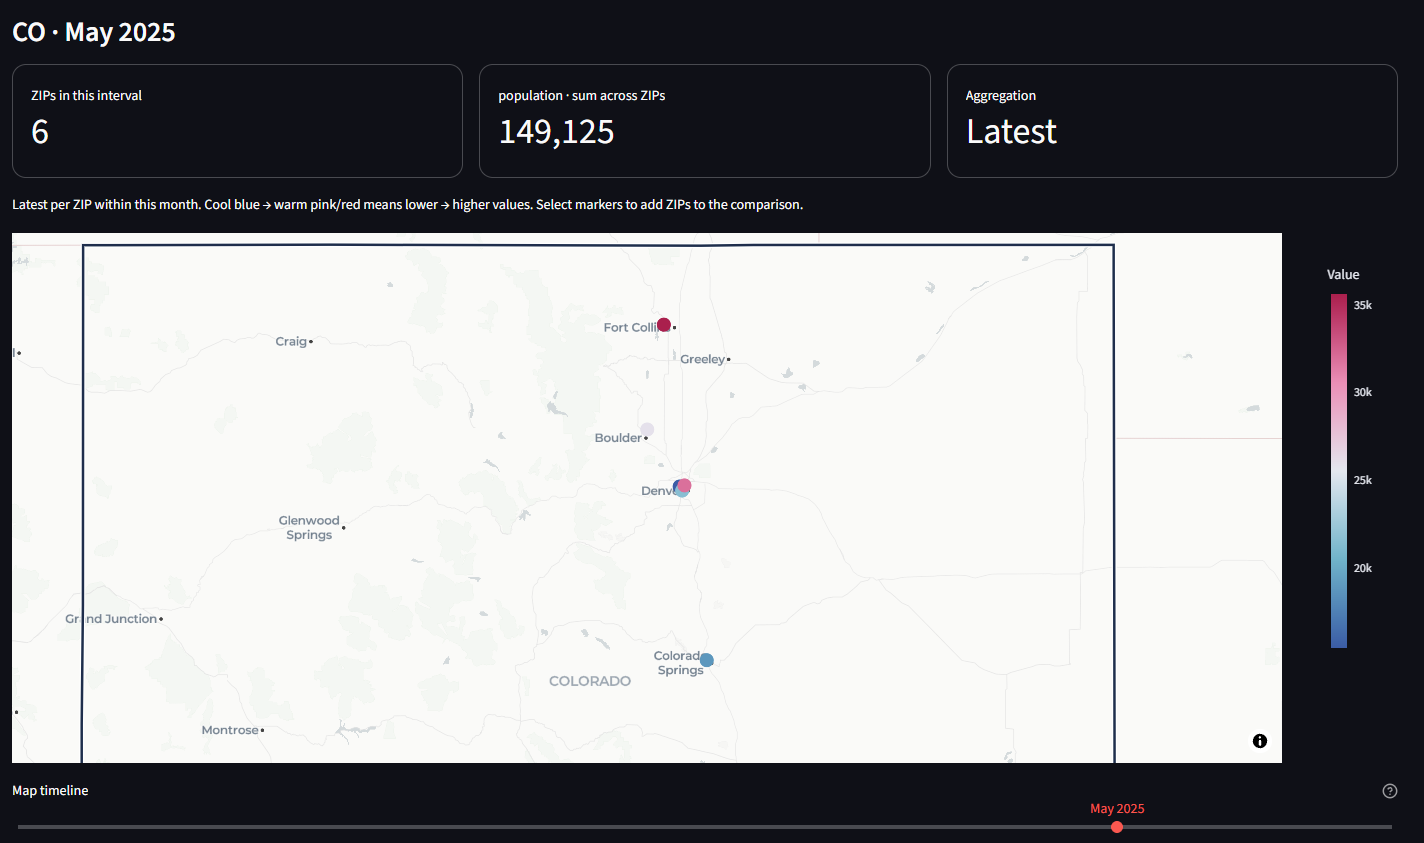
- ziptrend-0.1.0/src/ziptrend/__init__.py +4 -0
- ziptrend-0.1.0/src/ziptrend/app.py +212 -0
- ziptrend-0.1.0/src/ziptrend/assets/SOURCES.md +12 -0
- ziptrend-0.1.0/src/ziptrend/assets/us-states.geojson +1 -0
- ziptrend-0.1.0/src/ziptrend/charts.py +31 -0
- ziptrend-0.1.0/src/ziptrend/cli.py +16 -0
- ziptrend-0.1.0/src/ziptrend/data.py +129 -0
- ziptrend-0.1.0/src/ziptrend/demo.py +22 -0
- ziptrend-0.1.0/src/ziptrend/geography.py +48 -0
- ziptrend-0.1.0/src/ziptrend/selection.py +17 -0
- ziptrend-0.1.0/src/ziptrend.egg-info/PKG-INFO +131 -0
- ziptrend-0.1.0/src/ziptrend.egg-info/SOURCES.txt +23 -0
- ziptrend-0.1.0/src/ziptrend.egg-info/dependency_links.txt +1 -0
- ziptrend-0.1.0/src/ziptrend.egg-info/entry_points.txt +2 -0
- ziptrend-0.1.0/src/ziptrend.egg-info/requires.txt +14 -0
- ziptrend-0.1.0/src/ziptrend.egg-info/top_level.txt +1 -0
- ziptrend-0.1.0/tests/test_app.py +59 -0
- ziptrend-0.1.0/tests/test_data.py +71 -0
- ziptrend-0.1.0/tests/test_map_timeline.py +44 -0
- ziptrend-0.1.0/tests/test_selection.py +7 -0
ziptrend-0.1.0/LICENSE
ADDED
|
@@ -0,0 +1,21 @@
|
|
|
1
|
+
MIT License
|
|
2
|
+
|
|
3
|
+
Copyright (c) 2026 Sam Oliver
|
|
4
|
+
|
|
5
|
+
Permission is hereby granted, free of charge, to any person obtaining a copy
|
|
6
|
+
of this software and associated documentation files (the "Software"), to deal
|
|
7
|
+
in the Software without restriction, including without limitation the rights
|
|
8
|
+
to use, copy, modify, merge, publish, distribute, sublicense, and/or sell
|
|
9
|
+
copies of the Software, and to permit persons to whom the Software is
|
|
10
|
+
furnished to do so, subject to the following conditions:
|
|
11
|
+
|
|
12
|
+
The above copyright notice and this permission notice shall be included in all
|
|
13
|
+
copies or substantial portions of the Software.
|
|
14
|
+
|
|
15
|
+
THE SOFTWARE IS PROVIDED "AS IS", WITHOUT WARRANTY OF ANY KIND, EXPRESS OR
|
|
16
|
+
IMPLIED, INCLUDING BUT NOT LIMITED TO THE WARRANTIES OF MERCHANTABILITY,
|
|
17
|
+
FITNESS FOR A PARTICULAR PURPOSE AND NONINFRINGEMENT. IN NO EVENT SHALL THE
|
|
18
|
+
AUTHORS OR COPYRIGHT HOLDERS BE LIABLE FOR ANY CLAIM, DAMAGES OR OTHER
|
|
19
|
+
LIABILITY, WHETHER IN AN ACTION OF CONTRACT, TORT OR OTHERWISE, ARISING FROM,
|
|
20
|
+
OUT OF OR IN CONNECTION WITH THE SOFTWARE OR THE USE OR OTHER DEALINGS IN THE
|
|
21
|
+
SOFTWARE.
|
ziptrend-0.1.0/PKG-INFO
ADDED
|
@@ -0,0 +1,131 @@
|
|
|
1
|
+
Metadata-Version: 2.4
|
|
2
|
+
Name: ziptrend
|
|
3
|
+
Version: 0.1.0
|
|
4
|
+
Summary: Explore US ZIP-code observations across geography and time
|
|
5
|
+
Author: Sam Oliver
|
|
6
|
+
License-Expression: MIT
|
|
7
|
+
Project-URL: Homepage, https://github.com/samoliver3/ziptrend
|
|
8
|
+
Project-URL: Source, https://github.com/samoliver3/ziptrend
|
|
9
|
+
Project-URL: Issues, https://github.com/samoliver3/ziptrend/issues
|
|
10
|
+
Keywords: zip code,geospatial,time series,dashboard,census
|
|
11
|
+
Classifier: Development Status :: 3 - Alpha
|
|
12
|
+
Classifier: Intended Audience :: Science/Research
|
|
13
|
+
Classifier: Operating System :: OS Independent
|
|
14
|
+
Classifier: Programming Language :: Python :: 3
|
|
15
|
+
Classifier: Programming Language :: Python :: 3.11
|
|
16
|
+
Classifier: Programming Language :: Python :: 3.12
|
|
17
|
+
Classifier: Programming Language :: Python :: 3.13
|
|
18
|
+
Classifier: Programming Language :: Python :: 3.14
|
|
19
|
+
Classifier: Topic :: Scientific/Engineering :: GIS
|
|
20
|
+
Classifier: Topic :: Scientific/Engineering :: Visualization
|
|
21
|
+
Requires-Python: >=3.11
|
|
22
|
+
Description-Content-Type: text/markdown
|
|
23
|
+
License-File: LICENSE
|
|
24
|
+
Requires-Dist: pandas<4,>=2.2
|
|
25
|
+
Requires-Dist: numpy>=1.26
|
|
26
|
+
Requires-Dist: pgeocode<0.6,>=0.5
|
|
27
|
+
Requires-Dist: openpyxl>=3.1
|
|
28
|
+
Requires-Dist: xlrd>=2.0
|
|
29
|
+
Provides-Extra: app
|
|
30
|
+
Requires-Dist: plotly<8,>=5.24; extra == "app"
|
|
31
|
+
Requires-Dist: streamlit<2,>=1.53; extra == "app"
|
|
32
|
+
Provides-Extra: dev
|
|
33
|
+
Requires-Dist: ziptrend[app]; extra == "dev"
|
|
34
|
+
Requires-Dist: pytest>=8.2; extra == "dev"
|
|
35
|
+
Requires-Dist: build>=1; extra == "dev"
|
|
36
|
+
Dynamic: license-file
|
|
37
|
+
|
|
38
|
+
# ZIPtrend
|
|
39
|
+
|
|
40
|
+
A Python package and local browser dashboard for exploring numeric observations by U.S. ZIP code and time.
|
|
41
|
+
|
|
42
|
+
|
|
43
|
+
|
|
44
|
+
*Colorado demo view for May 2025, using fictional population data. Move the timeline to explore changes over time.*
|
|
45
|
+
|
|
46
|
+
## Install
|
|
47
|
+
|
|
48
|
+
Requires Python 3.11 or later.
|
|
49
|
+
|
|
50
|
+
```powershell
|
|
51
|
+
pip install "ziptrend[app]" # data API plus the browser dashboard
|
|
52
|
+
pip install ziptrend # data API only, without Streamlit or Plotly
|
|
53
|
+
```
|
|
54
|
+
|
|
55
|
+
## Run the dashboard
|
|
56
|
+
|
|
57
|
+
```powershell
|
|
58
|
+
ziptrend
|
|
59
|
+
```
|
|
60
|
+
|
|
61
|
+
The dashboard opens at http://localhost:8501. It binds to localhost by default. A fictional 36-month sample is included, with offline geography. Upload your own file or download the sample CSV from the sidebar.
|
|
62
|
+
|
|
63
|
+
## Explore
|
|
64
|
+
|
|
65
|
+
- Import CSV, TSV, delimited UTF-8 TXT, Excel XLS/XLSX (select a worksheet), JSON arrays, or JSON Lines.
|
|
66
|
+
- Map arbitrary column names to ZIP, date, and numeric measure. Select a different measure at any time.
|
|
67
|
+
- Select states, then search ZIPs by typing or paste a comma-, space-, or newline-separated list. Include selected ZIPs or exclude them from the entire dashboard.
|
|
68
|
+
- Use **Map timeline**, directly below the map, to step through days, months, or years according to **Time interval**. The map and its totals show only that interval. Optional date-range limits live in a collapsed sidebar section and narrow the timeline, trend charts, and exports.
|
|
69
|
+
- Select a state to frame its full Census outline instead of zooming to the cluster of ZIP centroids. Color scales use the filtered geography and displayed interval; enable **Keep color scale fixed over time** to compare intervals against one scale within those same geography filters.
|
|
70
|
+
- Switch between a cool-to-warm concentration heatmap and individually selectable ZIP markers. Click markers to add ZIPs to the searchable **Inspect ZIP codes** multiselect, or paste a list to compare several histories. Inspector selections only affect that comparison; sidebar ZIP filters affect the whole dashboard.
|
|
71
|
+
- Compare ZIP or state trends, view top ZIPs, and export observations or a map summary.
|
|
72
|
+
|
|
73
|
+
Example input:
|
|
74
|
+
|
|
75
|
+
```csv
|
|
76
|
+
zip,date,population
|
|
77
|
+
02108,2024-01-01,4500
|
|
78
|
+
02108,2024-02-01,4520
|
|
79
|
+
80202,2024-01-01,15000
|
|
80
|
+
80202,2024-02-01,15060
|
|
81
|
+
```
|
|
82
|
+
|
|
83
|
+
ZIPs retain leading zeros, Excel numeric ZIPs are padded, and ZIP+4 is reduced to five digits. Dates should preferably be ISO `YYYY-MM-DD`; years work too. Automatic ambiguous dates use month-first interpretation. Supply `%d/%m/%Y` for day-first dates. Numeric Excel serial dates must be converted to dates first. Values may contain thousands commas. Invalid rows and duplicate ZIP/date observations require correction or an explicit duplicate aggregation choice; records are not silently discarded.
|
|
84
|
+
|
|
85
|
+
## Aggregation and geography
|
|
86
|
+
|
|
87
|
+
`latest` (default) takes the final observation for each ZIP within each time interval on maps and trend charts. Use this for population snapshots. `mean` averages observations within the interval; `sum` adds them, appropriate for flows such as transactions. State curves sum the resulting ZIP values. Summing rates, percentages, or ZIP averages may not be meaningful; the package does not infer weights or denominators. State totals cover only uploaded ZIPs, and changing coverage can affect trends. Empty calendar intervals are included on the map timeline and display no values; no observations are carried forward. Optional date limits can clip a month/year. Exported map summaries correspond to the displayed interval; observation exports include the entire filtered range.
|
|
88
|
+
|
|
89
|
+
The concentration map blends values at ZIP centroids. It does **not** show ZIP boundaries or population per unit land area. Heatmap intensity depends on nearby points and zoom; marker colors scale to the map's aggregated values. With automatic scaling, the same color can mean different values in different intervals: read the legend or use the fixed-scale option. Signed values use marker views. Geographic ZIP attribution uses a representative state; postal ZIPs are not Census ZCTAs and may cross boundaries. ZIP boundary choropleths and land-area-normalized density remain future extensions.
|
|
90
|
+
|
|
91
|
+
Bundled state outlines are from the [U.S. Census Bureau's cartographic boundary files](https://www.census.gov/geographies/mapping-files/time-series/geo/carto-boundary-file.html), 2024, at 1:20,000,000 scale. They are simplified display boundaries, not survey boundaries. See `SOURCES.md` in the package's `assets` folder for the exact source and conversion details. State framing stays consistent across time bins even when the available ZIPs change. Basemap context outside a state's outline remains visible.
|
|
92
|
+
|
|
93
|
+
Default ZIP geography comes from [GeoNames](https://www.geonames.org/) through [pgeocode](https://pgeocode.readthedocs.io/en/latest/), with GeoNames attribution under [CC BY 4.0](https://creativecommons.org/licenses/by/4.0/). First use downloads a U.S. reference file; subsequent lookups use its local cache. Values in uploaded files are processed locally and are not sent to GeoNames. Basemap tiles come from CARTO/OpenStreetMap and require internet. Upload a CSV containing `zip,state,latitude,longitude` to use your own lookup without a reference download. Use two-letter state abbreviations. Missing geography is reported and retained for ZIP trends/exports.
|
|
94
|
+
|
|
95
|
+
## Python API
|
|
96
|
+
|
|
97
|
+
The data functions need only the base install; map charts (`ziptrend.charts`) need the `app` extra.
|
|
98
|
+
|
|
99
|
+
```python
|
|
100
|
+
from ziptrend import read_data, prepare_data, locate, summarize, trends
|
|
101
|
+
|
|
102
|
+
raw = read_data("population.xlsx", sheet_name=0)
|
|
103
|
+
data = prepare_data(raw, zip_column="zip", date_column="date",
|
|
104
|
+
value_column="population", duplicate="error")
|
|
105
|
+
data = locate(data) # or locate(data, your_lookup_dataframe)
|
|
106
|
+
colorado = data[data.state.eq("CO")]
|
|
107
|
+
monthly = trends(colorado, frequency="month", method="latest")
|
|
108
|
+
state_monthly = trends(colorado, frequency="month", group="state")
|
|
109
|
+
snapshot = summarize(colorado, method="latest")
|
|
110
|
+
```
|
|
111
|
+
|
|
112
|
+
`summarize` aggregates the full input window; filter dates before calling it for a specific snapshot. Canonical columns are `zip,date,value`, plus `state,latitude,longitude` after `locate`.
|
|
113
|
+
|
|
114
|
+
## Develop
|
|
115
|
+
|
|
116
|
+
From a clone of this repository:
|
|
117
|
+
|
|
118
|
+
```powershell
|
|
119
|
+
py -3.12 -m venv .venv
|
|
120
|
+
.\.venv\Scripts\python -m pip install -e ".[dev]"
|
|
121
|
+
.\.venv\Scripts\python -m pytest
|
|
122
|
+
.\.venv\Scripts\python -m build
|
|
123
|
+
```
|
|
124
|
+
|
|
125
|
+
Run tests with the virtual environment's `python -m pytest`, not a global `pytest`, so they use the project's dependencies. Dashboard and chart tests skip automatically when Streamlit or Plotly is not installed.
|
|
126
|
+
|
|
127
|
+
The implementation uses [Streamlit chart selections](https://docs.streamlit.io/develop/api-reference/charts/st.plotly_chart) and [Plotly MapLibre maps](https://plotly.com/python/tile-map-layers/). Tests cover imports, ZIP normalization, invalid input, duplicate handling, aggregation semantics, missing geography, chart construction, and dashboard filters. The UI tests do not verify actual browser map clicks or external map tiles.
|
|
128
|
+
|
|
129
|
+
## License
|
|
130
|
+
|
|
131
|
+
MIT. See the `LICENSE` file.
|
ziptrend-0.1.0/README.md
ADDED
|
@@ -0,0 +1,94 @@
|
|
|
1
|
+
# ZIPtrend
|
|
2
|
+
|
|
3
|
+
A Python package and local browser dashboard for exploring numeric observations by U.S. ZIP code and time.
|
|
4
|
+
|
|
5
|
+

|
|
6
|
+
|
|
7
|
+
*Colorado demo view for May 2025, using fictional population data. Move the timeline to explore changes over time.*
|
|
8
|
+
|
|
9
|
+
## Install
|
|
10
|
+
|
|
11
|
+
Requires Python 3.11 or later.
|
|
12
|
+
|
|
13
|
+
```powershell
|
|
14
|
+
pip install "ziptrend[app]" # data API plus the browser dashboard
|
|
15
|
+
pip install ziptrend # data API only, without Streamlit or Plotly
|
|
16
|
+
```
|
|
17
|
+
|
|
18
|
+
## Run the dashboard
|
|
19
|
+
|
|
20
|
+
```powershell
|
|
21
|
+
ziptrend
|
|
22
|
+
```
|
|
23
|
+
|
|
24
|
+
The dashboard opens at http://localhost:8501. It binds to localhost by default. A fictional 36-month sample is included, with offline geography. Upload your own file or download the sample CSV from the sidebar.
|
|
25
|
+
|
|
26
|
+
## Explore
|
|
27
|
+
|
|
28
|
+
- Import CSV, TSV, delimited UTF-8 TXT, Excel XLS/XLSX (select a worksheet), JSON arrays, or JSON Lines.
|
|
29
|
+
- Map arbitrary column names to ZIP, date, and numeric measure. Select a different measure at any time.
|
|
30
|
+
- Select states, then search ZIPs by typing or paste a comma-, space-, or newline-separated list. Include selected ZIPs or exclude them from the entire dashboard.
|
|
31
|
+
- Use **Map timeline**, directly below the map, to step through days, months, or years according to **Time interval**. The map and its totals show only that interval. Optional date-range limits live in a collapsed sidebar section and narrow the timeline, trend charts, and exports.
|
|
32
|
+
- Select a state to frame its full Census outline instead of zooming to the cluster of ZIP centroids. Color scales use the filtered geography and displayed interval; enable **Keep color scale fixed over time** to compare intervals against one scale within those same geography filters.
|
|
33
|
+
- Switch between a cool-to-warm concentration heatmap and individually selectable ZIP markers. Click markers to add ZIPs to the searchable **Inspect ZIP codes** multiselect, or paste a list to compare several histories. Inspector selections only affect that comparison; sidebar ZIP filters affect the whole dashboard.
|
|
34
|
+
- Compare ZIP or state trends, view top ZIPs, and export observations or a map summary.
|
|
35
|
+
|
|
36
|
+
Example input:
|
|
37
|
+
|
|
38
|
+
```csv
|
|
39
|
+
zip,date,population
|
|
40
|
+
02108,2024-01-01,4500
|
|
41
|
+
02108,2024-02-01,4520
|
|
42
|
+
80202,2024-01-01,15000
|
|
43
|
+
80202,2024-02-01,15060
|
|
44
|
+
```
|
|
45
|
+
|
|
46
|
+
ZIPs retain leading zeros, Excel numeric ZIPs are padded, and ZIP+4 is reduced to five digits. Dates should preferably be ISO `YYYY-MM-DD`; years work too. Automatic ambiguous dates use month-first interpretation. Supply `%d/%m/%Y` for day-first dates. Numeric Excel serial dates must be converted to dates first. Values may contain thousands commas. Invalid rows and duplicate ZIP/date observations require correction or an explicit duplicate aggregation choice; records are not silently discarded.
|
|
47
|
+
|
|
48
|
+
## Aggregation and geography
|
|
49
|
+
|
|
50
|
+
`latest` (default) takes the final observation for each ZIP within each time interval on maps and trend charts. Use this for population snapshots. `mean` averages observations within the interval; `sum` adds them, appropriate for flows such as transactions. State curves sum the resulting ZIP values. Summing rates, percentages, or ZIP averages may not be meaningful; the package does not infer weights or denominators. State totals cover only uploaded ZIPs, and changing coverage can affect trends. Empty calendar intervals are included on the map timeline and display no values; no observations are carried forward. Optional date limits can clip a month/year. Exported map summaries correspond to the displayed interval; observation exports include the entire filtered range.
|
|
51
|
+
|
|
52
|
+
The concentration map blends values at ZIP centroids. It does **not** show ZIP boundaries or population per unit land area. Heatmap intensity depends on nearby points and zoom; marker colors scale to the map's aggregated values. With automatic scaling, the same color can mean different values in different intervals: read the legend or use the fixed-scale option. Signed values use marker views. Geographic ZIP attribution uses a representative state; postal ZIPs are not Census ZCTAs and may cross boundaries. ZIP boundary choropleths and land-area-normalized density remain future extensions.
|
|
53
|
+
|
|
54
|
+
Bundled state outlines are from the [U.S. Census Bureau's cartographic boundary files](https://www.census.gov/geographies/mapping-files/time-series/geo/carto-boundary-file.html), 2024, at 1:20,000,000 scale. They are simplified display boundaries, not survey boundaries. See `SOURCES.md` in the package's `assets` folder for the exact source and conversion details. State framing stays consistent across time bins even when the available ZIPs change. Basemap context outside a state's outline remains visible.
|
|
55
|
+
|
|
56
|
+
Default ZIP geography comes from [GeoNames](https://www.geonames.org/) through [pgeocode](https://pgeocode.readthedocs.io/en/latest/), with GeoNames attribution under [CC BY 4.0](https://creativecommons.org/licenses/by/4.0/). First use downloads a U.S. reference file; subsequent lookups use its local cache. Values in uploaded files are processed locally and are not sent to GeoNames. Basemap tiles come from CARTO/OpenStreetMap and require internet. Upload a CSV containing `zip,state,latitude,longitude` to use your own lookup without a reference download. Use two-letter state abbreviations. Missing geography is reported and retained for ZIP trends/exports.
|
|
57
|
+
|
|
58
|
+
## Python API
|
|
59
|
+
|
|
60
|
+
The data functions need only the base install; map charts (`ziptrend.charts`) need the `app` extra.
|
|
61
|
+
|
|
62
|
+
```python
|
|
63
|
+
from ziptrend import read_data, prepare_data, locate, summarize, trends
|
|
64
|
+
|
|
65
|
+
raw = read_data("population.xlsx", sheet_name=0)
|
|
66
|
+
data = prepare_data(raw, zip_column="zip", date_column="date",
|
|
67
|
+
value_column="population", duplicate="error")
|
|
68
|
+
data = locate(data) # or locate(data, your_lookup_dataframe)
|
|
69
|
+
colorado = data[data.state.eq("CO")]
|
|
70
|
+
monthly = trends(colorado, frequency="month", method="latest")
|
|
71
|
+
state_monthly = trends(colorado, frequency="month", group="state")
|
|
72
|
+
snapshot = summarize(colorado, method="latest")
|
|
73
|
+
```
|
|
74
|
+
|
|
75
|
+
`summarize` aggregates the full input window; filter dates before calling it for a specific snapshot. Canonical columns are `zip,date,value`, plus `state,latitude,longitude` after `locate`.
|
|
76
|
+
|
|
77
|
+
## Develop
|
|
78
|
+
|
|
79
|
+
From a clone of this repository:
|
|
80
|
+
|
|
81
|
+
```powershell
|
|
82
|
+
py -3.12 -m venv .venv
|
|
83
|
+
.\.venv\Scripts\python -m pip install -e ".[dev]"
|
|
84
|
+
.\.venv\Scripts\python -m pytest
|
|
85
|
+
.\.venv\Scripts\python -m build
|
|
86
|
+
```
|
|
87
|
+
|
|
88
|
+
Run tests with the virtual environment's `python -m pytest`, not a global `pytest`, so they use the project's dependencies. Dashboard and chart tests skip automatically when Streamlit or Plotly is not installed.
|
|
89
|
+
|
|
90
|
+
The implementation uses [Streamlit chart selections](https://docs.streamlit.io/develop/api-reference/charts/st.plotly_chart) and [Plotly MapLibre maps](https://plotly.com/python/tile-map-layers/). Tests cover imports, ZIP normalization, invalid input, duplicate handling, aggregation semantics, missing geography, chart construction, and dashboard filters. The UI tests do not verify actual browser map clicks or external map tiles.
|
|
91
|
+
|
|
92
|
+
## License
|
|
93
|
+
|
|
94
|
+
MIT. See the `LICENSE` file.
|
|
@@ -0,0 +1,51 @@
|
|
|
1
|
+
[build-system]
|
|
2
|
+
requires = ["setuptools>=77"]
|
|
3
|
+
build-backend = "setuptools.build_meta"
|
|
4
|
+
|
|
5
|
+
[project]
|
|
6
|
+
name = "ziptrend"
|
|
7
|
+
version = "0.1.0"
|
|
8
|
+
description = "Explore US ZIP-code observations across geography and time"
|
|
9
|
+
readme = "README.md"
|
|
10
|
+
license = "MIT"
|
|
11
|
+
license-files = ["LICENSE"]
|
|
12
|
+
authors = [{ name = "Sam Oliver" }]
|
|
13
|
+
requires-python = ">=3.11"
|
|
14
|
+
dependencies = ["pandas>=2.2,<4", "numpy>=1.26", "pgeocode>=0.5,<0.6", "openpyxl>=3.1", "xlrd>=2.0"]
|
|
15
|
+
keywords = ["zip code", "geospatial", "time series", "dashboard", "census"]
|
|
16
|
+
classifiers = [
|
|
17
|
+
"Development Status :: 3 - Alpha",
|
|
18
|
+
"Intended Audience :: Science/Research",
|
|
19
|
+
"Operating System :: OS Independent",
|
|
20
|
+
"Programming Language :: Python :: 3",
|
|
21
|
+
"Programming Language :: Python :: 3.11",
|
|
22
|
+
"Programming Language :: Python :: 3.12",
|
|
23
|
+
"Programming Language :: Python :: 3.13",
|
|
24
|
+
"Programming Language :: Python :: 3.14",
|
|
25
|
+
"Topic :: Scientific/Engineering :: GIS",
|
|
26
|
+
"Topic :: Scientific/Engineering :: Visualization",
|
|
27
|
+
]
|
|
28
|
+
|
|
29
|
+
[project.urls]
|
|
30
|
+
Homepage = "https://github.com/samoliver3/ziptrend"
|
|
31
|
+
Source = "https://github.com/samoliver3/ziptrend"
|
|
32
|
+
Issues = "https://github.com/samoliver3/ziptrend/issues"
|
|
33
|
+
|
|
34
|
+
[project.optional-dependencies]
|
|
35
|
+
# The dashboard and map charts; the data API works without them.
|
|
36
|
+
app = ["plotly>=5.24,<8", "streamlit>=1.53,<2"]
|
|
37
|
+
dev = ["ziptrend[app]", "pytest>=8.2", "build>=1"]
|
|
38
|
+
|
|
39
|
+
[project.scripts]
|
|
40
|
+
ziptrend = "ziptrend.cli:main"
|
|
41
|
+
|
|
42
|
+
[tool.setuptools.packages.find]
|
|
43
|
+
where = ["src"]
|
|
44
|
+
|
|
45
|
+
[tool.setuptools.package-data]
|
|
46
|
+
ziptrend = ["assets/*.geojson", "assets/*.md"]
|
|
47
|
+
|
|
48
|
+
[tool.pytest.ini_options]
|
|
49
|
+
pythonpath = ["src"]
|
|
50
|
+
testpaths = ["tests"]
|
|
51
|
+
|
ziptrend-0.1.0/setup.cfg
ADDED
|
@@ -0,0 +1,212 @@
|
|
|
1
|
+
"""Streamlit entry point, also installed with the package."""
|
|
2
|
+
import hashlib
|
|
3
|
+
import pandas as pd
|
|
4
|
+
import plotly.express as px
|
|
5
|
+
import streamlit as st
|
|
6
|
+
from ziptrend.data import read_data, prepare_data, locate, trends, time_bins, period_snapshot
|
|
7
|
+
from ziptrend.demo import demo_data
|
|
8
|
+
from ziptrend.charts import map_chart, COLORS
|
|
9
|
+
from ziptrend.selection import parse_zip_list
|
|
10
|
+
|
|
11
|
+
st.set_page_config(page_title="ZIPtrend · Geography over time", page_icon="◈", layout="wide")
|
|
12
|
+
# Let Streamlit pair foregrounds and surfaces for the active light/dark theme.
|
|
13
|
+
# Fixed light surfaces break contrast when the browser selects a dark theme.
|
|
14
|
+
st.markdown("""<style>
|
|
15
|
+
h1 {letter-spacing: -1.5px;}
|
|
16
|
+
[data-testid="stMetric"] {
|
|
17
|
+
padding:18px;
|
|
18
|
+
border:1px solid currentColor;
|
|
19
|
+
border-color:color-mix(in srgb, currentColor 25%, transparent);
|
|
20
|
+
border-radius:14px;
|
|
21
|
+
}
|
|
22
|
+
[data-testid="stCaptionContainer"] {color:inherit; opacity:1;}
|
|
23
|
+
/* A timeline selects one bin, not a cumulative range. Keep its rail neutral. */
|
|
24
|
+
[data-testid="stSlider"]:has(input[aria-label="Map timeline"])
|
|
25
|
+
[data-rac][data-orientation="horizontal"] > div:first-child:not([data-rac]) {
|
|
26
|
+
background:color-mix(in srgb, currentColor 25%, transparent) !important;
|
|
27
|
+
}
|
|
28
|
+
</style>""", unsafe_allow_html=True)
|
|
29
|
+
st.caption("ZIPTREND / U.S. DATA EXPLORER")
|
|
30
|
+
st.write("Explore where values concentrate and how they change over time.")
|
|
31
|
+
|
|
32
|
+
|
|
33
|
+
@st.cache_data(show_spinner=False)
|
|
34
|
+
def resolve_geography(data):
|
|
35
|
+
return locate(data)
|
|
36
|
+
|
|
37
|
+
|
|
38
|
+
def guess(columns, names):
|
|
39
|
+
return next((i for i, c in enumerate(columns) if str(c).lower() in names), 0)
|
|
40
|
+
|
|
41
|
+
|
|
42
|
+
def zip_picker(label, options, key):
|
|
43
|
+
"""Searchable selection with bulk entry and a predictable clear action."""
|
|
44
|
+
st.session_state[key] = [z for z in st.session_state.get(key, []) if z in options]
|
|
45
|
+
with st.expander("Paste a ZIP list", expanded=False):
|
|
46
|
+
pasted = st.text_area("ZIPs separated by commas, spaces, or newlines", key=f"{key}_paste",
|
|
47
|
+
placeholder="02108, 80202, 80203")
|
|
48
|
+
if st.button("Add ZIP list", key=f"{key}_add"):
|
|
49
|
+
accepted, rejected = parse_zip_list(pasted, options)
|
|
50
|
+
st.session_state[key] = list(dict.fromkeys(st.session_state[key] + accepted))
|
|
51
|
+
if rejected:
|
|
52
|
+
st.warning("Not available in the current filters or invalid: " + ", ".join(rejected[:20]))
|
|
53
|
+
if accepted:
|
|
54
|
+
st.success(f"Added {len(accepted)} matching ZIP(s).")
|
|
55
|
+
if st.button("Clear ZIP selection", key=f"{key}_clear"):
|
|
56
|
+
st.session_state[key] = []
|
|
57
|
+
selected = st.multiselect(label, options, key=key, placeholder="Type a ZIP or prefix to search…",
|
|
58
|
+
help="Type to narrow the list; select multiple ZIPs. Use Paste a ZIP list for bulk entry.")
|
|
59
|
+
st.caption(f"{len(selected):,} selected · {len(options):,} available")
|
|
60
|
+
return selected
|
|
61
|
+
|
|
62
|
+
|
|
63
|
+
with st.sidebar:
|
|
64
|
+
st.header("Your data")
|
|
65
|
+
uploaded = st.file_uploader("Upload observations", type=["csv", "tsv", "txt", "xlsx", "xls", "json", "jsonl"])
|
|
66
|
+
raw_demo, demo_lookup = demo_data()
|
|
67
|
+
st.download_button("Download sample CSV", raw_demo.to_csv(index=False), "sample_population.csv", "text/csv")
|
|
68
|
+
lookup_file = st.file_uploader("Optional offline ZIP lookup", type=["csv"], help="Columns: zip, state (two-letter code), latitude, longitude. One row per ZIP.")
|
|
69
|
+
try:
|
|
70
|
+
if uploaded is None:
|
|
71
|
+
raw = raw_demo
|
|
72
|
+
source_key = "demo"
|
|
73
|
+
st.info("Showing fictional sample population, 2023–2025.")
|
|
74
|
+
else:
|
|
75
|
+
source_key = hashlib.sha256(uploaded.getvalue()).hexdigest()[:12]
|
|
76
|
+
sheet = 0
|
|
77
|
+
delimiter = None
|
|
78
|
+
if uploaded.name.lower().endswith((".xlsx", ".xls")):
|
|
79
|
+
sheet = st.selectbox("Worksheet", pd.ExcelFile(uploaded).sheet_names)
|
|
80
|
+
if uploaded.name.lower().endswith((".txt", ".csv")):
|
|
81
|
+
delimiter = {"Auto": None, "Comma": ",", "Tab": "\t", "Semicolon": ";", "Pipe": "|"}[st.selectbox("Delimiter", ["Auto", "Comma", "Tab", "Semicolon", "Pipe"])]
|
|
82
|
+
raw = read_data(uploaded, sheet_name=sheet, delimiter=delimiter)
|
|
83
|
+
columns = list(raw.columns)
|
|
84
|
+
if len(columns) < 3:
|
|
85
|
+
st.error("Provide at least a ZIP, date, and numeric value column.")
|
|
86
|
+
st.stop()
|
|
87
|
+
zip_col = st.selectbox("ZIP column", columns, index=guess(columns, {"zip", "zipcode", "zip_code", "postal_code"}), key=f"zip_{source_key}")
|
|
88
|
+
date_col = st.selectbox("Date column", columns, index=guess(columns, {"date", "month", "year"}), key=f"date_{source_key}")
|
|
89
|
+
val_col = st.selectbox("Measure", columns, index=guess(columns, {"population", "value", "count"}), key=f"value_{source_key}")
|
|
90
|
+
date_format = st.text_input("Date format (optional)", placeholder="%m/%d/%Y", help="Use %Y for years. ISO YYYY-MM-DD is recommended; otherwise automatic parsing uses month-first dates.")
|
|
91
|
+
duplicates = st.selectbox("Repeated ZIP/date rows", ["error", "sum", "mean", "last"])
|
|
92
|
+
data = prepare_data(raw, zip_column=zip_col, date_column=date_col, value_column=val_col,
|
|
93
|
+
date_format=date_format or None, duplicate=duplicates)
|
|
94
|
+
if lookup_file:
|
|
95
|
+
data = locate(data, read_data(lookup_file))
|
|
96
|
+
elif uploaded is None:
|
|
97
|
+
data = locate(data, demo_lookup)
|
|
98
|
+
else:
|
|
99
|
+
with st.spinner("Finding ZIP geography…"):
|
|
100
|
+
data = resolve_geography(data)
|
|
101
|
+
except Exception as exc:
|
|
102
|
+
st.error(f"Unable to load data: {exc}")
|
|
103
|
+
st.caption("ZIP lookup needs internet on first use. Upload an offline lookup if unavailable.")
|
|
104
|
+
st.stop()
|
|
105
|
+
st.divider()
|
|
106
|
+
st.header("Explore")
|
|
107
|
+
states = st.multiselect("States · empty means all", sorted(data.state.dropna().unique()), key=f"states_{source_key}")
|
|
108
|
+
regional = data[data.state.isin(states)] if states else data
|
|
109
|
+
zip_mode = st.selectbox("ZIP filter", ["Include selected ZIPs", "Exclude selected ZIPs"])
|
|
110
|
+
zips = zip_picker("ZIP codes · empty means all", sorted(regional.zip.unique()), f"zips_{source_key}")
|
|
111
|
+
if zips:
|
|
112
|
+
matches = regional.zip.isin(zips)
|
|
113
|
+
regional = regional[matches if zip_mode == "Include selected ZIPs" else ~matches]
|
|
114
|
+
frequency = st.selectbox("Time interval", ["month", "year", "day"])
|
|
115
|
+
method = st.selectbox("Aggregation", ["latest", "mean", "sum"], help="Aggregate observations per ZIP within each time interval. Latest is suitable for population snapshots; sum for additive observations such as transactions.")
|
|
116
|
+
st.caption("State totals represent only ZIPs in your data. Missing periods are not filled.")
|
|
117
|
+
|
|
118
|
+
if regional.empty:
|
|
119
|
+
st.info("No observations match these filters.")
|
|
120
|
+
st.stop()
|
|
121
|
+
unknown = regional.loc[regional[["latitude", "longitude", "state"]].isna().any(axis=1), "zip"].unique()
|
|
122
|
+
if len(unknown):
|
|
123
|
+
st.warning(f"{len(unknown)} ZIP(s) lack complete geography: {', '.join(unknown[:15])}. They remain in ZIP trends and exports; missing coordinates cannot appear on the map.")
|
|
124
|
+
|
|
125
|
+
dates = sorted(regional.date.dt.date.unique())
|
|
126
|
+
window = (dates[0], dates[-1])
|
|
127
|
+
with st.sidebar.expander("Optional date-range filter"):
|
|
128
|
+
limit_dates = st.checkbox("Limit date range", value=False)
|
|
129
|
+
if limit_dates and len(dates) > 1:
|
|
130
|
+
window = st.select_slider("Date range", options=dates, value=window,
|
|
131
|
+
key=f"range_{source_key}_{','.join(states)}_{','.join(zips)}_{zip_mode}")
|
|
132
|
+
st.caption("Limits the timeline, trend charts, and exports. Use the slider below the map to step through time.")
|
|
133
|
+
filtered = regional[regional.date.dt.date.between(*window)]
|
|
134
|
+
series = trends(filtered, frequency, method)
|
|
135
|
+
|
|
136
|
+
map_tab, trends_tab, table_tab = st.tabs(["Geography", "Trends & comparison", "Data & export"])
|
|
137
|
+
with map_tab:
|
|
138
|
+
mode = st.radio("Map style", ["ZIP markers", "Concentration heatmap"], horizontal=True)
|
|
139
|
+
fixed_scale = st.checkbox("Keep color scale fixed over time", value=False,
|
|
140
|
+
help="Off: rescale to the current filtered interval. On: use all intervals within the current state/ZIP filters for easier time comparisons.")
|
|
141
|
+
summary_area = st.container()
|
|
142
|
+
map_area = st.container()
|
|
143
|
+
periods = [value.to_pydatetime() for value in time_bins(filtered, frequency)]
|
|
144
|
+
timeline_key = "timeline_" + hashlib.sha256(str((source_key, frequency, window, states, zips, zip_mode)).encode()).hexdigest()[:16]
|
|
145
|
+
period_label = lambda value: value.strftime({"month": "%B %Y", "year": "%Y", "day": "%b %d, %Y"}[frequency])
|
|
146
|
+
if len(periods) > 1:
|
|
147
|
+
period = st.select_slider("Map timeline", options=periods, value=periods[-1],
|
|
148
|
+
format_func=period_label, key=timeline_key,
|
|
149
|
+
help=f"Each step shows one {frequency}. Empty intervals remain visible; missing observations are never carried forward.")
|
|
150
|
+
else:
|
|
151
|
+
period = periods[0]
|
|
152
|
+
st.caption(f"Map timeline: {period_label(period)} — only one interval available.")
|
|
153
|
+
snapshot = period_snapshot(filtered, period, frequency, method)
|
|
154
|
+
with summary_area:
|
|
155
|
+
st.subheader(f"{' · '.join(states) if states else 'United States'} · {period_label(period)}")
|
|
156
|
+
metrics = st.columns(3)
|
|
157
|
+
metrics[0].metric("ZIPs in this interval", f"{snapshot.zip.nunique():,}")
|
|
158
|
+
metrics[1].metric(f"{val_col} · sum across ZIPs", f"{snapshot.value.sum():,.0f}" if not snapshot.empty else "No data")
|
|
159
|
+
metrics[2].metric("Aggregation", method.title())
|
|
160
|
+
st.caption(f"{method.title()} per ZIP within this {frequency}. Cool blue → warm pink/red means lower → higher values. Select markers to add ZIPs to the comparison.")
|
|
161
|
+
mapped = snapshot.dropna(subset=["latitude", "longitude"])
|
|
162
|
+
options = sorted(filtered.zip.unique())
|
|
163
|
+
focus_key = f"inspect_{source_key}"
|
|
164
|
+
map_key = "map_" + hashlib.sha256(str((source_key, mode, period, window, method, options, states)).encode()).hexdigest()[:16]
|
|
165
|
+
|
|
166
|
+
def add_map_selection():
|
|
167
|
+
points = st.session_state[map_key].selection.points
|
|
168
|
+
selected = [point["customdata"][0] for point in points if point.get("customdata")]
|
|
169
|
+
st.session_state[focus_key] = list(dict.fromkeys(st.session_state.get(focus_key, []) + selected))
|
|
170
|
+
|
|
171
|
+
with map_area:
|
|
172
|
+
render_mode = mode
|
|
173
|
+
if snapshot.empty:
|
|
174
|
+
st.info("No observations in this interval. Move the timeline to another interval.")
|
|
175
|
+
elif mapped.empty:
|
|
176
|
+
st.info("No coordinates available in this interval. Trends remain available.")
|
|
177
|
+
if mode == "Concentration heatmap" and (mapped.value < 0).any():
|
|
178
|
+
st.info("This interval contains negative values; showing ZIP markers instead of a concentration heatmap.")
|
|
179
|
+
render_mode = "ZIP markers"
|
|
180
|
+
scale_values = series[series.zip.isin(filtered.dropna(subset=["latitude", "longitude"]).zip)].value if fixed_scale else mapped.value
|
|
181
|
+
limits = (float(scale_values.min()), float(scale_values.max())) if not scale_values.empty else None
|
|
182
|
+
if limits and limits[0] == limits[1]:
|
|
183
|
+
padding = abs(limits[0]) * 0.05 or 1
|
|
184
|
+
limits = (limits[0] - padding, limits[1] + padding)
|
|
185
|
+
fig = map_chart(mapped, render_mode, limits, states=states, view_data=filtered)
|
|
186
|
+
st.plotly_chart(fig, width="stretch", on_select=add_map_selection if mode == "ZIP markers" else "ignore",
|
|
187
|
+
selection_mode="points", key=map_key)
|
|
188
|
+
st.caption("Colors use only the current state/ZIP filters" + (" across all timeline intervals." if fixed_scale else " and the displayed interval; the scale can change as you slide.") + " Heatmap intensity blends nearby values and varies with zoom; it is not population per unit area. Empty intervals show no values.")
|
|
189
|
+
st.caption("State outlines: U.S. Census Bureau, 2024 (generalized). ZIP boundaries are not included. Basemap © OpenStreetMap contributors © CARTO. ZIP centroids: GeoNames via pgeocode (CC BY 4.0).")
|
|
190
|
+
st.subheader("Inspect ZIP codes")
|
|
191
|
+
st.caption("Search or paste ZIPs to compare their histories. Clicking map markers adds ZIPs here. This selection affects only the comparison below; use the sidebar ZIP filter to filter the whole dashboard.")
|
|
192
|
+
focus = zip_picker("Inspect ZIP codes", options, focus_key)
|
|
193
|
+
if focus:
|
|
194
|
+
focus_data = series[series.zip.isin(focus)]
|
|
195
|
+
st.plotly_chart(px.line(focus_data, x="period", y="value", color="zip", markers=True, title=f"Selected ZIPs · {val_col}", labels={"value": str(val_col), "period": "Date", "zip": "ZIP"}), width="stretch")
|
|
196
|
+
else:
|
|
197
|
+
st.info("Select ZIP codes above or click map markers to compare their trends.")
|
|
198
|
+
|
|
199
|
+
with trends_tab:
|
|
200
|
+
group = st.radio("Compare", ["zip", "state"], horizontal=True)
|
|
201
|
+
lines = trends(filtered, frequency, method, group)
|
|
202
|
+
st.plotly_chart(px.line(lines, x="period", y="value", color=group, markers=True,
|
|
203
|
+
labels={"value": str(val_col), "period": "Date"}), width="stretch")
|
|
204
|
+
st.caption("Lines connect available observations; gaps do not mean zero. State curves sum the available ZIP values in each period; coverage can vary.")
|
|
205
|
+
st.plotly_chart(px.bar(snapshot.sort_values("value", ascending=False).head(25), x="zip", y="value", color="value",
|
|
206
|
+
color_continuous_scale=COLORS, title=f"Top ZIPs · {period_label(period)}" ).update_xaxes(type="category"), width="stretch")
|
|
207
|
+
with table_tab:
|
|
208
|
+
st.write("Observations in selected date range")
|
|
209
|
+
st.dataframe(filtered, hide_index=True, width="stretch")
|
|
210
|
+
st.download_button("Export filtered observations", filtered.to_csv(index=False), "ziptrend_observations.csv", "text/csv")
|
|
211
|
+
st.download_button("Export displayed map interval", snapshot.to_csv(index=False), f"ziptrend_{period:%Y-%m-%d}.csv", "text/csv")
|
|
212
|
+
|
|
@@ -0,0 +1,12 @@
|
|
|
1
|
+
# State outlines
|
|
2
|
+
|
|
3
|
+
U.S. Census Bureau, 2024 cartographic boundary files, 1:20,000,000 scale.
|
|
4
|
+
Source: https://www2.census.gov/geo/tiger/GENZ2024/shp/cb_2024_us_state_20m.zip
|
|
5
|
+
Documentation: https://www.census.gov/geographies/mapping-files/time-series/geo/carto-boundary-file.html
|
|
6
|
+
|
|
7
|
+
Converted from the Census shapefile to GeoJSON with `tools/convert_states.py`.
|
|
8
|
+
Only state abbreviation/name and geometry are retained. These are generalized
|
|
9
|
+
cartographic outlines for visualization, not legal or survey boundaries.
|
|
10
|
+
Coordinates are NAD83 geographic coordinates, displayed on the web basemap as
|
|
11
|
+
longitude/latitude; datum differences are negligible at this display scale.
|
|
12
|
+
U.S. federal government geographic data; attribution: U.S. Census Bureau.
|