visnetmap 0.1.3.3__tar.gz → 0.1.3.5__tar.gz
This diff represents the content of publicly available package versions that have been released to one of the supported registries. The information contained in this diff is provided for informational purposes only and reflects changes between package versions as they appear in their respective public registries.
- visnetmap-0.1.3.5/PKG-INFO +772 -0
- visnetmap-0.1.3.5/README.md +755 -0
- {visnetmap-0.1.3.3 → visnetmap-0.1.3.5}/pyproject.toml +1 -1
- visnetmap-0.1.3.5/visnetmap.egg-info/PKG-INFO +772 -0
- visnetmap-0.1.3.5/visnetmap.egg-info/SOURCES.txt +8 -0
- visnetmap-0.1.3.5/visnetmap.egg-info/top_level.txt +2 -0
- visnetmap-0.1.3.3/PKG-INFO +0 -18
- visnetmap-0.1.3.3/README.md +0 -1
- visnetmap-0.1.3.3/visNETmap/__init__.py +0 -1
- visnetmap-0.1.3.3/visNETmap/base_modes/__init__.py +0 -1
- visnetmap-0.1.3.3/visNETmap/base_modes/netmap_base.py +0 -660
- visnetmap-0.1.3.3/visNETmap/base_modes/network_visual_save_base.py +0 -1032
- visnetmap-0.1.3.3/visNETmap/visNM.py +0 -257
- visnetmap-0.1.3.3/visnetmap.egg-info/PKG-INFO +0 -18
- visnetmap-0.1.3.3/visnetmap.egg-info/SOURCES.txt +0 -13
- visnetmap-0.1.3.3/visnetmap.egg-info/top_level.txt +0 -2
- {visnetmap-0.1.3.3 → visnetmap-0.1.3.5}/LICENSE +0 -0
- {visnetmap-0.1.3.3 → visnetmap-0.1.3.5}/setup.cfg +0 -0
- {visnetmap-0.1.3.3 → visnetmap-0.1.3.5}/visnetmap.egg-info/dependency_links.txt +0 -0
- {visnetmap-0.1.3.3 → visnetmap-0.1.3.5}/visnetmap.egg-info/requires.txt +0 -0
|
@@ -0,0 +1,772 @@
|
|
|
1
|
+
Metadata-Version: 2.4
|
|
2
|
+
Name: visnetmap
|
|
3
|
+
Version: 0.1.3.5
|
|
4
|
+
Summary: A short description of my package
|
|
5
|
+
Author-email: "Peng (Atsaniik) Yang" <peng.yang@uef.fi>
|
|
6
|
+
Project-URL: Homepage, https://github.com/Atsaniik/visnetmap
|
|
7
|
+
Project-URL: Bug Tracker, https://github.com/Atsaniik/visnetmap/issues
|
|
8
|
+
Classifier: Programming Language :: Python :: 3
|
|
9
|
+
Classifier: License :: OSI Approved :: MIT License
|
|
10
|
+
Classifier: Operating System :: OS Independent
|
|
11
|
+
Requires-Python: >=3.8
|
|
12
|
+
Description-Content-Type: text/markdown
|
|
13
|
+
License-File: LICENSE
|
|
14
|
+
Requires-Dist: requests>=2.28.1
|
|
15
|
+
Requires-Dist: geopy
|
|
16
|
+
Dynamic: license-file
|
|
17
|
+
|
|
18
|
+
# visnetmap
|
|
19
|
+
|
|
20
|
+
[](https://pypi.org/project/visnetmap/)
|
|
21
|
+
[](https://pypi.org/project/visnetmap/)
|
|
22
|
+
[](https://github.com/Atsaniik/visnetmap/blob/main/LICENSE)
|
|
23
|
+
|
|
24
|
+
`visnetmap` is a Python library for creating interactive network and map visualizations as standalone HTML files.
|
|
25
|
+
|
|
26
|
+
It provides two main visualization tools:
|
|
27
|
+
|
|
28
|
+
- `visnet()` — interactive network graph visualization using **vis-network**
|
|
29
|
+
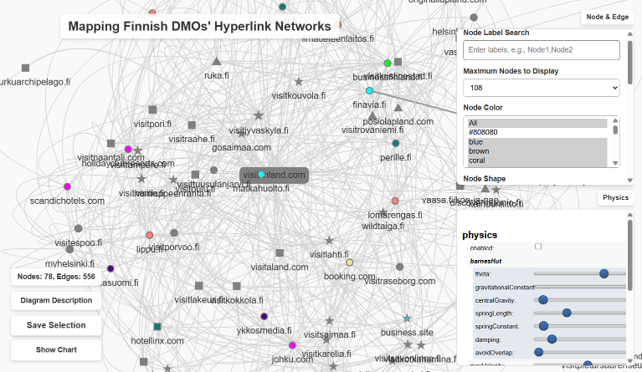
|
|
30
|
+
- `netMap()` — interactive geographical network map using **Leaflet**
|
|
31
|
+
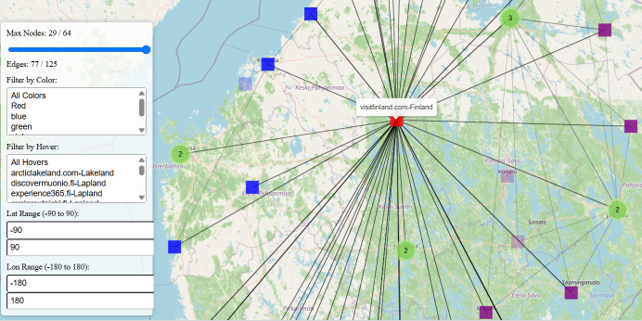
|
|
32
|
+
|
|
33
|
+
The package is designed for researchers, students, and analysts who want to quickly generate shareable HTML visualizations from Python data structures, NetworkX graphs, or location-based network data.
|
|
34
|
+
|
|
35
|
+
---
|
|
36
|
+
|
|
37
|
+
## Live demo
|
|
38
|
+
|
|
39
|
+
A presentation/demo page is available here:
|
|
40
|
+
|
|
41
|
+
[https://atsaniik.github.io/Finland_DMOs_Vienna/](https://atsaniik.github.io/Finland_DMOs_Vienna/)
|
|
42
|
+
|
|
43
|
+
This page demonstrates the type of interactive network and map visualizations that can be produced with `visnetmap`.
|
|
44
|
+
|
|
45
|
+
---
|
|
46
|
+
|
|
47
|
+
## Main features
|
|
48
|
+
|
|
49
|
+
- Generate standalone interactive HTML files
|
|
50
|
+
- Visualize NetworkX-like graphs
|
|
51
|
+
- Visualize geographical networks on maps
|
|
52
|
+
- Support node and edge hover information
|
|
53
|
+
- Support weighted edges
|
|
54
|
+
- Support directed graphs
|
|
55
|
+
- Support custom node size, color, shape, and labels
|
|
56
|
+
- Support map markers and curved/arced connections
|
|
57
|
+
- Export generated visualizations as HTML
|
|
58
|
+
- Optionally open output directly in a browser
|
|
59
|
+
- No JavaScript coding required for normal use
|
|
60
|
+
|
|
61
|
+
---
|
|
62
|
+
|
|
63
|
+
## Installation
|
|
64
|
+
|
|
65
|
+
Install from PyPI:
|
|
66
|
+
|
|
67
|
+
```bash
|
|
68
|
+
pip install visnetmap
|
|
69
|
+
```
|
|
70
|
+
|
|
71
|
+
If you want to use NetworkX examples:
|
|
72
|
+
|
|
73
|
+
```bash
|
|
74
|
+
pip install "visnetmap[networkx]"
|
|
75
|
+
```
|
|
76
|
+
|
|
77
|
+
If the package is not yet published on PyPI, install directly from GitHub:
|
|
78
|
+
|
|
79
|
+
```bash
|
|
80
|
+
pip install git+https://github.com/Atsaniik/visnetmap.git
|
|
81
|
+
```
|
|
82
|
+
|
|
83
|
+
For local development:
|
|
84
|
+
|
|
85
|
+
```bash
|
|
86
|
+
git clone https://github.com/Atsaniik/visnetmap.git
|
|
87
|
+
cd visnetmap
|
|
88
|
+
pip install -e ".[dev]"
|
|
89
|
+
```
|
|
90
|
+
|
|
91
|
+
---
|
|
92
|
+
|
|
93
|
+
## Quick start: network visualization
|
|
94
|
+
|
|
95
|
+
```python
|
|
96
|
+
import networkx as nx
|
|
97
|
+
from visnetmap import visnet
|
|
98
|
+
|
|
99
|
+
G = nx.DiGraph()
|
|
100
|
+
|
|
101
|
+
G.add_weighted_edges_from([
|
|
102
|
+
("B", "A", 5),
|
|
103
|
+
("C", "A", 2),
|
|
104
|
+
("D", "A", 1),
|
|
105
|
+
("B", "C", 2),
|
|
106
|
+
("E", "F", 4),
|
|
107
|
+
("E", "G", 3),
|
|
108
|
+
("E", "H", 2),
|
|
109
|
+
])
|
|
110
|
+
|
|
111
|
+
visnet(
|
|
112
|
+
G,
|
|
113
|
+
network_title="Knowledge Sharing Network",
|
|
114
|
+
writeHTML="knowledge_network.html",
|
|
115
|
+
browserView=True,
|
|
116
|
+
)
|
|
117
|
+
```
|
|
118
|
+
|
|
119
|
+
This creates an HTML file such as:
|
|
120
|
+
|
|
121
|
+
```text
|
|
122
|
+
netOutPut/knowledge_network.html
|
|
123
|
+
```
|
|
124
|
+
|
|
125
|
+
and opens it in your browser if `browserView=True`.
|
|
126
|
+
|
|
127
|
+
---
|
|
128
|
+
|
|
129
|
+
## Quick start: map visualization
|
|
130
|
+
|
|
131
|
+
```python
|
|
132
|
+
from visnetmap import netMap
|
|
133
|
+
|
|
134
|
+
cities = [
|
|
135
|
+
{
|
|
136
|
+
"node": "New York",
|
|
137
|
+
"lat": 40.7128,
|
|
138
|
+
"lon": -74.0060,
|
|
139
|
+
"size": 15,
|
|
140
|
+
"color": "red",
|
|
141
|
+
"shape": "circle",
|
|
142
|
+
"node_hover": "The Big Apple, USA",
|
|
143
|
+
},
|
|
144
|
+
{
|
|
145
|
+
"node": "London",
|
|
146
|
+
"lat": 51.5074,
|
|
147
|
+
"lon": -0.1278,
|
|
148
|
+
"size": 12,
|
|
149
|
+
"color": "blue",
|
|
150
|
+
"shape": "star",
|
|
151
|
+
"node_hover": "Capital of the UK",
|
|
152
|
+
},
|
|
153
|
+
{
|
|
154
|
+
"node": "Tokyo",
|
|
155
|
+
"lat": 35.6762,
|
|
156
|
+
"lon": 139.6503,
|
|
157
|
+
"size": 10,
|
|
158
|
+
"color": "green",
|
|
159
|
+
"shape": "square",
|
|
160
|
+
"node_hover": "Capital of Japan",
|
|
161
|
+
},
|
|
162
|
+
]
|
|
163
|
+
|
|
164
|
+
connections = [
|
|
165
|
+
{
|
|
166
|
+
"node1": "New York",
|
|
167
|
+
"node2": "London",
|
|
168
|
+
"color": "black",
|
|
169
|
+
"width": 2,
|
|
170
|
+
"style": "solid",
|
|
171
|
+
"arrow": True,
|
|
172
|
+
"curve": False,
|
|
173
|
+
"edge_hover": "Flight from New York to London",
|
|
174
|
+
},
|
|
175
|
+
{
|
|
176
|
+
"node1": "London",
|
|
177
|
+
"node2": "Tokyo",
|
|
178
|
+
"color": "blue",
|
|
179
|
+
"width": 3,
|
|
180
|
+
"style": "solid",
|
|
181
|
+
"arrow": True,
|
|
182
|
+
"curve": True,
|
|
183
|
+
"edge_hover": "Connection from London to Tokyo",
|
|
184
|
+
},
|
|
185
|
+
]
|
|
186
|
+
|
|
187
|
+
netMap(
|
|
188
|
+
cities,
|
|
189
|
+
connections,
|
|
190
|
+
title="Global City Network",
|
|
191
|
+
writeHTML="city_network_map.html",
|
|
192
|
+
browserView=True,
|
|
193
|
+
)
|
|
194
|
+
```
|
|
195
|
+
|
|
196
|
+
This creates an HTML file such as:
|
|
197
|
+
|
|
198
|
+
```text
|
|
199
|
+
mapOutPut/city_network_map.html
|
|
200
|
+
```
|
|
201
|
+
|
|
202
|
+
---
|
|
203
|
+
|
|
204
|
+
## Import options
|
|
205
|
+
|
|
206
|
+
The main functions can be imported directly:
|
|
207
|
+
|
|
208
|
+
```python
|
|
209
|
+
from visnetmap import visnet, netMap
|
|
210
|
+
```
|
|
211
|
+
|
|
212
|
+
Additional helper functions:
|
|
213
|
+
|
|
214
|
+
```python
|
|
215
|
+
from visnetmap import nx2vis, latLong, base64_from_url, base64_from_loc
|
|
216
|
+
```
|
|
217
|
+
|
|
218
|
+
---
|
|
219
|
+
|
|
220
|
+
## `visnet()` overview
|
|
221
|
+
|
|
222
|
+
`visnet()` creates an interactive network graph.
|
|
223
|
+
|
|
224
|
+
Basic usage:
|
|
225
|
+
|
|
226
|
+
```python
|
|
227
|
+
visnet(
|
|
228
|
+
G=None,
|
|
229
|
+
nodes=None,
|
|
230
|
+
edges=None,
|
|
231
|
+
network_title="Network",
|
|
232
|
+
writeHTML="network.html",
|
|
233
|
+
browserView=False,
|
|
234
|
+
maximum_display=100,
|
|
235
|
+
)
|
|
236
|
+
```
|
|
237
|
+
|
|
238
|
+
### Input option 1: NetworkX graph
|
|
239
|
+
|
|
240
|
+
```python
|
|
241
|
+
import networkx as nx
|
|
242
|
+
from visnetmap import visnet
|
|
243
|
+
|
|
244
|
+
G = nx.DiGraph()
|
|
245
|
+
G.add_weighted_edges_from([
|
|
246
|
+
("A", "B", 3),
|
|
247
|
+
("B", "C", 2),
|
|
248
|
+
("C", "A", 1),
|
|
249
|
+
])
|
|
250
|
+
|
|
251
|
+
visnet(G, network_title="Directed Network", browserView=True)
|
|
252
|
+
```
|
|
253
|
+
|
|
254
|
+
### Input option 2: node and edge dictionaries
|
|
255
|
+
|
|
256
|
+
```python
|
|
257
|
+
from visnetmap import visnet
|
|
258
|
+
|
|
259
|
+
nodes = [
|
|
260
|
+
{
|
|
261
|
+
"id": 1,
|
|
262
|
+
"label": "Start",
|
|
263
|
+
"size": 20,
|
|
264
|
+
"color": "red",
|
|
265
|
+
"shape": "dot",
|
|
266
|
+
"title": "Starting node",
|
|
267
|
+
},
|
|
268
|
+
{
|
|
269
|
+
"id": 2,
|
|
270
|
+
"label": "Process",
|
|
271
|
+
"size": 30,
|
|
272
|
+
"color": "blue",
|
|
273
|
+
"shape": "box",
|
|
274
|
+
"title": "Processing node",
|
|
275
|
+
},
|
|
276
|
+
]
|
|
277
|
+
|
|
278
|
+
edges = [
|
|
279
|
+
{
|
|
280
|
+
"from": 1,
|
|
281
|
+
"to": 2,
|
|
282
|
+
"width": 3,
|
|
283
|
+
"color": {"color": "gray"},
|
|
284
|
+
"arrows": "to",
|
|
285
|
+
"title": "Connection from Start to Process",
|
|
286
|
+
},
|
|
287
|
+
]
|
|
288
|
+
|
|
289
|
+
visnet(
|
|
290
|
+
nodes=nodes,
|
|
291
|
+
edges=edges,
|
|
292
|
+
network_title="Simple Network",
|
|
293
|
+
browserView=True,
|
|
294
|
+
)
|
|
295
|
+
```
|
|
296
|
+
|
|
297
|
+
---
|
|
298
|
+
|
|
299
|
+
## Node format for `visnet()`
|
|
300
|
+
|
|
301
|
+
Each node is a dictionary.
|
|
302
|
+
|
|
303
|
+
Required key:
|
|
304
|
+
|
|
305
|
+
| Key | Description |
|
|
306
|
+
|---|---|
|
|
307
|
+
| `id` | Unique node identifier |
|
|
308
|
+
|
|
309
|
+
Common optional keys:
|
|
310
|
+
|
|
311
|
+
| Key | Description |
|
|
312
|
+
|---|---|
|
|
313
|
+
| `label` | Text label shown near the node |
|
|
314
|
+
| `size` | Node size |
|
|
315
|
+
| `color` | Node color, for example `"red"` or `{"background": "red", "border": "black"}` |
|
|
316
|
+
| `shape` | Node shape, for example `"dot"`, `"box"`, `"triangle"`, `"star"`, `"image"`, `"icon"` |
|
|
317
|
+
| `title` | Hover tooltip |
|
|
318
|
+
| `image` | Image URL or Base64 image string for image nodes |
|
|
319
|
+
| `icon` | Font Awesome icon settings |
|
|
320
|
+
| `pos` | Optional position such as `(x, y)` |
|
|
321
|
+
|
|
322
|
+
Example:
|
|
323
|
+
|
|
324
|
+
```python
|
|
325
|
+
{
|
|
326
|
+
"id": "A",
|
|
327
|
+
"label": "Node A",
|
|
328
|
+
"size": 25,
|
|
329
|
+
"color": "orange",
|
|
330
|
+
"shape": "dot",
|
|
331
|
+
"title": "This is Node A",
|
|
332
|
+
}
|
|
333
|
+
```
|
|
334
|
+
|
|
335
|
+
---
|
|
336
|
+
|
|
337
|
+
## Edge format for `visnet()`
|
|
338
|
+
|
|
339
|
+
Each edge is a dictionary.
|
|
340
|
+
|
|
341
|
+
Required keys:
|
|
342
|
+
|
|
343
|
+
| Key | Description |
|
|
344
|
+
|---|---|
|
|
345
|
+
| `from` | Source node ID |
|
|
346
|
+
| `to` | Target node ID |
|
|
347
|
+
|
|
348
|
+
Common optional keys:
|
|
349
|
+
|
|
350
|
+
| Key | Description |
|
|
351
|
+
|---|---|
|
|
352
|
+
| `width` | Edge width |
|
|
353
|
+
| `weight` | Alternative edge weight, especially from NetworkX |
|
|
354
|
+
| `color` | Edge color, for example `{"color": "gray"}` |
|
|
355
|
+
| `arrows` | Arrow direction, for example `"to"` |
|
|
356
|
+
| `label` | Edge label |
|
|
357
|
+
| `title` | Hover tooltip |
|
|
358
|
+
| `dashes` | Dashed edge style |
|
|
359
|
+
| `smooth` | vis-network smooth edge settings |
|
|
360
|
+
|
|
361
|
+
Example:
|
|
362
|
+
|
|
363
|
+
```python
|
|
364
|
+
{
|
|
365
|
+
"from": "A",
|
|
366
|
+
"to": "B",
|
|
367
|
+
"width": 4,
|
|
368
|
+
"color": {"color": "black"},
|
|
369
|
+
"arrows": "to",
|
|
370
|
+
"title": "A shares knowledge with B",
|
|
371
|
+
}
|
|
372
|
+
```
|
|
373
|
+
|
|
374
|
+
---
|
|
375
|
+
|
|
376
|
+
## `netMap()` overview
|
|
377
|
+
|
|
378
|
+
`netMap()` creates an interactive geographical network map.
|
|
379
|
+
|
|
380
|
+
Basic usage:
|
|
381
|
+
|
|
382
|
+
```python
|
|
383
|
+
netMap(
|
|
384
|
+
cities_data,
|
|
385
|
+
connections_data,
|
|
386
|
+
title="Network Map",
|
|
387
|
+
maximum_nodes=100,
|
|
388
|
+
writeHTML="network_map.html",
|
|
389
|
+
browserView=False,
|
|
390
|
+
)
|
|
391
|
+
```
|
|
392
|
+
|
|
393
|
+
---
|
|
394
|
+
|
|
395
|
+
## City/node format for `netMap()`
|
|
396
|
+
|
|
397
|
+
Each city or map node is a dictionary.
|
|
398
|
+
|
|
399
|
+
Required key:
|
|
400
|
+
|
|
401
|
+
| Key | Description |
|
|
402
|
+
|---|---|
|
|
403
|
+
| `node` | Node name or identifier |
|
|
404
|
+
|
|
405
|
+
Recommended optional keys:
|
|
406
|
+
|
|
407
|
+
| Key | Description |
|
|
408
|
+
|---|---|
|
|
409
|
+
| `lat` | Latitude |
|
|
410
|
+
| `lon` | Longitude |
|
|
411
|
+
| `size` | Marker size |
|
|
412
|
+
| `color` | Marker color |
|
|
413
|
+
| `shape` | Marker shape: `"circle"`, `"square"`, `"triangle"`, or `"star"` |
|
|
414
|
+
| `node_hover` | Tooltip text shown when hovering over the node |
|
|
415
|
+
|
|
416
|
+
Example:
|
|
417
|
+
|
|
418
|
+
```python
|
|
419
|
+
{
|
|
420
|
+
"node": "Helsinki",
|
|
421
|
+
"lat": 60.1699,
|
|
422
|
+
"lon": 24.9384,
|
|
423
|
+
"size": 12,
|
|
424
|
+
"color": "blue",
|
|
425
|
+
"shape": "circle",
|
|
426
|
+
"node_hover": "Helsinki, Finland",
|
|
427
|
+
}
|
|
428
|
+
```
|
|
429
|
+
|
|
430
|
+
If latitude and longitude are missing, `netMap()` may attempt to geocode the location name using `geopy` and Nominatim, depending on the installed version and function settings.
|
|
431
|
+
|
|
432
|
+
---
|
|
433
|
+
|
|
434
|
+
## Connection format for `netMap()`
|
|
435
|
+
|
|
436
|
+
Each connection is a dictionary.
|
|
437
|
+
|
|
438
|
+
Required keys:
|
|
439
|
+
|
|
440
|
+
| Key | Description |
|
|
441
|
+
|---|---|
|
|
442
|
+
| `node1` | Source node name |
|
|
443
|
+
| `node2` | Target node name |
|
|
444
|
+
|
|
445
|
+
Common optional keys:
|
|
446
|
+
|
|
447
|
+
| Key | Description |
|
|
448
|
+
|---|---|
|
|
449
|
+
| `color` | Line color |
|
|
450
|
+
| `width` | Line width |
|
|
451
|
+
| `style` | `"solid"`, `"dashed"`, or `"dotted"` |
|
|
452
|
+
| `arrow` | `True` or `False` |
|
|
453
|
+
| `curve` | `True` or `False` |
|
|
454
|
+
| `edge_hover` | Tooltip text shown when hovering over the edge |
|
|
455
|
+
|
|
456
|
+
Example:
|
|
457
|
+
|
|
458
|
+
```python
|
|
459
|
+
{
|
|
460
|
+
"node1": "Helsinki",
|
|
461
|
+
"node2": "Joensuu",
|
|
462
|
+
"color": "darkblue",
|
|
463
|
+
"width": 3,
|
|
464
|
+
"style": "solid",
|
|
465
|
+
"arrow": True,
|
|
466
|
+
"curve": True,
|
|
467
|
+
"edge_hover": "Connection from Helsinki to Joensuu",
|
|
468
|
+
}
|
|
469
|
+
```
|
|
470
|
+
|
|
471
|
+
---
|
|
472
|
+
|
|
473
|
+
## Example: Finnish destination network map
|
|
474
|
+
|
|
475
|
+
```python
|
|
476
|
+
from visnetmap import netMap
|
|
477
|
+
|
|
478
|
+
cities = [
|
|
479
|
+
{
|
|
480
|
+
"node": "Helsinki",
|
|
481
|
+
"lat": 60.1699,
|
|
482
|
+
"lon": 24.9384,
|
|
483
|
+
"size": 15,
|
|
484
|
+
"color": "blue",
|
|
485
|
+
"shape": "circle",
|
|
486
|
+
"node_hover": "Helsinki",
|
|
487
|
+
},
|
|
488
|
+
{
|
|
489
|
+
"node": "Joensuu",
|
|
490
|
+
"lat": 62.6010,
|
|
491
|
+
"lon": 29.7636,
|
|
492
|
+
"size": 10,
|
|
493
|
+
"color": "green",
|
|
494
|
+
"shape": "star",
|
|
495
|
+
"node_hover": "Joensuu",
|
|
496
|
+
},
|
|
497
|
+
{
|
|
498
|
+
"node": "Kuopio",
|
|
499
|
+
"lat": 62.8924,
|
|
500
|
+
"lon": 27.6770,
|
|
501
|
+
"size": 10,
|
|
502
|
+
"color": "orange",
|
|
503
|
+
"shape": "square",
|
|
504
|
+
"node_hover": "Kuopio",
|
|
505
|
+
},
|
|
506
|
+
]
|
|
507
|
+
|
|
508
|
+
connections = [
|
|
509
|
+
{
|
|
510
|
+
"node1": "Helsinki",
|
|
511
|
+
"node2": "Joensuu",
|
|
512
|
+
"color": "blue",
|
|
513
|
+
"width": 3,
|
|
514
|
+
"arrow": True,
|
|
515
|
+
"curve": True,
|
|
516
|
+
"edge_hover": "Helsinki to Joensuu",
|
|
517
|
+
},
|
|
518
|
+
{
|
|
519
|
+
"node1": "Helsinki",
|
|
520
|
+
"node2": "Kuopio",
|
|
521
|
+
"color": "orange",
|
|
522
|
+
"width": 2,
|
|
523
|
+
"arrow": True,
|
|
524
|
+
"curve": True,
|
|
525
|
+
"edge_hover": "Helsinki to Kuopio",
|
|
526
|
+
},
|
|
527
|
+
]
|
|
528
|
+
|
|
529
|
+
netMap(
|
|
530
|
+
cities,
|
|
531
|
+
connections,
|
|
532
|
+
title="Finnish Destination Network",
|
|
533
|
+
writeHTML="finland_destination_network.html",
|
|
534
|
+
browserView=True,
|
|
535
|
+
)
|
|
536
|
+
```
|
|
537
|
+
|
|
538
|
+
---
|
|
539
|
+
|
|
540
|
+
## Output files
|
|
541
|
+
|
|
542
|
+
By default, `visnet()` writes network HTML files to:
|
|
543
|
+
|
|
544
|
+
```text
|
|
545
|
+
netOutPut/
|
|
546
|
+
```
|
|
547
|
+
|
|
548
|
+
and `netMap()` writes map HTML files to:
|
|
549
|
+
|
|
550
|
+
```text
|
|
551
|
+
mapOutPut/
|
|
552
|
+
```
|
|
553
|
+
|
|
554
|
+
Example:
|
|
555
|
+
|
|
556
|
+
```python
|
|
557
|
+
visnet(G, writeHTML="my_network.html")
|
|
558
|
+
```
|
|
559
|
+
|
|
560
|
+
creates:
|
|
561
|
+
|
|
562
|
+
```text
|
|
563
|
+
netOutPut/my_network.html
|
|
564
|
+
```
|
|
565
|
+
|
|
566
|
+
Example:
|
|
567
|
+
|
|
568
|
+
```python
|
|
569
|
+
netMap(cities, connections, writeHTML="my_map.html")
|
|
570
|
+
```
|
|
571
|
+
|
|
572
|
+
creates:
|
|
573
|
+
|
|
574
|
+
```text
|
|
575
|
+
mapOutPut/my_map.html
|
|
576
|
+
```
|
|
577
|
+
|
|
578
|
+
---
|
|
579
|
+
|
|
580
|
+
## Tile provider note for maps
|
|
581
|
+
|
|
582
|
+
`netMap()` uses web map tiles through Leaflet. Depending on your configuration, map tiles may come from providers such as CARTO, OpenStreetMap, Esri, or other services.
|
|
583
|
+
|
|
584
|
+
For public or high-traffic use, avoid relying directly on OpenStreetMap volunteer tile servers. Use a proper tile provider or your own tile server if needed.
|
|
585
|
+
|
|
586
|
+
Example with CARTO tiles:
|
|
587
|
+
|
|
588
|
+
```python
|
|
589
|
+
netMap(
|
|
590
|
+
cities,
|
|
591
|
+
connections,
|
|
592
|
+
title="Map with CARTO tiles",
|
|
593
|
+
tile_url="https://{s}.basemaps.cartocdn.com/light_all/{z}/{x}/{y}{r}.png",
|
|
594
|
+
tile_attribution='© <a href="https://www.openstreetmap.org/copyright">OpenStreetMap</a> contributors © <a href="https://carto.com/attributions">CARTO</a>',
|
|
595
|
+
browserView=True,
|
|
596
|
+
)
|
|
597
|
+
```
|
|
598
|
+
|
|
599
|
+
---
|
|
600
|
+
|
|
601
|
+
## Geocoding note
|
|
602
|
+
|
|
603
|
+
If you use `latLong()` or provide map nodes without latitude and longitude, geocoding may be performed through Nominatim using `geopy`.
|
|
604
|
+
|
|
605
|
+
Please respect Nominatim usage policies and avoid sending large volumes of requests.
|
|
606
|
+
|
|
607
|
+
For larger datasets, it is recommended to prepare latitude and longitude values in advance.
|
|
608
|
+
|
|
609
|
+
Example:
|
|
610
|
+
|
|
611
|
+
```python
|
|
612
|
+
from visnetmap import latLong
|
|
613
|
+
|
|
614
|
+
lat, lon, address = latLong("Joensuu, Finland")
|
|
615
|
+
|
|
616
|
+
print(lat, lon, address)
|
|
617
|
+
```
|
|
618
|
+
|
|
619
|
+
---
|
|
620
|
+
|
|
621
|
+
## Helper: convert images to Base64
|
|
622
|
+
|
|
623
|
+
For image nodes in `visnet()`, local images can be converted to Base64 strings.
|
|
624
|
+
|
|
625
|
+
```python
|
|
626
|
+
from visnetmap import base64_from_loc, visnet
|
|
627
|
+
|
|
628
|
+
image_data = base64_from_loc("logo.png")
|
|
629
|
+
|
|
630
|
+
nodes = [
|
|
631
|
+
{
|
|
632
|
+
"id": "logo",
|
|
633
|
+
"label": "Logo node",
|
|
634
|
+
"shape": "image",
|
|
635
|
+
"image": image_data,
|
|
636
|
+
"size": 30,
|
|
637
|
+
}
|
|
638
|
+
]
|
|
639
|
+
|
|
640
|
+
visnet(nodes=nodes, edges=[], network_title="Image Node Demo", browserView=True)
|
|
641
|
+
```
|
|
642
|
+
|
|
643
|
+
---
|
|
644
|
+
|
|
645
|
+
## Common problems
|
|
646
|
+
|
|
647
|
+
### NetworkX edge weight error
|
|
648
|
+
|
|
649
|
+
If an edge weight is written as a string:
|
|
650
|
+
|
|
651
|
+
```python
|
|
652
|
+
("B", "C", "2")
|
|
653
|
+
```
|
|
654
|
+
|
|
655
|
+
change it to a number:
|
|
656
|
+
|
|
657
|
+
```python
|
|
658
|
+
("B", "C", 2)
|
|
659
|
+
```
|
|
660
|
+
|
|
661
|
+
Edge widths and weights should be numeric.
|
|
662
|
+
|
|
663
|
+
---
|
|
664
|
+
|
|
665
|
+
### Map tiles show `403 Access blocked`
|
|
666
|
+
|
|
667
|
+
This usually means the selected map tile provider blocked the request.
|
|
668
|
+
|
|
669
|
+
Possible solutions:
|
|
670
|
+
|
|
671
|
+
- use a different tile provider,
|
|
672
|
+
- avoid heavy automated tile loading,
|
|
673
|
+
- use a valid tile service for public applications,
|
|
674
|
+
- use CARTO or another provider instead of direct OpenStreetMap volunteer tiles.
|
|
675
|
+
|
|
676
|
+
---
|
|
677
|
+
|
|
678
|
+
### Generated HTML does not show correctly offline
|
|
679
|
+
|
|
680
|
+
The generated HTML may load JavaScript and CSS from external CDNs, such as:
|
|
681
|
+
|
|
682
|
+
- vis-network
|
|
683
|
+
- Leaflet
|
|
684
|
+
- Leaflet.markercluster
|
|
685
|
+
- map tile providers
|
|
686
|
+
|
|
687
|
+
An internet connection may be required when opening the HTML file.
|
|
688
|
+
|
|
689
|
+
---
|
|
690
|
+
|
|
691
|
+
## Development
|
|
692
|
+
|
|
693
|
+
Clone the repository:
|
|
694
|
+
|
|
695
|
+
```bash
|
|
696
|
+
git clone https://github.com/Atsaniik/visnetmap.git
|
|
697
|
+
cd visnetmap
|
|
698
|
+
```
|
|
699
|
+
|
|
700
|
+
Create and activate a virtual environment:
|
|
701
|
+
|
|
702
|
+
```bash
|
|
703
|
+
python -m venv .venv
|
|
704
|
+
```
|
|
705
|
+
|
|
706
|
+
Windows PowerShell:
|
|
707
|
+
|
|
708
|
+
```bash
|
|
709
|
+
.venv\Scripts\Activate.ps1
|
|
710
|
+
```
|
|
711
|
+
|
|
712
|
+
macOS/Linux:
|
|
713
|
+
|
|
714
|
+
```bash
|
|
715
|
+
source .venv/bin/activate
|
|
716
|
+
```
|
|
717
|
+
|
|
718
|
+
Install in editable mode:
|
|
719
|
+
|
|
720
|
+
```bash
|
|
721
|
+
pip install -e ".[dev]"
|
|
722
|
+
```
|
|
723
|
+
|
|
724
|
+
Run tests:
|
|
725
|
+
|
|
726
|
+
```bash
|
|
727
|
+
pytest
|
|
728
|
+
```
|
|
729
|
+
|
|
730
|
+
Build the package:
|
|
731
|
+
|
|
732
|
+
```bash
|
|
733
|
+
python -m build
|
|
734
|
+
```
|
|
735
|
+
|
|
736
|
+
Check the distribution:
|
|
737
|
+
|
|
738
|
+
```bash
|
|
739
|
+
twine check dist/*
|
|
740
|
+
```
|
|
741
|
+
|
|
742
|
+
---
|
|
743
|
+
|
|
744
|
+
|
|
745
|
+
|
|
746
|
+
## Citation
|
|
747
|
+
|
|
748
|
+
If you use `visnetmap` in academic work, teaching, presentations, or research demos, please cite or acknowledge the package and the related project page:
|
|
749
|
+
|
|
750
|
+
```text
|
|
751
|
+
visnetmap: Interactive network and map visualization tools in Python.
|
|
752
|
+
Available at: https://github.com/Atsaniik/visnetmap
|
|
753
|
+
Demo: https://atsaniik.github.io/Finland_DMOs_Vienna/
|
|
754
|
+
```
|
|
755
|
+
|
|
756
|
+
---
|
|
757
|
+
|
|
758
|
+
## License
|
|
759
|
+
|
|
760
|
+
This project is released under the MIT License.
|
|
761
|
+
|
|
762
|
+
See the `LICENSE` file for details.
|
|
763
|
+
|
|
764
|
+
---
|
|
765
|
+
|
|
766
|
+
## Author
|
|
767
|
+
|
|
768
|
+
Developed by Atsaniik.
|
|
769
|
+
|
|
770
|
+
GitHub: [https://github.com/Atsaniik](https://github.com/Atsaniik)
|
|
771
|
+
|
|
772
|
+
Demo page: [https://atsaniik.github.io/Finland_DMOs_Vienna/](https://atsaniik.github.io/Finland_DMOs_Vienna/)
|