viewx 0.2.3__tar.gz → 0.3.0__tar.gz
This diff represents the content of publicly available package versions that have been released to one of the supported registries. The information contained in this diff is provided for informational purposes only and reflects changes between package versions as they appear in their respective public registries.
- viewx-0.3.0/PKG-INFO +337 -0
- viewx-0.3.0/README.md +301 -0
- viewx-0.3.0/pyproject.toml +62 -0
- viewx-0.3.0/tests/test_dashboard.py +36 -0
- viewx-0.3.0/tests/test_datamatrix.py +44 -0
- viewx-0.3.0/tests/test_plot.py +79 -0
- viewx-0.3.0/tests/test_report.py +46 -0
- viewx-0.3.0/tests/test_slides.py +35 -0
- viewx-0.3.0/tests/test_themes.py +43 -0
- viewx-0.3.0/viewx/DataMatrix/__init__.py +30 -0
- viewx-0.3.0/viewx/DataMatrix/analyzers.py +313 -0
- viewx-0.3.0/viewx/DataMatrix/bibliometrics.py +143 -0
- viewx-0.3.0/viewx/DataMatrix/datamatrix_engine.py +1385 -0
- viewx-0.3.0/viewx/DataMatrix/explorer.py +114 -0
- viewx-0.3.0/viewx/DataMatrix/visualizer.py +512 -0
- viewx-0.3.0/viewx/HTML/__init__.py +7 -0
- {viewx-0.2.3 → viewx-0.3.0}/viewx/HTML/html_engine.py +504 -345
- viewx-0.3.0/viewx/Report/auto_builder.py +161 -0
- viewx-0.3.0/viewx/Report/report_engine.py +416 -0
- {viewx-0.2.3 → viewx-0.3.0}/viewx/Slides/__init__.py +1 -0
- viewx-0.3.0/viewx/Slides/auto_builder.py +141 -0
- {viewx-0.2.3 → viewx-0.3.0}/viewx/Slides/charts.py +22 -0
- {viewx-0.2.3 → viewx-0.3.0}/viewx/Slides/slides_engine.py +175 -87
- viewx-0.3.0/viewx/__init__.py +77 -0
- {viewx-0.2.3 → viewx-0.3.0}/viewx/datasets/__init__.py +89 -114
- viewx-0.3.0/viewx/plot/__init__.py +152 -0
- viewx-0.3.0/viewx/plot/factory.py +251 -0
- viewx-0.3.0/viewx/py.typed +0 -0
- viewx-0.3.0/viewx/shared/__init__.py +23 -0
- viewx-0.3.0/viewx/shared/a11y.py +24 -0
- viewx-0.3.0/viewx/shared/column_profile.py +138 -0
- viewx-0.3.0/viewx/shared/explorer_runtime.py +523 -0
- viewx-0.3.0/viewx/shared/insights.py +121 -0
- viewx-0.3.0/viewx/shared/plotly_bundle.py +28 -0
- viewx-0.3.0/viewx/shared/runtime.py +237 -0
- viewx-0.3.0/viewx/shared/stats_payload.py +320 -0
- viewx-0.3.0/viewx/shared/themes.py +158 -0
- viewx-0.3.0/viewx.egg-info/PKG-INFO +337 -0
- {viewx-0.2.3 → viewx-0.3.0}/viewx.egg-info/SOURCES.txt +24 -9
- viewx-0.3.0/viewx.egg-info/requires.txt +18 -0
- viewx-0.2.3/PKG-INFO +0 -382
- viewx-0.2.3/README.md +0 -328
- viewx-0.2.3/setup.py +0 -68
- viewx-0.2.3/tests/test1.py +0 -150
- viewx-0.2.3/tests/test2.py +0 -39
- viewx-0.2.3/tests/test3.py +0 -138
- viewx-0.2.3/tests/test4.py +0 -74
- viewx-0.2.3/tests/test5.py +0 -43
- viewx-0.2.3/tests/test6.py +0 -45
- viewx-0.2.3/tests/test7.py +0 -1514
- viewx-0.2.3/viewx/DataMatrix/__init__.py +0 -3
- viewx-0.2.3/viewx/DataMatrix/bibliometrics.py +0 -52
- viewx-0.2.3/viewx/DataMatrix/datamatrix_engine.py +0 -184
- viewx-0.2.3/viewx/DataMatrix/visualizer.py +0 -75
- viewx-0.2.3/viewx/HTML/__init__.py +0 -6
- viewx-0.2.3/viewx/Report/report_engine.py +0 -246
- viewx-0.2.3/viewx/__init__.py +0 -42
- viewx-0.2.3/viewx.egg-info/PKG-INFO +0 -382
- viewx-0.2.3/viewx.egg-info/requires.txt +0 -27
- {viewx-0.2.3 → viewx-0.3.0}/setup.cfg +0 -0
- {viewx-0.2.3 → viewx-0.3.0}/viewx/Report/__init__.py +0 -0
- {viewx-0.2.3 → viewx-0.3.0}/viewx/Slides/components.py +0 -0
- {viewx-0.2.3 → viewx-0.3.0}/viewx/datasets/course_completion.csv +0 -0
- {viewx-0.2.3 → viewx-0.3.0}/viewx/datasets/iris.csv +0 -0
- {viewx-0.2.3 → viewx-0.3.0}/viewx/datasets/penguins.csv +0 -0
- {viewx-0.2.3 → viewx-0.3.0}/viewx/datasets/sp500_companies.csv +0 -0
- {viewx-0.2.3 → viewx-0.3.0}/viewx/datasets/titanic.csv +0 -0
- {viewx-0.2.3 → viewx-0.3.0}/viewx.egg-info/dependency_links.txt +0 -0
- {viewx-0.2.3 → viewx-0.3.0}/viewx.egg-info/top_level.txt +0 -0
viewx-0.3.0/PKG-INFO
ADDED
|
@@ -0,0 +1,337 @@
|
|
|
1
|
+
Metadata-Version: 2.4
|
|
2
|
+
Name: viewx
|
|
3
|
+
Version: 0.3.0
|
|
4
|
+
Summary: Librería de visualización adaptable para HTML, Dashboards y PDFs en Python
|
|
5
|
+
Author-email: Emmanuel Ascendra Perez <ascendraemmanuel@gmail.com>
|
|
6
|
+
License: MIT
|
|
7
|
+
Project-URL: Repositorio, https://github.com/GhostAnalyst30/ViewX
|
|
8
|
+
Classifier: Development Status :: 3 - Alpha
|
|
9
|
+
Classifier: Intended Audience :: Science/Research
|
|
10
|
+
Classifier: Intended Audience :: Developers
|
|
11
|
+
Classifier: Topic :: Scientific/Engineering :: Visualization
|
|
12
|
+
Classifier: License :: OSI Approved :: MIT License
|
|
13
|
+
Classifier: Programming Language :: Python :: 3
|
|
14
|
+
Classifier: Programming Language :: Python :: 3.8
|
|
15
|
+
Classifier: Programming Language :: Python :: 3.9
|
|
16
|
+
Classifier: Programming Language :: Python :: 3.10
|
|
17
|
+
Classifier: Programming Language :: Python :: 3.11
|
|
18
|
+
Classifier: Programming Language :: Python :: 3.12
|
|
19
|
+
Classifier: Programming Language :: Python :: 3.13
|
|
20
|
+
Requires-Python: >=3.8
|
|
21
|
+
Description-Content-Type: text/markdown
|
|
22
|
+
Requires-Dist: numpy>=1.25.0
|
|
23
|
+
Requires-Dist: pandas>=2.1.0
|
|
24
|
+
Requires-Dist: plotly>=6.0.0
|
|
25
|
+
Provides-Extra: static
|
|
26
|
+
Requires-Dist: matplotlib>=3.8.0; extra == "static"
|
|
27
|
+
Provides-Extra: pdf
|
|
28
|
+
Requires-Dist: pylatex>=1.4.2; extra == "pdf"
|
|
29
|
+
Requires-Dist: matplotlib>=3.8.0; extra == "pdf"
|
|
30
|
+
Provides-Extra: export
|
|
31
|
+
Requires-Dist: kaleido>=0.2.1; extra == "export"
|
|
32
|
+
Provides-Extra: all
|
|
33
|
+
Requires-Dist: matplotlib>=3.8.0; extra == "all"
|
|
34
|
+
Requires-Dist: pylatex>=1.4.2; extra == "all"
|
|
35
|
+
Requires-Dist: kaleido>=0.2.1; extra == "all"
|
|
36
|
+
|
|
37
|
+
# ViewX — v0.3.0
|
|
38
|
+
|
|
39
|
+
**ViewX** es una librería de visualización para Python enfocada en **analistas de datos e ingenieros**: gráficas interactivas y estáticas en una línea, dashboards HTML, reportes EDA, presentaciones y PDFs — todo con una API unificada y mínima.
|
|
40
|
+
|
|
41
|
+
**Documentación completa + playground en línea:** https://viewx.vercel.app/ (sitio Next.js en `web/` de este repo — la `Documentation_Page/` estática queda como archivo histórico).
|
|
42
|
+
|
|
43
|
+
```python
|
|
44
|
+
import viewx as vx
|
|
45
|
+
df = vx.load_dataset("iris.csv")
|
|
46
|
+
|
|
47
|
+
vx.plot(df, x="sepal_length", y="petal_length") # gráfica interactiva en 1 línea
|
|
48
|
+
vx.Dashboard.auto(df).save("dash.html") # dashboard automático
|
|
49
|
+
vx.DataMatrix(df).analyze().save("eda.html") # reporte EDA interactivo
|
|
50
|
+
vx.Presentation.auto(df).save("slides.html") # slides automáticas
|
|
51
|
+
vx.Report.auto(df).save("reporte.pdf") # PDF (requiere pdflatex)
|
|
52
|
+
```
|
|
53
|
+
|
|
54
|
+
---
|
|
55
|
+
|
|
56
|
+
## Características principales
|
|
57
|
+
|
|
58
|
+
- **`vx.plot()`**: una llamada para 14 tipos de gráfica, interactiva (Plotly) o estática (matplotlib).
|
|
59
|
+
- **API unificada**: todos los motores exportan con `.save(path)` y `.show()`.
|
|
60
|
+
- **Temas compartidos**: un mismo nombre de tema (`dark_enterprise`, `glass_ocean`, …) funciona en dashboards, slides, EDA y gráficas. `vx.set_theme()` lo fija globalmente.
|
|
61
|
+
- **Modo automático**: `Dashboard.auto()`, `Presentation.auto()`, `Report.auto()` analizan el DataFrame y eligen KPIs y gráficas por ti.
|
|
62
|
+
- **Pensado para datasets grandes**: downsampling automático (>10k puntos), WebGL para scatter grandes, muestreo estratificado en el explorador EDA.
|
|
63
|
+
- **Ligero**: núcleo con solo numpy + pandas + plotly. matplotlib y pylatex son extras opcionales.
|
|
64
|
+
|
|
65
|
+
---
|
|
66
|
+
|
|
67
|
+
## Instalación
|
|
68
|
+
|
|
69
|
+
```bash
|
|
70
|
+
pip install viewx # núcleo interactivo
|
|
71
|
+
pip install viewx[static] # + gráficas estáticas (matplotlib)
|
|
72
|
+
pip install viewx[pdf] # + reportes PDF (pylatex; requiere pdflatex)
|
|
73
|
+
pip install viewx[all] # todo
|
|
74
|
+
```
|
|
75
|
+
|
|
76
|
+
---
|
|
77
|
+
|
|
78
|
+
## Gráficas rápidas: `vx.plot()`
|
|
79
|
+
|
|
80
|
+
```python
|
|
81
|
+
import viewx as vx
|
|
82
|
+
|
|
83
|
+
# Interactiva (Plotly). En notebook se muestra sola.
|
|
84
|
+
vx.plot(df, kind="bar", x="region", y="revenue", title="Ventas por región")
|
|
85
|
+
|
|
86
|
+
# El tipo se infiere de los dtypes si no pasas `kind`
|
|
87
|
+
vx.plot(df, x="date", y="revenue") # datetime -> line
|
|
88
|
+
vx.plot(df, x="precio", y="margen") # num-num -> scatter
|
|
89
|
+
|
|
90
|
+
# Estática (matplotlib) para papers / PDFs
|
|
91
|
+
vx.plot(df, kind="histogram", x="edad", static=True).save("hist.png")
|
|
92
|
+
|
|
93
|
+
# Objeto Chart: .save(), .show(), .fig (figura Plotly/matplotlib subyacente)
|
|
94
|
+
chart = vx.plot(df, kind="donut", x="pais", y="ventas")
|
|
95
|
+
chart.save("donut.html")
|
|
96
|
+
```
|
|
97
|
+
|
|
98
|
+
Tipos disponibles: `line`, `bar`, `bar_h`, `scatter`, `area`, `pie`, `donut`, `histogram`, `box`, `violin`, `heatmap`, `funnel`, `treemap`, `bubble`.
|
|
99
|
+
|
|
100
|
+
Series con más de 10.000 puntos se reducen automáticamente (desactivable con `downsample=False`); los scatter grandes usan WebGL.
|
|
101
|
+
|
|
102
|
+
---
|
|
103
|
+
|
|
104
|
+
## Temas
|
|
105
|
+
|
|
106
|
+
Seis temas canónicos válidos en **todos** los motores:
|
|
107
|
+
`corporate_blue` · `dark_enterprise` · `modern_green` · `void_indigo` · `glass_ocean` · `cyberpunk_neon`
|
|
108
|
+
|
|
109
|
+
```python
|
|
110
|
+
vx.set_theme("dark_enterprise") # tema global por defecto
|
|
111
|
+
vx.Dashboard.auto(df).save("a.html") # usa el tema global
|
|
112
|
+
vx.Presentation.auto(df, theme="glass_ocean") # o por artefacto
|
|
113
|
+
```
|
|
114
|
+
|
|
115
|
+
---
|
|
116
|
+
|
|
117
|
+
## Dashboards HTML
|
|
118
|
+
|
|
119
|
+
```python
|
|
120
|
+
import viewx as vx
|
|
121
|
+
|
|
122
|
+
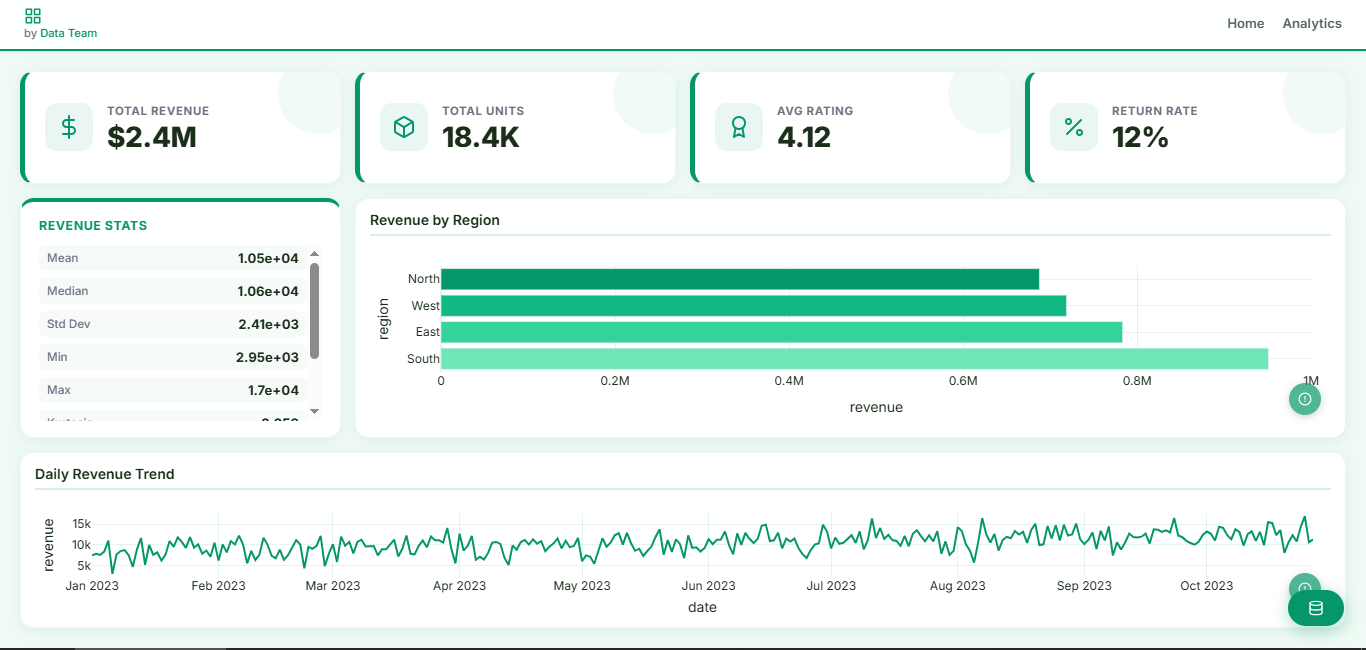
# Automático: analiza el DataFrame y arma KPIs + gráficas
|
|
123
|
+
vx.Dashboard.auto(df, theme="modern_green", title="Ventas").save("dash.html")
|
|
124
|
+
|
|
125
|
+
# Manual: grid de 12 columnas
|
|
126
|
+
dash = vx.Dashboard(
|
|
127
|
+
title="Manual Dashboard", theme="modern_green",
|
|
128
|
+
cols=12, rows=9,
|
|
129
|
+
navbar={"title": "Manual Dashboard", "items": [{"label": "Home", "link": "#"}]},
|
|
130
|
+
authors=[{"name": "Data Team", "email": "data@acme.com"}],
|
|
131
|
+
data_button=True, df=df,
|
|
132
|
+
)
|
|
133
|
+
dash.add_valuebox("Total Revenue", "$2.4M", icon_key="dollar", row=1, col=1, height=2, width=3)
|
|
134
|
+
dash.add_infobox(df=df, variable="revenue", info=["mean", "median", "std"], row=3, col=1, height=4, width=3)
|
|
135
|
+
dash.add_chart(vx.plot(df, kind="bar_h", x="region", y="revenue"), # acepta Charts de vx.plot
|
|
136
|
+
title="Revenue by Region", row=3, col=4, height=4, width=9)
|
|
137
|
+
dash.add_chart(data=df, chart_type="line", x="date", y="revenue", # o data + chart_type
|
|
138
|
+
title="Daily Trend", row=7, col=1, height=3, width=12)
|
|
139
|
+
dash.save("demo_manual.html") # dash.show() para abrir en el navegador
|
|
140
|
+
```
|
|
141
|
+
|
|
142
|
+
|
|
143
|
+
|
|
144
|
+
---
|
|
145
|
+
|
|
146
|
+
## Presentaciones
|
|
147
|
+
|
|
148
|
+
```python
|
|
149
|
+
from viewx import Presentation, Slide
|
|
150
|
+
from viewx.Slides import Title, Subtitle, BulletList, BarPlot, PlotlyChart
|
|
151
|
+
|
|
152
|
+
# Automática
|
|
153
|
+
Presentation.auto(df, title="Dataset Overview", theme="void_indigo").save("auto_slides.html")
|
|
154
|
+
|
|
155
|
+
# Manual
|
|
156
|
+
pres = Presentation("Demo ViewX Slides", theme="dark_enterprise")
|
|
157
|
+
pres.font("Inter").meta(author="ViewX", date="2026")
|
|
158
|
+
|
|
159
|
+
with Slide(title="Bienvenida", notes="Portada"):
|
|
160
|
+
Title("Slides Engine").center("x").pos(top=10).zoom_in(duration=1.2)
|
|
161
|
+
Subtitle("Presentaciones HTML desde Python").center("x").pos(top=26)
|
|
162
|
+
BulletList(["Animaciones CSS", "Gráficos Plotly", "Componentes reutilizables"]).pos(left=8, top=42)
|
|
163
|
+
|
|
164
|
+
with Slide(title="Gráficos"):
|
|
165
|
+
Title("Plotly integrado").pos(left=6, top=7)
|
|
166
|
+
BarPlot(["A", "B", "C"], [24, 38, 31], title="BarPlot").pos(left=7, top=30).size(width="40%", height="50%")
|
|
167
|
+
PlotlyChart.from_figure(vx.plot(df, kind="donut", x="region", y="revenue")) # embebe un Chart
|
|
168
|
+
|
|
169
|
+
pres.save("viewx_slides_demo.html")
|
|
170
|
+
```
|
|
171
|
+
|
|
172
|
+
---
|
|
173
|
+
|
|
174
|
+
## Reportes PDF
|
|
175
|
+
|
|
176
|
+
Requiere `pip install viewx[pdf]` y `pdflatex` en el sistema. Sin strings LaTeX: fracciones para anchos, colores CSS en cajas.
|
|
177
|
+
|
|
178
|
+
```python
|
|
179
|
+
from viewx import Report
|
|
180
|
+
|
|
181
|
+
# Automático: reporte de calidad del dataset
|
|
182
|
+
Report.auto(df, title="Quality Report").save("reporte.pdf")
|
|
183
|
+
|
|
184
|
+
# Manual
|
|
185
|
+
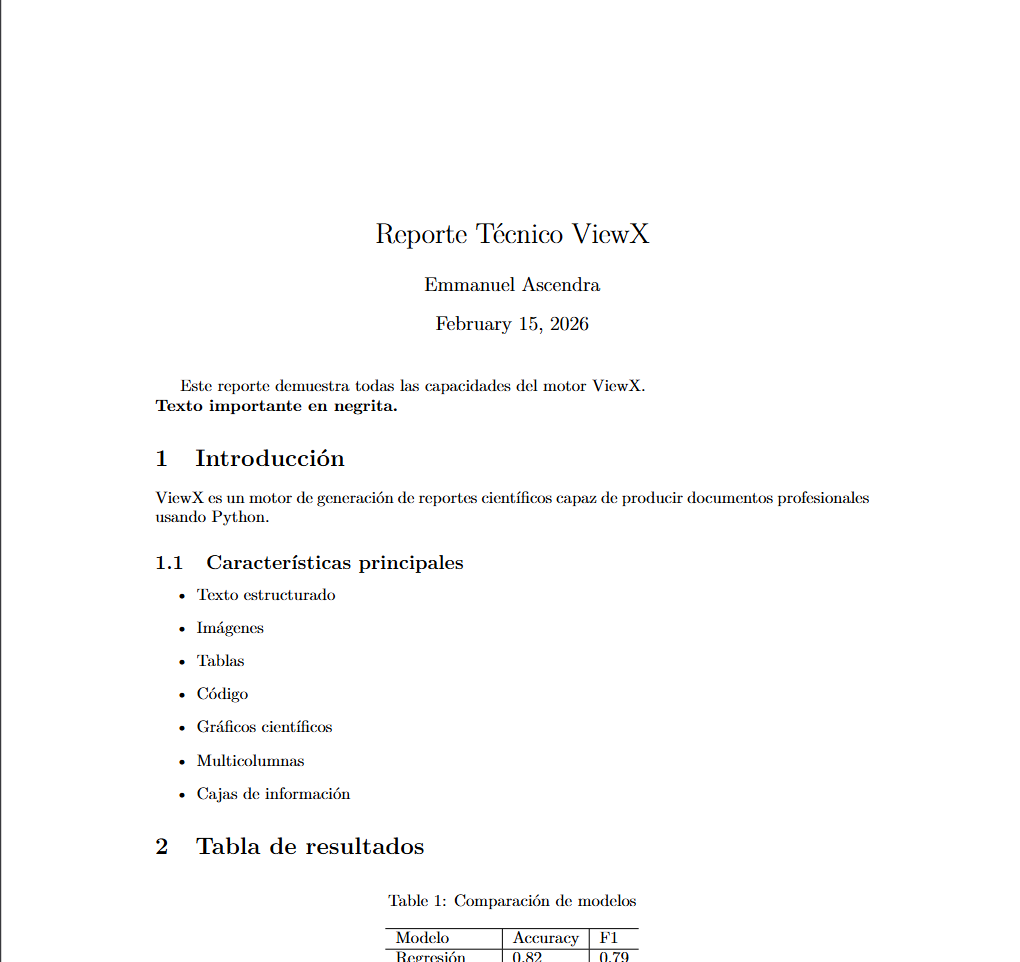
r = Report(title="Reporte Técnico", author="Emmanuel Ascendra")
|
|
186
|
+
r.text("Este reporte demuestra el motor ViewX.", bold=True)
|
|
187
|
+
|
|
188
|
+
with r.section("Introducción"):
|
|
189
|
+
r.text("ViewX genera documentos profesionales desde Python.")
|
|
190
|
+
with r.subsection("Características"):
|
|
191
|
+
r.bullets(["Texto estructurado", "Tablas", "Gráficos", "Cajas de información"])
|
|
192
|
+
|
|
193
|
+
with r.section("Resultados"):
|
|
194
|
+
r.add_table(
|
|
195
|
+
headers=["Modelo", "Accuracy", "F1"],
|
|
196
|
+
rows=[["Regresión", 0.82, 0.79], ["Red neuronal", 0.94, 0.92]],
|
|
197
|
+
caption="Comparación de modelos",
|
|
198
|
+
)
|
|
199
|
+
r.add_image("assets/ejemplo.png", caption="Imagen", width=0.6) # fracción del ancho
|
|
200
|
+
r.add_line_plot(x=[0, 1, 2, 3], y=[0, 1, 4, 9], caption="Crecimiento cuadrático")
|
|
201
|
+
r.add_box("Observación", "Todo se genera desde Python.", color="#DBEAFE") # color CSS
|
|
202
|
+
|
|
203
|
+
r.save("reporte_demo.pdf")
|
|
204
|
+
```
|
|
205
|
+
|
|
206
|
+
|
|
207
|
+
|
|
208
|
+
---
|
|
209
|
+
|
|
210
|
+
## Análisis EDA con DataMatrix
|
|
211
|
+
|
|
212
|
+
```python
|
|
213
|
+
from viewx import DataMatrix
|
|
214
|
+
|
|
215
|
+
dm = DataMatrix(df)
|
|
216
|
+
dm.clean_data(drop_duplicates=True, fill_na=True)
|
|
217
|
+
dm.analyze()
|
|
218
|
+
|
|
219
|
+
print(dm.summary()) # métricas clave
|
|
220
|
+
print(dm.alerts()) # advertencias de calidad
|
|
221
|
+
print(dm.highlights()) # fortalezas del dataset
|
|
222
|
+
|
|
223
|
+
dm.save("eda.html", theme="dark_enterprise") # reporte completo con explorador interactivo
|
|
224
|
+
# En una línea: DataMatrix(df).analyze().save("eda.html")
|
|
225
|
+
```
|
|
226
|
+
|
|
227
|
+
El reporte incluye Overview, perfil por variable, correlaciones, explorador interactivo con filtros (muestreo estratificado para datasets grandes) y muestra paginada.
|
|
228
|
+
|
|
229
|
+
---
|
|
230
|
+
|
|
231
|
+
## Integración StatsLibX y SynaptIX
|
|
232
|
+
|
|
233
|
+
ViewX es el **motor de visualización y reportes** del ecosistema GhostAnalyst, junto con [StatsLibX](https://github.com/GhostAnalyst30/StatsLibX) (estadística) y [SynaptIX](https://github.com/GhostAnalyst30/SynaptIX) (machine learning). Las tres comparten el mismo contrato de payload y cargadores de datasets, y **cada una funciona por separado**:
|
|
234
|
+
|
|
235
|
+
```mermaid
|
|
236
|
+
flowchart TD
|
|
237
|
+
U["Datos crudos<br/>(CSV, DataFrame, arrays)"]
|
|
238
|
+
SLX["StatsLibX<br/>estadistica + manejo de datos + simulacion"]
|
|
239
|
+
SYN["SynaptIX<br/>modelos + evaluacion y mejora"]
|
|
240
|
+
VX["ViewX<br/>dashboards, EDA, PDF, slides"]
|
|
241
|
+
U --> SLX
|
|
242
|
+
U --> SYN
|
|
243
|
+
U --> VX
|
|
244
|
+
SLX -->|"DataFrame / polars"| SYN
|
|
245
|
+
SLX -->|"to_report_data() payload"| VX
|
|
246
|
+
SYN -->|"to_report_data() payload"| VX
|
|
247
|
+
SYN -->|"diagnostics() usa InferentialStats"| SLX
|
|
248
|
+
VX -->|"HTML / PDF / slides"| U
|
|
249
|
+
```
|
|
250
|
+
|
|
251
|
+
ViewX recibe payloads de StatsLibX **y de SynaptIX** vía `from_report_payload()`. El contrato es el mismo: un dict con `title`, `sections`, `tables` y opcionales `valueboxes`/`figures`.
|
|
252
|
+
|
|
253
|
+
```python
|
|
254
|
+
from statslibx import DescriptiveStats, to_report_data, load_iris
|
|
255
|
+
from viewx import from_report_payload
|
|
256
|
+
|
|
257
|
+
df = load_iris()
|
|
258
|
+
summary = DescriptiveStats(df).summary()
|
|
259
|
+
|
|
260
|
+
# Opción 1 — método directo en el resultado
|
|
261
|
+
summary.to_html("iris.html", theme="dark_enterprise", data=df)
|
|
262
|
+
|
|
263
|
+
# Opción 2 — pipeline manual
|
|
264
|
+
payload = to_report_data(summary, include_figures=True, data=df)
|
|
265
|
+
from_report_payload(payload, target="html", filename="iris.html")
|
|
266
|
+
```
|
|
267
|
+
|
|
268
|
+
Con SynaptIX (machine learning) funciona igual:
|
|
269
|
+
|
|
270
|
+
```python
|
|
271
|
+
import synaptix as sx
|
|
272
|
+
|
|
273
|
+
df = sx.load_dataset("iris")
|
|
274
|
+
X, y = df.drop(columns="species"), df["species"]
|
|
275
|
+
model = sx.supervised.RandomForestClassifier().fit(X, y)
|
|
276
|
+
|
|
277
|
+
# Método directo en el resultado (requiere pip install synaptix[viewx])
|
|
278
|
+
model.evaluate(X, y).to_html("evaluacion.html", theme="dark_enterprise")
|
|
279
|
+
|
|
280
|
+
# O pipeline manual con el mismo contrato
|
|
281
|
+
payload = model.evaluate(X, y).to_report_data(include_figures=True)
|
|
282
|
+
from_report_payload(payload, target="presentation", filename="evaluacion.html")
|
|
283
|
+
```
|
|
284
|
+
|
|
285
|
+
### Flujo completo del ecosistema (StatsLibX → SynaptIX → ViewX)
|
|
286
|
+
|
|
287
|
+
```python
|
|
288
|
+
# pip install statslibx[viewx] synaptix[viewx,stats] viewx
|
|
289
|
+
from statslibx import DescriptiveStats, load_iris
|
|
290
|
+
import synaptix as sx
|
|
291
|
+
from viewx import from_report_payload
|
|
292
|
+
|
|
293
|
+
df = load_iris()
|
|
294
|
+
|
|
295
|
+
# 1. Estadística y calidad de datos (StatsLibX)
|
|
296
|
+
DescriptiveStats(df).summary()
|
|
297
|
+
|
|
298
|
+
# 2. Modelo y evaluación (SynaptIX)
|
|
299
|
+
X, y = df.drop(columns="species"), df["species"]
|
|
300
|
+
modelo = sx.supervised.RandomForestClassifier().fit(X, y)
|
|
301
|
+
evaluacion = modelo.evaluate(X, y)
|
|
302
|
+
|
|
303
|
+
# 3. Todo en un dashboard (ViewX)
|
|
304
|
+
payload = evaluacion.to_report_data(include_figures=True)
|
|
305
|
+
from_report_payload(payload, target="html", filename="analisis.html")
|
|
306
|
+
```
|
|
307
|
+
|
|
308
|
+
> Portal con documentación y playground unificado de las tres librerías: **Libraries_of_Emms** (en este workspace).
|
|
309
|
+
|
|
310
|
+
---
|
|
311
|
+
|
|
312
|
+
## Migración desde v0.2.x
|
|
313
|
+
|
|
314
|
+
| Antes (v0.2.x) | Ahora (v0.3.0) |
|
|
315
|
+
|---|---|
|
|
316
|
+
| `HTML(...)` | `Dashboard(...)` (`HTML` sigue siendo alias) |
|
|
317
|
+
| `dash.generate("f.html", show=True)` | `dash.save("f.html")` / `dash.show()` |
|
|
318
|
+
| `HTML.auto_generate(df, template=...)` | `Dashboard.auto(df, theme=...).save(path)` |
|
|
319
|
+
| `pres.export("f.html")` | `pres.save("f.html")` |
|
|
320
|
+
| `Presentation.auto_generate(df, ...)` | `Presentation.auto(df).save(path)` |
|
|
321
|
+
| `report.build("nombre")` | `report.save("nombre.pdf")` |
|
|
322
|
+
| `Report(twoColumn=True)` | `Report(two_column=True)` |
|
|
323
|
+
| `report.add_plot(x, y)` | `report.add_line_plot(x, y)` |
|
|
324
|
+
| `with r.doc.create(r.add_section(...))` | `with r.section(...)` |
|
|
325
|
+
| `dm.generate_report(path, show=...)` | `dm.save(path)` / `dm.show()` |
|
|
326
|
+
| Temas de slides `dark`/`ocean`/… | Alias que resuelven a los 6 temas canónicos |
|
|
327
|
+
|
|
328
|
+
Los métodos antiguos siguen funcionando con `DeprecationWarning`.
|
|
329
|
+
|
|
330
|
+
## Contribuciones
|
|
331
|
+
|
|
332
|
+
¡Todas las ideas, mejoras y plantillas son bienvenidas!
|
|
333
|
+
ViewX está diseñado para crecer y evolucionar con la comunidad.
|
|
334
|
+
|
|
335
|
+
## Contacto
|
|
336
|
+
|
|
337
|
+
ascendraemmanuel@gmail.com
|
viewx-0.3.0/README.md
ADDED
|
@@ -0,0 +1,301 @@
|
|
|
1
|
+
# ViewX — v0.3.0
|
|
2
|
+
|
|
3
|
+
**ViewX** es una librería de visualización para Python enfocada en **analistas de datos e ingenieros**: gráficas interactivas y estáticas en una línea, dashboards HTML, reportes EDA, presentaciones y PDFs — todo con una API unificada y mínima.
|
|
4
|
+
|
|
5
|
+
**Documentación completa + playground en línea:** https://viewx.vercel.app/ (sitio Next.js en `web/` de este repo — la `Documentation_Page/` estática queda como archivo histórico).
|
|
6
|
+
|
|
7
|
+
```python
|
|
8
|
+
import viewx as vx
|
|
9
|
+
df = vx.load_dataset("iris.csv")
|
|
10
|
+
|
|
11
|
+
vx.plot(df, x="sepal_length", y="petal_length") # gráfica interactiva en 1 línea
|
|
12
|
+
vx.Dashboard.auto(df).save("dash.html") # dashboard automático
|
|
13
|
+
vx.DataMatrix(df).analyze().save("eda.html") # reporte EDA interactivo
|
|
14
|
+
vx.Presentation.auto(df).save("slides.html") # slides automáticas
|
|
15
|
+
vx.Report.auto(df).save("reporte.pdf") # PDF (requiere pdflatex)
|
|
16
|
+
```
|
|
17
|
+
|
|
18
|
+
---
|
|
19
|
+
|
|
20
|
+
## Características principales
|
|
21
|
+
|
|
22
|
+
- **`vx.plot()`**: una llamada para 14 tipos de gráfica, interactiva (Plotly) o estática (matplotlib).
|
|
23
|
+
- **API unificada**: todos los motores exportan con `.save(path)` y `.show()`.
|
|
24
|
+
- **Temas compartidos**: un mismo nombre de tema (`dark_enterprise`, `glass_ocean`, …) funciona en dashboards, slides, EDA y gráficas. `vx.set_theme()` lo fija globalmente.
|
|
25
|
+
- **Modo automático**: `Dashboard.auto()`, `Presentation.auto()`, `Report.auto()` analizan el DataFrame y eligen KPIs y gráficas por ti.
|
|
26
|
+
- **Pensado para datasets grandes**: downsampling automático (>10k puntos), WebGL para scatter grandes, muestreo estratificado en el explorador EDA.
|
|
27
|
+
- **Ligero**: núcleo con solo numpy + pandas + plotly. matplotlib y pylatex son extras opcionales.
|
|
28
|
+
|
|
29
|
+
---
|
|
30
|
+
|
|
31
|
+
## Instalación
|
|
32
|
+
|
|
33
|
+
```bash
|
|
34
|
+
pip install viewx # núcleo interactivo
|
|
35
|
+
pip install viewx[static] # + gráficas estáticas (matplotlib)
|
|
36
|
+
pip install viewx[pdf] # + reportes PDF (pylatex; requiere pdflatex)
|
|
37
|
+
pip install viewx[all] # todo
|
|
38
|
+
```
|
|
39
|
+
|
|
40
|
+
---
|
|
41
|
+
|
|
42
|
+
## Gráficas rápidas: `vx.plot()`
|
|
43
|
+
|
|
44
|
+
```python
|
|
45
|
+
import viewx as vx
|
|
46
|
+
|
|
47
|
+
# Interactiva (Plotly). En notebook se muestra sola.
|
|
48
|
+
vx.plot(df, kind="bar", x="region", y="revenue", title="Ventas por región")
|
|
49
|
+
|
|
50
|
+
# El tipo se infiere de los dtypes si no pasas `kind`
|
|
51
|
+
vx.plot(df, x="date", y="revenue") # datetime -> line
|
|
52
|
+
vx.plot(df, x="precio", y="margen") # num-num -> scatter
|
|
53
|
+
|
|
54
|
+
# Estática (matplotlib) para papers / PDFs
|
|
55
|
+
vx.plot(df, kind="histogram", x="edad", static=True).save("hist.png")
|
|
56
|
+
|
|
57
|
+
# Objeto Chart: .save(), .show(), .fig (figura Plotly/matplotlib subyacente)
|
|
58
|
+
chart = vx.plot(df, kind="donut", x="pais", y="ventas")
|
|
59
|
+
chart.save("donut.html")
|
|
60
|
+
```
|
|
61
|
+
|
|
62
|
+
Tipos disponibles: `line`, `bar`, `bar_h`, `scatter`, `area`, `pie`, `donut`, `histogram`, `box`, `violin`, `heatmap`, `funnel`, `treemap`, `bubble`.
|
|
63
|
+
|
|
64
|
+
Series con más de 10.000 puntos se reducen automáticamente (desactivable con `downsample=False`); los scatter grandes usan WebGL.
|
|
65
|
+
|
|
66
|
+
---
|
|
67
|
+
|
|
68
|
+
## Temas
|
|
69
|
+
|
|
70
|
+
Seis temas canónicos válidos en **todos** los motores:
|
|
71
|
+
`corporate_blue` · `dark_enterprise` · `modern_green` · `void_indigo` · `glass_ocean` · `cyberpunk_neon`
|
|
72
|
+
|
|
73
|
+
```python
|
|
74
|
+
vx.set_theme("dark_enterprise") # tema global por defecto
|
|
75
|
+
vx.Dashboard.auto(df).save("a.html") # usa el tema global
|
|
76
|
+
vx.Presentation.auto(df, theme="glass_ocean") # o por artefacto
|
|
77
|
+
```
|
|
78
|
+
|
|
79
|
+
---
|
|
80
|
+
|
|
81
|
+
## Dashboards HTML
|
|
82
|
+
|
|
83
|
+
```python
|
|
84
|
+
import viewx as vx
|
|
85
|
+
|
|
86
|
+
# Automático: analiza el DataFrame y arma KPIs + gráficas
|
|
87
|
+
vx.Dashboard.auto(df, theme="modern_green", title="Ventas").save("dash.html")
|
|
88
|
+
|
|
89
|
+
# Manual: grid de 12 columnas
|
|
90
|
+
dash = vx.Dashboard(
|
|
91
|
+
title="Manual Dashboard", theme="modern_green",
|
|
92
|
+
cols=12, rows=9,
|
|
93
|
+
navbar={"title": "Manual Dashboard", "items": [{"label": "Home", "link": "#"}]},
|
|
94
|
+
authors=[{"name": "Data Team", "email": "data@acme.com"}],
|
|
95
|
+
data_button=True, df=df,
|
|
96
|
+
)
|
|
97
|
+
dash.add_valuebox("Total Revenue", "$2.4M", icon_key="dollar", row=1, col=1, height=2, width=3)
|
|
98
|
+
dash.add_infobox(df=df, variable="revenue", info=["mean", "median", "std"], row=3, col=1, height=4, width=3)
|
|
99
|
+
dash.add_chart(vx.plot(df, kind="bar_h", x="region", y="revenue"), # acepta Charts de vx.plot
|
|
100
|
+
title="Revenue by Region", row=3, col=4, height=4, width=9)
|
|
101
|
+
dash.add_chart(data=df, chart_type="line", x="date", y="revenue", # o data + chart_type
|
|
102
|
+
title="Daily Trend", row=7, col=1, height=3, width=12)
|
|
103
|
+
dash.save("demo_manual.html") # dash.show() para abrir en el navegador
|
|
104
|
+
```
|
|
105
|
+
|
|
106
|
+

|
|
107
|
+
|
|
108
|
+
---
|
|
109
|
+
|
|
110
|
+
## Presentaciones
|
|
111
|
+
|
|
112
|
+
```python
|
|
113
|
+
from viewx import Presentation, Slide
|
|
114
|
+
from viewx.Slides import Title, Subtitle, BulletList, BarPlot, PlotlyChart
|
|
115
|
+
|
|
116
|
+
# Automática
|
|
117
|
+
Presentation.auto(df, title="Dataset Overview", theme="void_indigo").save("auto_slides.html")
|
|
118
|
+
|
|
119
|
+
# Manual
|
|
120
|
+
pres = Presentation("Demo ViewX Slides", theme="dark_enterprise")
|
|
121
|
+
pres.font("Inter").meta(author="ViewX", date="2026")
|
|
122
|
+
|
|
123
|
+
with Slide(title="Bienvenida", notes="Portada"):
|
|
124
|
+
Title("Slides Engine").center("x").pos(top=10).zoom_in(duration=1.2)
|
|
125
|
+
Subtitle("Presentaciones HTML desde Python").center("x").pos(top=26)
|
|
126
|
+
BulletList(["Animaciones CSS", "Gráficos Plotly", "Componentes reutilizables"]).pos(left=8, top=42)
|
|
127
|
+
|
|
128
|
+
with Slide(title="Gráficos"):
|
|
129
|
+
Title("Plotly integrado").pos(left=6, top=7)
|
|
130
|
+
BarPlot(["A", "B", "C"], [24, 38, 31], title="BarPlot").pos(left=7, top=30).size(width="40%", height="50%")
|
|
131
|
+
PlotlyChart.from_figure(vx.plot(df, kind="donut", x="region", y="revenue")) # embebe un Chart
|
|
132
|
+
|
|
133
|
+
pres.save("viewx_slides_demo.html")
|
|
134
|
+
```
|
|
135
|
+
|
|
136
|
+
---
|
|
137
|
+
|
|
138
|
+
## Reportes PDF
|
|
139
|
+
|
|
140
|
+
Requiere `pip install viewx[pdf]` y `pdflatex` en el sistema. Sin strings LaTeX: fracciones para anchos, colores CSS en cajas.
|
|
141
|
+
|
|
142
|
+
```python
|
|
143
|
+
from viewx import Report
|
|
144
|
+
|
|
145
|
+
# Automático: reporte de calidad del dataset
|
|
146
|
+
Report.auto(df, title="Quality Report").save("reporte.pdf")
|
|
147
|
+
|
|
148
|
+
# Manual
|
|
149
|
+
r = Report(title="Reporte Técnico", author="Emmanuel Ascendra")
|
|
150
|
+
r.text("Este reporte demuestra el motor ViewX.", bold=True)
|
|
151
|
+
|
|
152
|
+
with r.section("Introducción"):
|
|
153
|
+
r.text("ViewX genera documentos profesionales desde Python.")
|
|
154
|
+
with r.subsection("Características"):
|
|
155
|
+
r.bullets(["Texto estructurado", "Tablas", "Gráficos", "Cajas de información"])
|
|
156
|
+
|
|
157
|
+
with r.section("Resultados"):
|
|
158
|
+
r.add_table(
|
|
159
|
+
headers=["Modelo", "Accuracy", "F1"],
|
|
160
|
+
rows=[["Regresión", 0.82, 0.79], ["Red neuronal", 0.94, 0.92]],
|
|
161
|
+
caption="Comparación de modelos",
|
|
162
|
+
)
|
|
163
|
+
r.add_image("assets/ejemplo.png", caption="Imagen", width=0.6) # fracción del ancho
|
|
164
|
+
r.add_line_plot(x=[0, 1, 2, 3], y=[0, 1, 4, 9], caption="Crecimiento cuadrático")
|
|
165
|
+
r.add_box("Observación", "Todo se genera desde Python.", color="#DBEAFE") # color CSS
|
|
166
|
+
|
|
167
|
+
r.save("reporte_demo.pdf")
|
|
168
|
+
```
|
|
169
|
+
|
|
170
|
+

|
|
171
|
+
|
|
172
|
+
---
|
|
173
|
+
|
|
174
|
+
## Análisis EDA con DataMatrix
|
|
175
|
+
|
|
176
|
+
```python
|
|
177
|
+
from viewx import DataMatrix
|
|
178
|
+
|
|
179
|
+
dm = DataMatrix(df)
|
|
180
|
+
dm.clean_data(drop_duplicates=True, fill_na=True)
|
|
181
|
+
dm.analyze()
|
|
182
|
+
|
|
183
|
+
print(dm.summary()) # métricas clave
|
|
184
|
+
print(dm.alerts()) # advertencias de calidad
|
|
185
|
+
print(dm.highlights()) # fortalezas del dataset
|
|
186
|
+
|
|
187
|
+
dm.save("eda.html", theme="dark_enterprise") # reporte completo con explorador interactivo
|
|
188
|
+
# En una línea: DataMatrix(df).analyze().save("eda.html")
|
|
189
|
+
```
|
|
190
|
+
|
|
191
|
+
El reporte incluye Overview, perfil por variable, correlaciones, explorador interactivo con filtros (muestreo estratificado para datasets grandes) y muestra paginada.
|
|
192
|
+
|
|
193
|
+
---
|
|
194
|
+
|
|
195
|
+
## Integración StatsLibX y SynaptIX
|
|
196
|
+
|
|
197
|
+
ViewX es el **motor de visualización y reportes** del ecosistema GhostAnalyst, junto con [StatsLibX](https://github.com/GhostAnalyst30/StatsLibX) (estadística) y [SynaptIX](https://github.com/GhostAnalyst30/SynaptIX) (machine learning). Las tres comparten el mismo contrato de payload y cargadores de datasets, y **cada una funciona por separado**:
|
|
198
|
+
|
|
199
|
+
```mermaid
|
|
200
|
+
flowchart TD
|
|
201
|
+
U["Datos crudos<br/>(CSV, DataFrame, arrays)"]
|
|
202
|
+
SLX["StatsLibX<br/>estadistica + manejo de datos + simulacion"]
|
|
203
|
+
SYN["SynaptIX<br/>modelos + evaluacion y mejora"]
|
|
204
|
+
VX["ViewX<br/>dashboards, EDA, PDF, slides"]
|
|
205
|
+
U --> SLX
|
|
206
|
+
U --> SYN
|
|
207
|
+
U --> VX
|
|
208
|
+
SLX -->|"DataFrame / polars"| SYN
|
|
209
|
+
SLX -->|"to_report_data() payload"| VX
|
|
210
|
+
SYN -->|"to_report_data() payload"| VX
|
|
211
|
+
SYN -->|"diagnostics() usa InferentialStats"| SLX
|
|
212
|
+
VX -->|"HTML / PDF / slides"| U
|
|
213
|
+
```
|
|
214
|
+
|
|
215
|
+
ViewX recibe payloads de StatsLibX **y de SynaptIX** vía `from_report_payload()`. El contrato es el mismo: un dict con `title`, `sections`, `tables` y opcionales `valueboxes`/`figures`.
|
|
216
|
+
|
|
217
|
+
```python
|
|
218
|
+
from statslibx import DescriptiveStats, to_report_data, load_iris
|
|
219
|
+
from viewx import from_report_payload
|
|
220
|
+
|
|
221
|
+
df = load_iris()
|
|
222
|
+
summary = DescriptiveStats(df).summary()
|
|
223
|
+
|
|
224
|
+
# Opción 1 — método directo en el resultado
|
|
225
|
+
summary.to_html("iris.html", theme="dark_enterprise", data=df)
|
|
226
|
+
|
|
227
|
+
# Opción 2 — pipeline manual
|
|
228
|
+
payload = to_report_data(summary, include_figures=True, data=df)
|
|
229
|
+
from_report_payload(payload, target="html", filename="iris.html")
|
|
230
|
+
```
|
|
231
|
+
|
|
232
|
+
Con SynaptIX (machine learning) funciona igual:
|
|
233
|
+
|
|
234
|
+
```python
|
|
235
|
+
import synaptix as sx
|
|
236
|
+
|
|
237
|
+
df = sx.load_dataset("iris")
|
|
238
|
+
X, y = df.drop(columns="species"), df["species"]
|
|
239
|
+
model = sx.supervised.RandomForestClassifier().fit(X, y)
|
|
240
|
+
|
|
241
|
+
# Método directo en el resultado (requiere pip install synaptix[viewx])
|
|
242
|
+
model.evaluate(X, y).to_html("evaluacion.html", theme="dark_enterprise")
|
|
243
|
+
|
|
244
|
+
# O pipeline manual con el mismo contrato
|
|
245
|
+
payload = model.evaluate(X, y).to_report_data(include_figures=True)
|
|
246
|
+
from_report_payload(payload, target="presentation", filename="evaluacion.html")
|
|
247
|
+
```
|
|
248
|
+
|
|
249
|
+
### Flujo completo del ecosistema (StatsLibX → SynaptIX → ViewX)
|
|
250
|
+
|
|
251
|
+
```python
|
|
252
|
+
# pip install statslibx[viewx] synaptix[viewx,stats] viewx
|
|
253
|
+
from statslibx import DescriptiveStats, load_iris
|
|
254
|
+
import synaptix as sx
|
|
255
|
+
from viewx import from_report_payload
|
|
256
|
+
|
|
257
|
+
df = load_iris()
|
|
258
|
+
|
|
259
|
+
# 1. Estadística y calidad de datos (StatsLibX)
|
|
260
|
+
DescriptiveStats(df).summary()
|
|
261
|
+
|
|
262
|
+
# 2. Modelo y evaluación (SynaptIX)
|
|
263
|
+
X, y = df.drop(columns="species"), df["species"]
|
|
264
|
+
modelo = sx.supervised.RandomForestClassifier().fit(X, y)
|
|
265
|
+
evaluacion = modelo.evaluate(X, y)
|
|
266
|
+
|
|
267
|
+
# 3. Todo en un dashboard (ViewX)
|
|
268
|
+
payload = evaluacion.to_report_data(include_figures=True)
|
|
269
|
+
from_report_payload(payload, target="html", filename="analisis.html")
|
|
270
|
+
```
|
|
271
|
+
|
|
272
|
+
> Portal con documentación y playground unificado de las tres librerías: **Libraries_of_Emms** (en este workspace).
|
|
273
|
+
|
|
274
|
+
---
|
|
275
|
+
|
|
276
|
+
## Migración desde v0.2.x
|
|
277
|
+
|
|
278
|
+
| Antes (v0.2.x) | Ahora (v0.3.0) |
|
|
279
|
+
|---|---|
|
|
280
|
+
| `HTML(...)` | `Dashboard(...)` (`HTML` sigue siendo alias) |
|
|
281
|
+
| `dash.generate("f.html", show=True)` | `dash.save("f.html")` / `dash.show()` |
|
|
282
|
+
| `HTML.auto_generate(df, template=...)` | `Dashboard.auto(df, theme=...).save(path)` |
|
|
283
|
+
| `pres.export("f.html")` | `pres.save("f.html")` |
|
|
284
|
+
| `Presentation.auto_generate(df, ...)` | `Presentation.auto(df).save(path)` |
|
|
285
|
+
| `report.build("nombre")` | `report.save("nombre.pdf")` |
|
|
286
|
+
| `Report(twoColumn=True)` | `Report(two_column=True)` |
|
|
287
|
+
| `report.add_plot(x, y)` | `report.add_line_plot(x, y)` |
|
|
288
|
+
| `with r.doc.create(r.add_section(...))` | `with r.section(...)` |
|
|
289
|
+
| `dm.generate_report(path, show=...)` | `dm.save(path)` / `dm.show()` |
|
|
290
|
+
| Temas de slides `dark`/`ocean`/… | Alias que resuelven a los 6 temas canónicos |
|
|
291
|
+
|
|
292
|
+
Los métodos antiguos siguen funcionando con `DeprecationWarning`.
|
|
293
|
+
|
|
294
|
+
## Contribuciones
|
|
295
|
+
|
|
296
|
+
¡Todas las ideas, mejoras y plantillas son bienvenidas!
|
|
297
|
+
ViewX está diseñado para crecer y evolucionar con la comunidad.
|
|
298
|
+
|
|
299
|
+
## Contacto
|
|
300
|
+
|
|
301
|
+
ascendraemmanuel@gmail.com
|