viewx 0.2.1__tar.gz → 0.2.2__tar.gz
This diff represents the content of publicly available package versions that have been released to one of the supported registries. The information contained in this diff is provided for informational purposes only and reflects changes between package versions as they appear in their respective public registries.
- {viewx-0.2.1 → viewx-0.2.2}/PKG-INFO +13 -59
- {viewx-0.2.1 → viewx-0.2.2}/README.md +12 -58
- {viewx-0.2.1 → viewx-0.2.2}/setup.py +1 -1
- viewx-0.2.2/tests/test1.py +150 -0
- {viewx-0.2.1 → viewx-0.2.2}/tests/test4.py +3 -1
- viewx-0.2.2/tests/test7.py +1514 -0
- {viewx-0.2.1 → viewx-0.2.2}/viewx/DataMatrix/datamatrix_engine.py +3 -0
- viewx-0.2.2/viewx/HTML/html_engine.py +1355 -0
- {viewx-0.2.1 → viewx-0.2.2}/viewx/__init__.py +0 -2
- {viewx-0.2.1 → viewx-0.2.2}/viewx.egg-info/PKG-INFO +13 -59
- {viewx-0.2.1 → viewx-0.2.2}/viewx.egg-info/SOURCES.txt +1 -2
- viewx-0.2.1/tests/test1.py +0 -65
- viewx-0.2.1/viewx/DashBoard/__init__.py +0 -5
- viewx-0.2.1/viewx/DashBoard/dashboard_engine.py +0 -409
- viewx-0.2.1/viewx/HTML/html_engine.py +0 -633
- {viewx-0.2.1 → viewx-0.2.2}/setup.cfg +0 -0
- {viewx-0.2.1 → viewx-0.2.2}/tests/test2.py +0 -0
- {viewx-0.2.1 → viewx-0.2.2}/tests/test3.py +0 -0
- {viewx-0.2.1 → viewx-0.2.2}/tests/test5.py +0 -0
- {viewx-0.2.1 → viewx-0.2.2}/tests/test6.py +0 -0
- {viewx-0.2.1 → viewx-0.2.2}/viewx/DataMatrix/__init__.py +0 -0
- {viewx-0.2.1 → viewx-0.2.2}/viewx/DataMatrix/bibliometrics.py +0 -0
- {viewx-0.2.1 → viewx-0.2.2}/viewx/DataMatrix/visualizer.py +0 -0
- {viewx-0.2.1 → viewx-0.2.2}/viewx/HTML/__init__.py +0 -0
- {viewx-0.2.1 → viewx-0.2.2}/viewx/Report/__init__.py +0 -0
- {viewx-0.2.1 → viewx-0.2.2}/viewx/Report/report_engine.py +0 -0
- {viewx-0.2.1 → viewx-0.2.2}/viewx/Slides/__init__.py +0 -0
- {viewx-0.2.1 → viewx-0.2.2}/viewx/Slides/charts.py +0 -0
- {viewx-0.2.1 → viewx-0.2.2}/viewx/Slides/components.py +0 -0
- {viewx-0.2.1 → viewx-0.2.2}/viewx/Slides/slides_engine.py +0 -0
- {viewx-0.2.1 → viewx-0.2.2}/viewx/datasets/__init__.py +0 -0
- {viewx-0.2.1 → viewx-0.2.2}/viewx/datasets/course_completion.csv +0 -0
- {viewx-0.2.1 → viewx-0.2.2}/viewx/datasets/iris.csv +0 -0
- {viewx-0.2.1 → viewx-0.2.2}/viewx/datasets/penguins.csv +0 -0
- {viewx-0.2.1 → viewx-0.2.2}/viewx/datasets/sp500_companies.csv +0 -0
- {viewx-0.2.1 → viewx-0.2.2}/viewx/datasets/titanic.csv +0 -0
- {viewx-0.2.1 → viewx-0.2.2}/viewx.egg-info/dependency_links.txt +0 -0
- {viewx-0.2.1 → viewx-0.2.2}/viewx.egg-info/requires.txt +0 -0
- {viewx-0.2.1 → viewx-0.2.2}/viewx.egg-info/top_level.txt +0 -0
|
@@ -1,6 +1,6 @@
|
|
|
1
1
|
Metadata-Version: 2.4
|
|
2
2
|
Name: viewx
|
|
3
|
-
Version: 0.2.
|
|
3
|
+
Version: 0.2.2
|
|
4
4
|
Summary: Librería de visualización adaptable para HTML, Dashboards y PDFs en Python
|
|
5
5
|
Home-page: https://github.com/GhostAnalyst30/ViewX
|
|
6
6
|
Author: Emmanuel Ascendra Perez
|
|
@@ -52,7 +52,7 @@ Dynamic: requires-dist
|
|
|
52
52
|
Dynamic: requires-python
|
|
53
53
|
Dynamic: summary
|
|
54
54
|
|
|
55
|
-
#
|
|
55
|
+
# ViewX — v2.2
|
|
56
56
|
|
|
57
57
|
**ViewX** es un paquete moderno de Python diseñado para generar **páginas HTML interactivas**, **dashboards dinámicos** y **visualizaciones inteligentes** que se adaptan automáticamente a los objetos agregados por el usuario.
|
|
58
58
|
|
|
@@ -60,15 +60,14 @@ Este proyecto ofrece una solución **ligera, intuitiva y escalable**, ideal para
|
|
|
60
60
|
|
|
61
61
|
---
|
|
62
62
|
|
|
63
|
-
##
|
|
63
|
+
## Características principales
|
|
64
64
|
|
|
65
|
-
-
|
|
66
|
-
-
|
|
67
|
-
-
|
|
68
|
-
-
|
|
69
|
-
-
|
|
70
|
-
-
|
|
71
|
-
- 🔮 **Visión a futuro**: pensado para expandirse a interfaces inteligentes.
|
|
65
|
+
- **Rápido y minimalista**: cero dependencias pesadas por defecto.
|
|
66
|
+
- **API intuitiva**: crea páginas y dashboards en segundos.
|
|
67
|
+
- **Diseño adaptativo**: cada componente se acomoda automáticamente.
|
|
68
|
+
- **Modo HTML**: genera páginas `.html` totalmente autónomas.
|
|
69
|
+
- **Extensible**: añade tus propias plantillas y módulos personalizados.
|
|
70
|
+
- **Visión a futuro**: pensado para expandirse a interfaces inteligentes.
|
|
72
71
|
|
|
73
72
|
---
|
|
74
73
|
|
|
@@ -77,7 +76,7 @@ Este proyecto ofrece una solución **ligera, intuitiva y escalable**, ideal para
|
|
|
77
76
|
pip install viewx
|
|
78
77
|
```
|
|
79
78
|
|
|
80
|
-
##
|
|
79
|
+
## Ejemplo rápido
|
|
81
80
|
|
|
82
81
|
### Crear una página HTML
|
|
83
82
|
```python
|
|
@@ -156,54 +155,9 @@ dashboard.generate("mi_dashboard.html")
|
|
|
156
155
|
|
|
157
156
|
```
|
|
158
157
|
|
|
159
|
-

|
|
161
160
|
|
|
162
|
-
### Crear un DashBoard
|
|
163
|
-
```python
|
|
164
|
-
from viewx.DashBoard import DashBoard
|
|
165
|
-
from viewx.datasets import load_dataset
|
|
166
|
-
|
|
167
|
-
df = load_dataset("iris.csv")
|
|
168
|
-
|
|
169
|
-
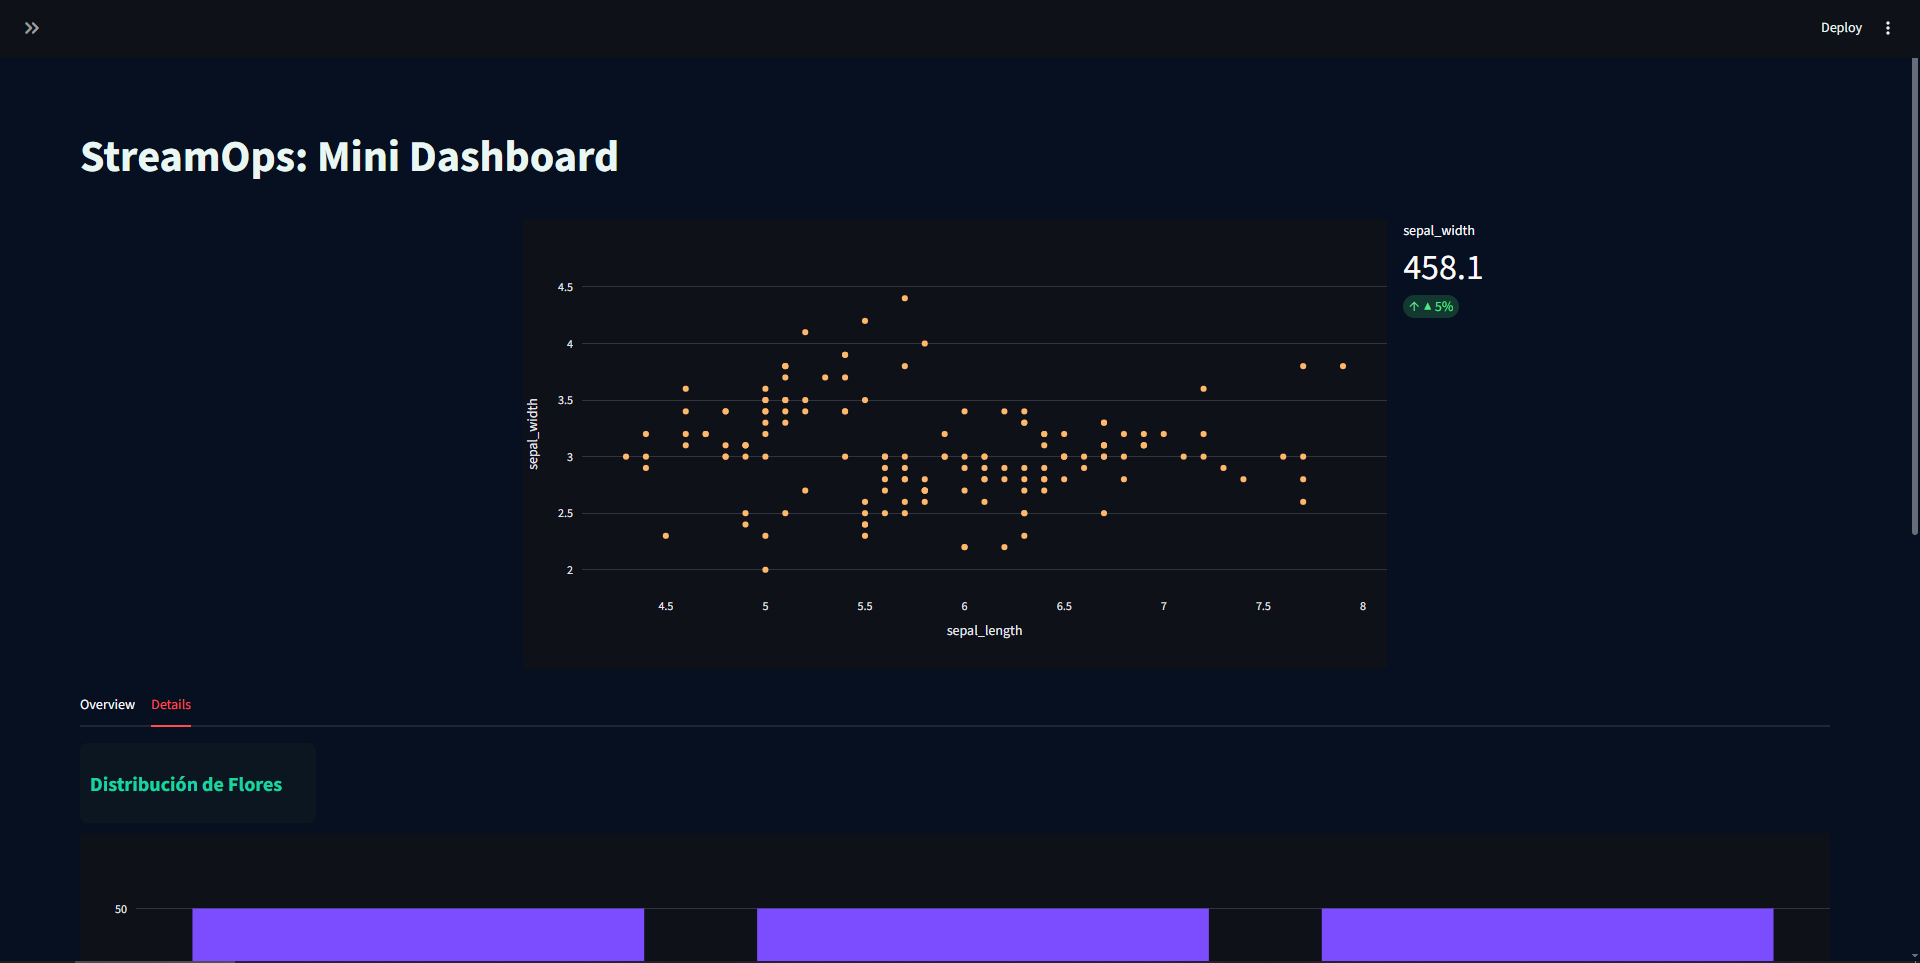
db = DashBoard(df, title="StreamOps: Mini Dashboard", title_align="center")
|
|
170
|
-
db.set_theme(background="#071021", text="#E9F6F2", primary="#19D3A3", card="#0b1620")
|
|
171
|
-
# Sidebar
|
|
172
|
-
db.add_sidebar(db.comp_text("Parámetros del reporte"))
|
|
173
|
-
db.add_sidebar(db.comp_metric("Longitud del dataset", df.shape[0]))
|
|
174
|
-
db.add_sidebar(db.comp_metric("Cantidad de Flores", df["species"].unique().shape[0]))
|
|
175
|
-
# Main layout
|
|
176
|
-
db.add_blank()
|
|
177
|
-
db.add_row(
|
|
178
|
-
col_widths=[1, 2, 1],
|
|
179
|
-
components=[
|
|
180
|
-
db.comp_blank(),
|
|
181
|
-
db.comp_plot(x="sepal_length", y="sepal_width", kind="scatter", color="#FFB86B"),
|
|
182
|
-
db.comp_metric("sepal_width", df["sepal_width"].sum(), delta="▲ 5%")
|
|
183
|
-
]
|
|
184
|
-
)
|
|
185
|
-
|
|
186
|
-
db.add_tabs({
|
|
187
|
-
"Overview": [
|
|
188
|
-
db.comp_title("Resumen por Región"),
|
|
189
|
-
db.comp_table()
|
|
190
|
-
],
|
|
191
|
-
"Details": [
|
|
192
|
-
db.comp_title("Distribución de Flores"),
|
|
193
|
-
db.comp_plot(x="species", y=None, kind="hist", color="#7C4DFF")
|
|
194
|
-
]
|
|
195
|
-
})
|
|
196
|
-
|
|
197
|
-
db.add_expander("Detalles técnicos", [
|
|
198
|
-
db.comp_text("Este panel fue generado automáticamente."),
|
|
199
|
-
db.comp_text("Metadata: filas=" + str(len(df)), size="12px")
|
|
200
|
-
], expanded=True)
|
|
201
|
-
|
|
202
|
-
db.run(open_browser=True)
|
|
203
|
-
```
|
|
204
|
-
|
|
205
|
-
|
|
206
|
-
|
|
207
161
|
### Crear una Presentacion
|
|
208
162
|
|
|
209
163
|
```python
|
|
@@ -447,10 +401,10 @@ report_path = dm.generate_report("demo_datamatrix_report.html", title="Análisis
|
|
|
447
401
|
print(f"Reporte generado exitosamente en: {report_path}")
|
|
448
402
|
```
|
|
449
403
|
|
|
450
|
-
##
|
|
404
|
+
## Contribuciones
|
|
451
405
|
|
|
452
406
|
¡Todas las ideas, mejoras y plantillas son bienvenidas!
|
|
453
407
|
ViewX está diseñado para crecer y evolucionar con la comunidad.
|
|
454
408
|
|
|
455
|
-
##
|
|
409
|
+
## Contacto:
|
|
456
410
|
ascendraemmanuel@gmail.com
|
|
@@ -1,4 +1,4 @@
|
|
|
1
|
-
#
|
|
1
|
+
# ViewX — v2.2
|
|
2
2
|
|
|
3
3
|
**ViewX** es un paquete moderno de Python diseñado para generar **páginas HTML interactivas**, **dashboards dinámicos** y **visualizaciones inteligentes** que se adaptan automáticamente a los objetos agregados por el usuario.
|
|
4
4
|
|
|
@@ -6,15 +6,14 @@ Este proyecto ofrece una solución **ligera, intuitiva y escalable**, ideal para
|
|
|
6
6
|
|
|
7
7
|
---
|
|
8
8
|
|
|
9
|
-
##
|
|
9
|
+
## Características principales
|
|
10
10
|
|
|
11
|
-
-
|
|
12
|
-
-
|
|
13
|
-
-
|
|
14
|
-
-
|
|
15
|
-
-
|
|
16
|
-
-
|
|
17
|
-
- 🔮 **Visión a futuro**: pensado para expandirse a interfaces inteligentes.
|
|
11
|
+
- **Rápido y minimalista**: cero dependencias pesadas por defecto.
|
|
12
|
+
- **API intuitiva**: crea páginas y dashboards en segundos.
|
|
13
|
+
- **Diseño adaptativo**: cada componente se acomoda automáticamente.
|
|
14
|
+
- **Modo HTML**: genera páginas `.html` totalmente autónomas.
|
|
15
|
+
- **Extensible**: añade tus propias plantillas y módulos personalizados.
|
|
16
|
+
- **Visión a futuro**: pensado para expandirse a interfaces inteligentes.
|
|
18
17
|
|
|
19
18
|
---
|
|
20
19
|
|
|
@@ -23,7 +22,7 @@ Este proyecto ofrece una solución **ligera, intuitiva y escalable**, ideal para
|
|
|
23
22
|
pip install viewx
|
|
24
23
|
```
|
|
25
24
|
|
|
26
|
-
##
|
|
25
|
+
## Ejemplo rápido
|
|
27
26
|
|
|
28
27
|
### Crear una página HTML
|
|
29
28
|
```python
|
|
@@ -102,54 +101,9 @@ dashboard.generate("mi_dashboard.html")
|
|
|
102
101
|
|
|
103
102
|
```
|
|
104
103
|
|
|
105
|
-

|
|
107
106
|
|
|
108
|
-
### Crear un DashBoard
|
|
109
|
-
```python
|
|
110
|
-
from viewx.DashBoard import DashBoard
|
|
111
|
-
from viewx.datasets import load_dataset
|
|
112
|
-
|
|
113
|
-
df = load_dataset("iris.csv")
|
|
114
|
-
|
|
115
|
-
db = DashBoard(df, title="StreamOps: Mini Dashboard", title_align="center")
|
|
116
|
-
db.set_theme(background="#071021", text="#E9F6F2", primary="#19D3A3", card="#0b1620")
|
|
117
|
-
# Sidebar
|
|
118
|
-
db.add_sidebar(db.comp_text("Parámetros del reporte"))
|
|
119
|
-
db.add_sidebar(db.comp_metric("Longitud del dataset", df.shape[0]))
|
|
120
|
-
db.add_sidebar(db.comp_metric("Cantidad de Flores", df["species"].unique().shape[0]))
|
|
121
|
-
# Main layout
|
|
122
|
-
db.add_blank()
|
|
123
|
-
db.add_row(
|
|
124
|
-
col_widths=[1, 2, 1],
|
|
125
|
-
components=[
|
|
126
|
-
db.comp_blank(),
|
|
127
|
-
db.comp_plot(x="sepal_length", y="sepal_width", kind="scatter", color="#FFB86B"),
|
|
128
|
-
db.comp_metric("sepal_width", df["sepal_width"].sum(), delta="▲ 5%")
|
|
129
|
-
]
|
|
130
|
-
)
|
|
131
|
-
|
|
132
|
-
db.add_tabs({
|
|
133
|
-
"Overview": [
|
|
134
|
-
db.comp_title("Resumen por Región"),
|
|
135
|
-
db.comp_table()
|
|
136
|
-
],
|
|
137
|
-
"Details": [
|
|
138
|
-
db.comp_title("Distribución de Flores"),
|
|
139
|
-
db.comp_plot(x="species", y=None, kind="hist", color="#7C4DFF")
|
|
140
|
-
]
|
|
141
|
-
})
|
|
142
|
-
|
|
143
|
-
db.add_expander("Detalles técnicos", [
|
|
144
|
-
db.comp_text("Este panel fue generado automáticamente."),
|
|
145
|
-
db.comp_text("Metadata: filas=" + str(len(df)), size="12px")
|
|
146
|
-
], expanded=True)
|
|
147
|
-
|
|
148
|
-
db.run(open_browser=True)
|
|
149
|
-
```
|
|
150
|
-
|
|
151
|
-

|
|
152
|
-
|
|
153
107
|
### Crear una Presentacion
|
|
154
108
|
|
|
155
109
|
```python
|
|
@@ -393,10 +347,10 @@ report_path = dm.generate_report("demo_datamatrix_report.html", title="Análisis
|
|
|
393
347
|
print(f"Reporte generado exitosamente en: {report_path}")
|
|
394
348
|
```
|
|
395
349
|
|
|
396
|
-
##
|
|
350
|
+
## Contribuciones
|
|
397
351
|
|
|
398
352
|
¡Todas las ideas, mejoras y plantillas son bienvenidas!
|
|
399
353
|
ViewX está diseñado para crecer y evolucionar con la comunidad.
|
|
400
354
|
|
|
401
|
-
##
|
|
355
|
+
## Contacto:
|
|
402
356
|
ascendraemmanuel@gmail.com
|
|
@@ -9,7 +9,7 @@ except FileNotFoundError:
|
|
|
9
9
|
|
|
10
10
|
setup(
|
|
11
11
|
name="viewx",
|
|
12
|
-
version="0.2.
|
|
12
|
+
version="0.2.2",
|
|
13
13
|
author="Emmanuel Ascendra Perez",
|
|
14
14
|
author_email="ascendraemmanuel@gmail.com",
|
|
15
15
|
description="Librería de visualización adaptable para HTML, Dashboards y PDFs en Python",
|
|
@@ -0,0 +1,150 @@
|
|
|
1
|
+
import pandas as pd
|
|
2
|
+
import numpy as np
|
|
3
|
+
from datetime import datetime, timedelta
|
|
4
|
+
from viewx.HTML.html_engine import HTML
|
|
5
|
+
|
|
6
|
+
# ── Generar datos de demo ────────────────────────────────────────────────────
|
|
7
|
+
np.random.seed(42)
|
|
8
|
+
n = 200
|
|
9
|
+
|
|
10
|
+
fechas = [datetime(2024, 1, 1) + timedelta(days=i) for i in range(n)]
|
|
11
|
+
regiones = np.random.choice(["Norte", "Sur", "Este", "Oeste", "Centro"], n)
|
|
12
|
+
productos = np.random.choice(["Laptop", "Tablet", "Phone", "Monitor", "Teclado"], n)
|
|
13
|
+
ventas = np.random.randint(500, 10000, n)
|
|
14
|
+
utilidad = ventas * np.random.uniform(0.1, 0.4, n)
|
|
15
|
+
unidades = np.random.randint(1, 50, n)
|
|
16
|
+
activo = np.random.choice([True, False], n)
|
|
17
|
+
|
|
18
|
+
df = pd.DataFrame({
|
|
19
|
+
"fecha" : fechas,
|
|
20
|
+
"region" : regiones,
|
|
21
|
+
"producto" : productos,
|
|
22
|
+
"ventas" : ventas,
|
|
23
|
+
"utilidad" : utilidad.astype(int),
|
|
24
|
+
"unidades" : unidades,
|
|
25
|
+
"activo" : activo,
|
|
26
|
+
})
|
|
27
|
+
|
|
28
|
+
print("Columnas disponibles:", df.columns.tolist())
|
|
29
|
+
print(df.head(3))
|
|
30
|
+
|
|
31
|
+
# ════════════════════════════════════════════════════════════════════════════
|
|
32
|
+
# DEMO 1 — Layout automático, tema por defecto
|
|
33
|
+
# ════════════════════════════════════════════════════════════════════════════
|
|
34
|
+
HTML.auto_generate(
|
|
35
|
+
df,
|
|
36
|
+
title = "Demo 1 · Auto Layout",
|
|
37
|
+
filename = "demo1_auto.html",
|
|
38
|
+
)
|
|
39
|
+
|
|
40
|
+
# ════════════════════════════════════════════════════════════════════════════
|
|
41
|
+
# DEMO 2 — Solo algunas columnas + tema oscuro
|
|
42
|
+
# ════════════════════════════════════════════════════════════════════════════
|
|
43
|
+
HTML.auto_generate(
|
|
44
|
+
df,
|
|
45
|
+
columns = ["fecha", "ventas", "utilidad", "region"],
|
|
46
|
+
template = "dark_enterprise",
|
|
47
|
+
title = "Demo 2 · Columnas seleccionadas",
|
|
48
|
+
filename = "demo2_cols.html",
|
|
49
|
+
authors = [
|
|
50
|
+
{"name": "Ana García", "email": "ana@empresa.com"},
|
|
51
|
+
{"name": "Luis Torres", "email": "luis@empresa.com"},
|
|
52
|
+
]
|
|
53
|
+
)
|
|
54
|
+
|
|
55
|
+
# ════════════════════════════════════════════════════════════════════════════
|
|
56
|
+
# DEMO 3 — Preset kpi_focus + tema void_indigo
|
|
57
|
+
# ════════════════════════════════════════════════════════════════════════════
|
|
58
|
+
HTML.auto_generate(
|
|
59
|
+
df,
|
|
60
|
+
columns = ["ventas", "utilidad", "unidades", "region", "producto"],
|
|
61
|
+
template = "void_indigo",
|
|
62
|
+
title = "Demo 3 · KPI Focus",
|
|
63
|
+
filename = "demo3_kpi_focus.html",
|
|
64
|
+
layout = "kpi_focus",
|
|
65
|
+
authors = "Carlos Méndez",
|
|
66
|
+
)
|
|
67
|
+
|
|
68
|
+
# ════════════════════════════════════════════════════════════════════════════
|
|
69
|
+
# DEMO 4 — Preset chart_focus + tema glass_ocean
|
|
70
|
+
# ════════════════════════════════════════════════════════════════════════════
|
|
71
|
+
HTML.auto_generate(
|
|
72
|
+
df,
|
|
73
|
+
columns = ["fecha", "ventas", "utilidad", "region"],
|
|
74
|
+
template = "glass_ocean",
|
|
75
|
+
title = "Demo 4 · Chart Focus",
|
|
76
|
+
filename = "demo4_chart_focus.html",
|
|
77
|
+
layout = "chart_focus",
|
|
78
|
+
)
|
|
79
|
+
|
|
80
|
+
# ════════════════════════════════════════════════════════════════════════════
|
|
81
|
+
# DEMO 5 — Preset table_first + tema cyberpunk_neon
|
|
82
|
+
# ════════════════════════════════════════════════════════════════════════════
|
|
83
|
+
HTML.auto_generate(
|
|
84
|
+
df,
|
|
85
|
+
columns = ["fecha", "region", "producto", "ventas", "unidades"],
|
|
86
|
+
template = "cyberpunk_neon",
|
|
87
|
+
title = "Demo 5 · Table First",
|
|
88
|
+
filename = "demo5_table_first.html",
|
|
89
|
+
layout = "table_first",
|
|
90
|
+
)
|
|
91
|
+
|
|
92
|
+
# ════════════════════════════════════════════════════════════════════════════
|
|
93
|
+
# DEMO 6 — Layout 100% personalizado
|
|
94
|
+
# Diseño:
|
|
95
|
+
# [KPI ventas] [KPI utilidad] [KPI unidades] | [Chart barras región]
|
|
96
|
+
# [Chart línea temporal (ventas) ] | [Chart scatter ]
|
|
97
|
+
# [Tabla completa ]
|
|
98
|
+
# ════════════════════════════════════════════════════════════════════════════
|
|
99
|
+
HTML.auto_generate(
|
|
100
|
+
df,
|
|
101
|
+
columns = ["fecha", "region", "ventas", "utilidad", "unidades"],
|
|
102
|
+
template = "modern_green",
|
|
103
|
+
title = "Demo 6 · Layout Personalizado",
|
|
104
|
+
filename = "demo6_custom.html",
|
|
105
|
+
authors = [{"name": "Equipo BI", "email": "bi@empresa.com"}],
|
|
106
|
+
layout = [
|
|
107
|
+
# Fila 1: 3 KPIs a la izquierda + 1 chart a la derecha
|
|
108
|
+
{"type": "kpi", "index": 0, "row": 1, "col": 1, "height": 2, "width": 3},
|
|
109
|
+
{"type": "kpi", "index": 1, "row": 1, "col": 4, "height": 2, "width": 3},
|
|
110
|
+
{"type": "kpi", "index": 2, "row": 1, "col": 7, "height": 2, "width": 3},
|
|
111
|
+
{"type": "chart", "index": 1, "row": 1, "col": 10, "height": 7, "width": 3}, # barras región
|
|
112
|
+
|
|
113
|
+
# Fila 2: línea temporal grande + scatter
|
|
114
|
+
{"type": "chart", "index": 0, "row": 3, "col": 1, "height": 5, "width": 6}, # línea tiempo
|
|
115
|
+
{"type": "chart", "index": 2, "row": 3, "col": 7, "height": 5, "width": 3}, # scatter
|
|
116
|
+
|
|
117
|
+
# Fila 3: tabla completa
|
|
118
|
+
{"type": "table", "row": 8, "col": 1, "height": 4, "width": 12},
|
|
119
|
+
]
|
|
120
|
+
)
|
|
121
|
+
|
|
122
|
+
# ════════════════════════════════════════════════════════════════════════════
|
|
123
|
+
# DEMO 7 — DataFrame con strings numéricos (prueba parseo automático)
|
|
124
|
+
# ════════════════════════════════════════════════════════════════════════════
|
|
125
|
+
df_strings = pd.DataFrame({
|
|
126
|
+
"mes" : ["Ene", "Feb", "Mar", "Abr", "May", "Jun"],
|
|
127
|
+
"ingresos" : ["$12,500", "$9,800", "$15,200", "$11,000", "$18,400", "$14,700"],
|
|
128
|
+
"costos" : ["8500", "7200", "9800", "8100", "12000", "10500"],
|
|
129
|
+
"margen%" : ["32%", "27%", "36%", "26%", "35%", "29%"],
|
|
130
|
+
"ciudad" : ["Bogotá", "Medellín","Cali", "Bogotá", "Cali", "Medellín"],
|
|
131
|
+
})
|
|
132
|
+
|
|
133
|
+
HTML.auto_generate(
|
|
134
|
+
df_strings,
|
|
135
|
+
template = "corporate_blue",
|
|
136
|
+
title = "Demo 7 · Parseo Automático de Strings",
|
|
137
|
+
filename = "demo7_parseo.html",
|
|
138
|
+
)
|
|
139
|
+
|
|
140
|
+
print("\n✅ Todos los dashboards generados:")
|
|
141
|
+
for i, name in enumerate([
|
|
142
|
+
"demo1_auto.html",
|
|
143
|
+
"demo2_cols.html",
|
|
144
|
+
"demo3_kpi_focus.html",
|
|
145
|
+
"demo4_chart_focus.html",
|
|
146
|
+
"demo5_table_first.html",
|
|
147
|
+
"demo6_custom.html",
|
|
148
|
+
"demo7_parseo.html",
|
|
149
|
+
], 1):
|
|
150
|
+
print(f" {i}. {name}")
|
|
@@ -38,7 +38,9 @@ dashboard = HTML(
|
|
|
38
38
|
{"label": "Clientes", "link": "#"},
|
|
39
39
|
{"label": "Reportes", "link": "#"}
|
|
40
40
|
]
|
|
41
|
-
}
|
|
41
|
+
},
|
|
42
|
+
authors=[{"name": "Emmanuel Ascendra", "email": "ascendraemmanuel@gmail.com"},
|
|
43
|
+
{"name": "Juan Perez", "email": "juanperez@gmail.com"}]
|
|
42
44
|
)
|
|
43
45
|
|
|
44
46
|
# 3. Añadir componentes (row, col, height, width)
|