traceburn 0.1.0__tar.gz
This diff represents the content of publicly available package versions that have been released to one of the supported registries. The information contained in this diff is provided for informational purposes only and reflects changes between package versions as they appear in their respective public registries.
- traceburn-0.1.0/.gitignore +17 -0
- traceburn-0.1.0/CITATION.cff +18 -0
- traceburn-0.1.0/CONTRIBUTING.md +54 -0
- traceburn-0.1.0/LICENSE +21 -0
- traceburn-0.1.0/PKG-INFO +259 -0
- traceburn-0.1.0/README.md +233 -0
- traceburn-0.1.0/assets/flamegraph.png +0 -0
- traceburn-0.1.0/assets/trace-tree.png +0 -0
- traceburn-0.1.0/assets/waste-report.png +0 -0
- traceburn-0.1.0/assets/waterfall.png +0 -0
- traceburn-0.1.0/docs/concepts.md +57 -0
- traceburn-0.1.0/docs/instrumentation.md +65 -0
- traceburn-0.1.0/docs/quickstart.md +82 -0
- traceburn-0.1.0/docs/replay.md +49 -0
- traceburn-0.1.0/docs/waste-rules.md +123 -0
- traceburn-0.1.0/examples/cache_before_after.py +161 -0
- traceburn-0.1.0/examples/offline_demo.py +64 -0
- traceburn-0.1.0/examples/raw_anthropic.py +41 -0
- traceburn-0.1.0/examples/raw_openai.py +64 -0
- traceburn-0.1.0/hooks/traceburn_autoinstall.pth +1 -0
- traceburn-0.1.0/hooks/traceburn_autoinstall.py +22 -0
- traceburn-0.1.0/pyproject.toml +45 -0
- traceburn-0.1.0/src/traceburn/__init__.py +62 -0
- traceburn-0.1.0/src/traceburn/analyze/__init__.py +3 -0
- traceburn-0.1.0/src/traceburn/analyze/diff.py +243 -0
- traceburn-0.1.0/src/traceburn/analyze/flamegraph.py +113 -0
- traceburn-0.1.0/src/traceburn/analyze/replay.py +351 -0
- traceburn-0.1.0/src/traceburn/analyze/waste/__init__.py +88 -0
- traceburn-0.1.0/src/traceburn/analyze/waste/_common.py +158 -0
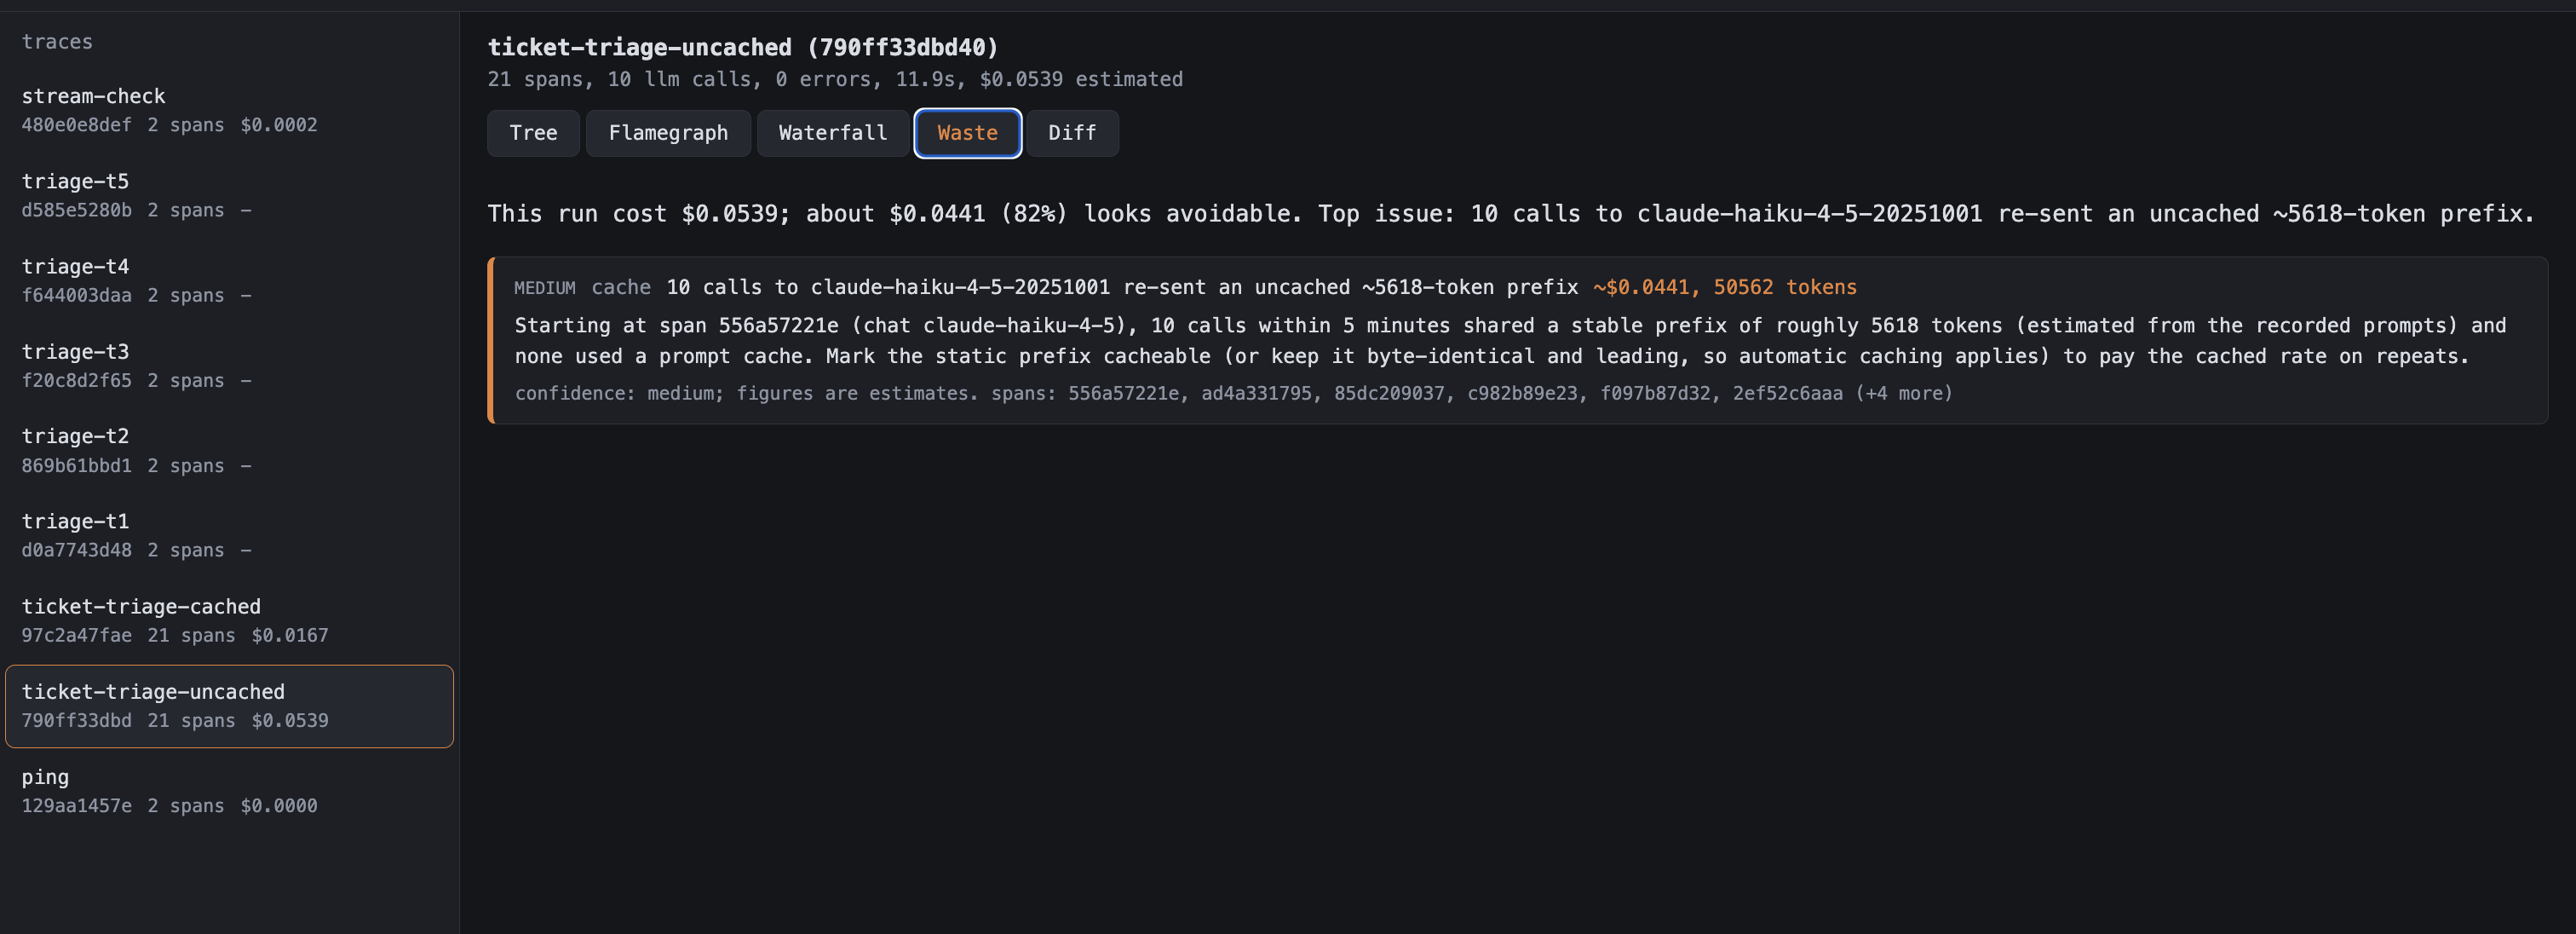
- traceburn-0.1.0/src/traceburn/analyze/waste/cache.py +126 -0
- traceburn-0.1.0/src/traceburn/analyze/waste/context_bloat.py +111 -0
- traceburn-0.1.0/src/traceburn/analyze/waste/duplicates.py +178 -0
- traceburn-0.1.0/src/traceburn/analyze/waste/loops.py +121 -0
- traceburn-0.1.0/src/traceburn/analyze/waste/model_overkill.py +94 -0
- traceburn-0.1.0/src/traceburn/cli.py +336 -0
- traceburn-0.1.0/src/traceburn/instrument/__init__.py +47 -0
- traceburn-0.1.0/src/traceburn/instrument/_util.py +260 -0
- traceburn-0.1.0/src/traceburn/instrument/anthropic.py +428 -0
- traceburn-0.1.0/src/traceburn/instrument/openai.py +458 -0
- traceburn-0.1.0/src/traceburn/pricing.json +290 -0
- traceburn-0.1.0/src/traceburn/pricing.py +180 -0
- traceburn-0.1.0/src/traceburn/recorder.py +372 -0
- traceburn-0.1.0/src/traceburn/schema.py +158 -0
- traceburn-0.1.0/src/traceburn/store.py +393 -0
- traceburn-0.1.0/src/traceburn/ui/__init__.py +5 -0
- traceburn-0.1.0/src/traceburn/ui/server.py +172 -0
- traceburn-0.1.0/src/traceburn/ui/static/app.js +454 -0
- traceburn-0.1.0/src/traceburn/ui/static/index.html +48 -0
- traceburn-0.1.0/src/traceburn/ui/static/style.css +154 -0
- traceburn-0.1.0/tests/conftest.py +42 -0
- traceburn-0.1.0/tests/test_autoinstall.py +35 -0
- traceburn-0.1.0/tests/test_cli.py +78 -0
- traceburn-0.1.0/tests/test_diff.py +122 -0
- traceburn-0.1.0/tests/test_flamegraph.py +83 -0
- traceburn-0.1.0/tests/test_instrument_anthropic.py +332 -0
- traceburn-0.1.0/tests/test_instrument_openai.py +451 -0
- traceburn-0.1.0/tests/test_no_network.py +70 -0
- traceburn-0.1.0/tests/test_pricing.py +134 -0
- traceburn-0.1.0/tests/test_recorder.py +281 -0
- traceburn-0.1.0/tests/test_replay.py +370 -0
- traceburn-0.1.0/tests/test_store.py +204 -0
- traceburn-0.1.0/tests/test_ui.py +191 -0
- traceburn-0.1.0/tests/test_waste.py +479 -0
|
@@ -0,0 +1,18 @@
|
|
|
1
|
+
cff-version: 1.2.0
|
|
2
|
+
message: "If you use traceburn in your work, please cite it as below."
|
|
3
|
+
title: "traceburn: a local-first tracer and efficiency profiler for AI agents"
|
|
4
|
+
type: software
|
|
5
|
+
authors:
|
|
6
|
+
- family-names: "Tran"
|
|
7
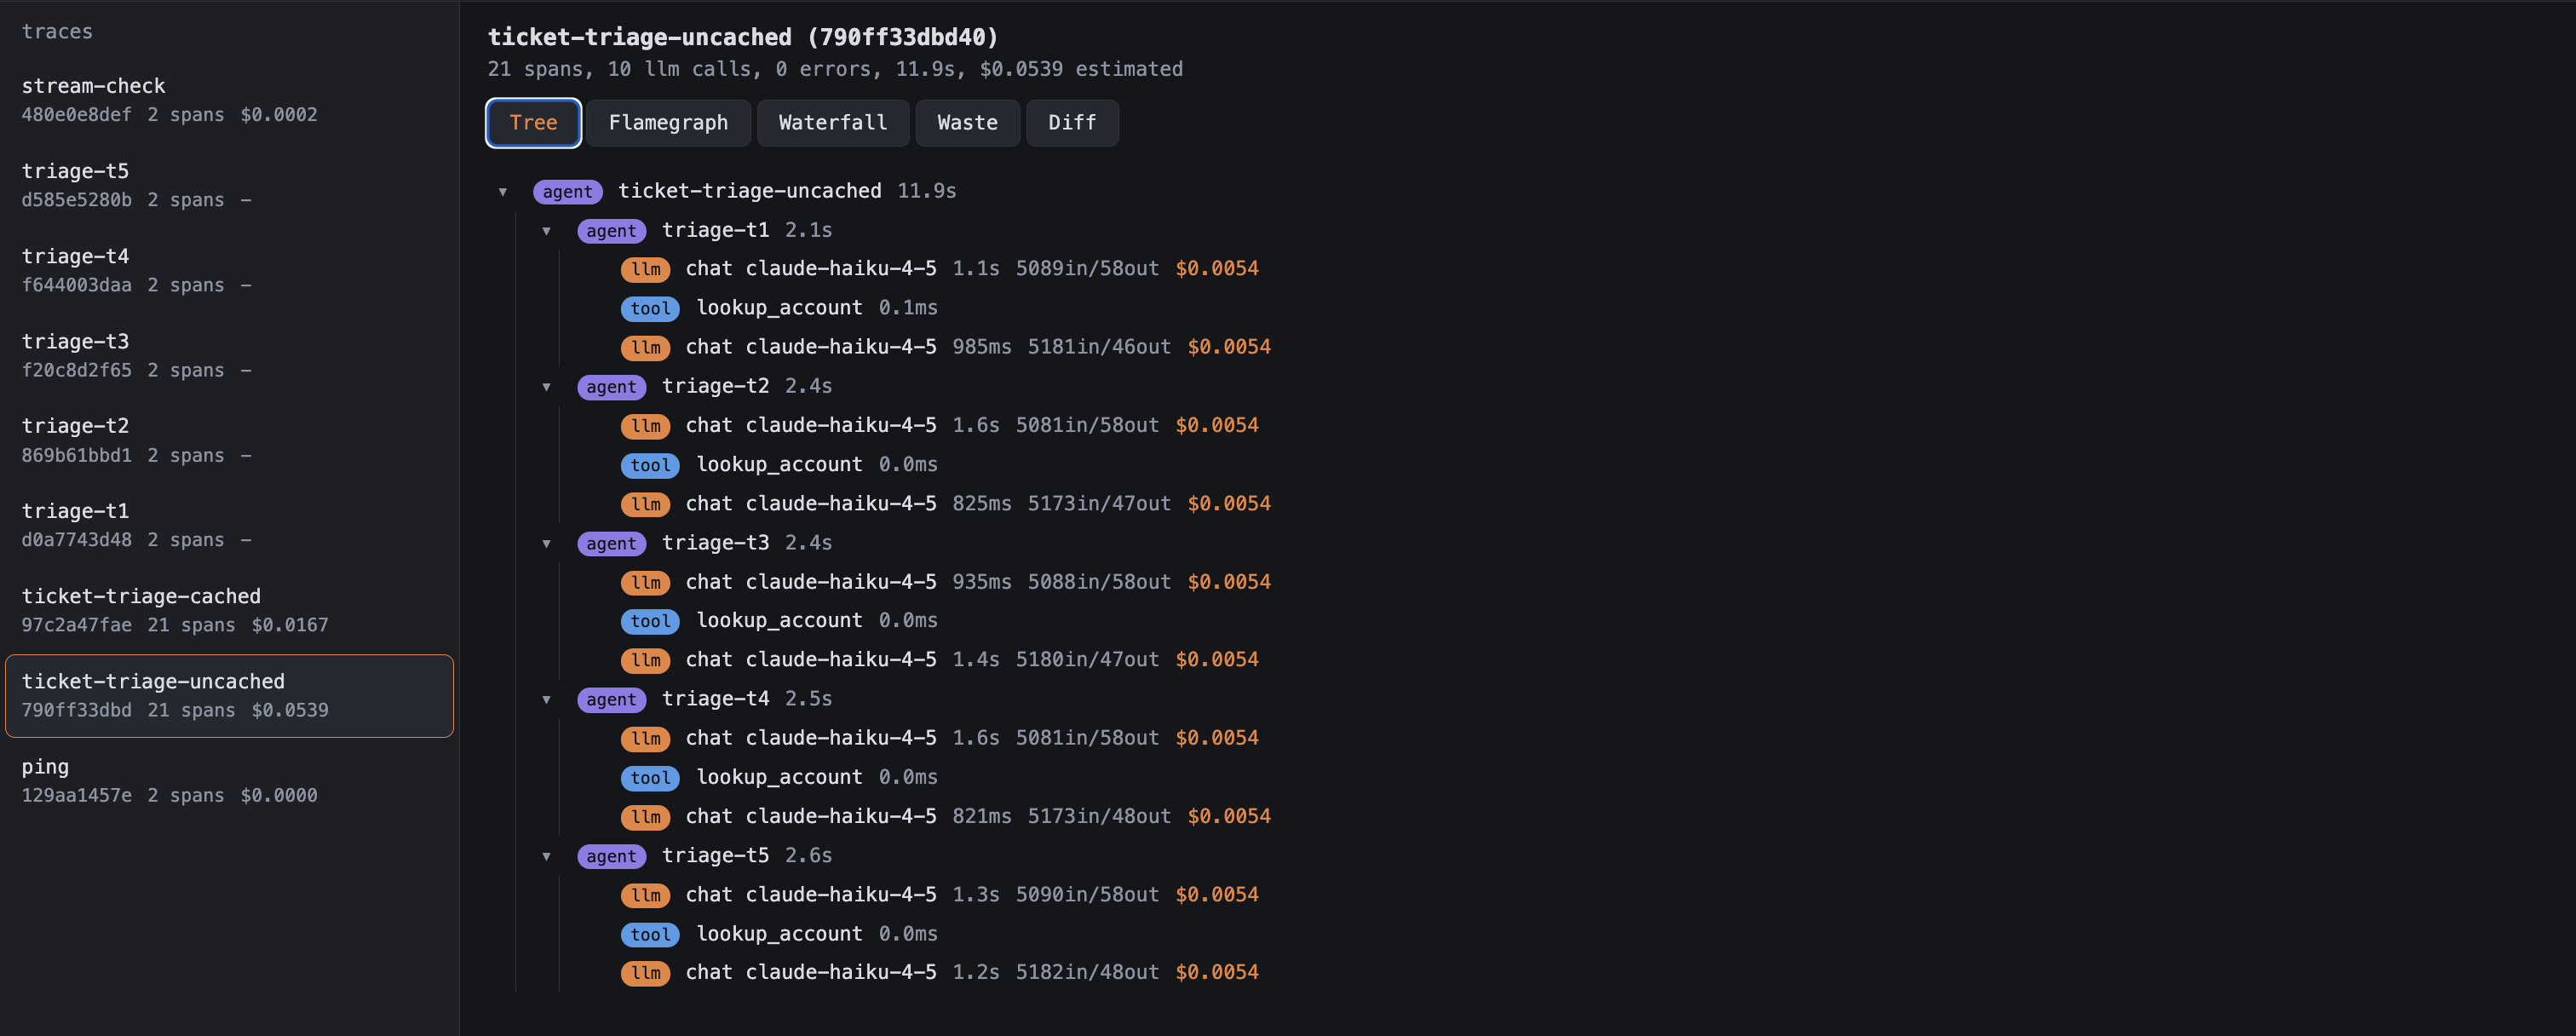
|
+
given-names: "Tommy"
|
|
8
|
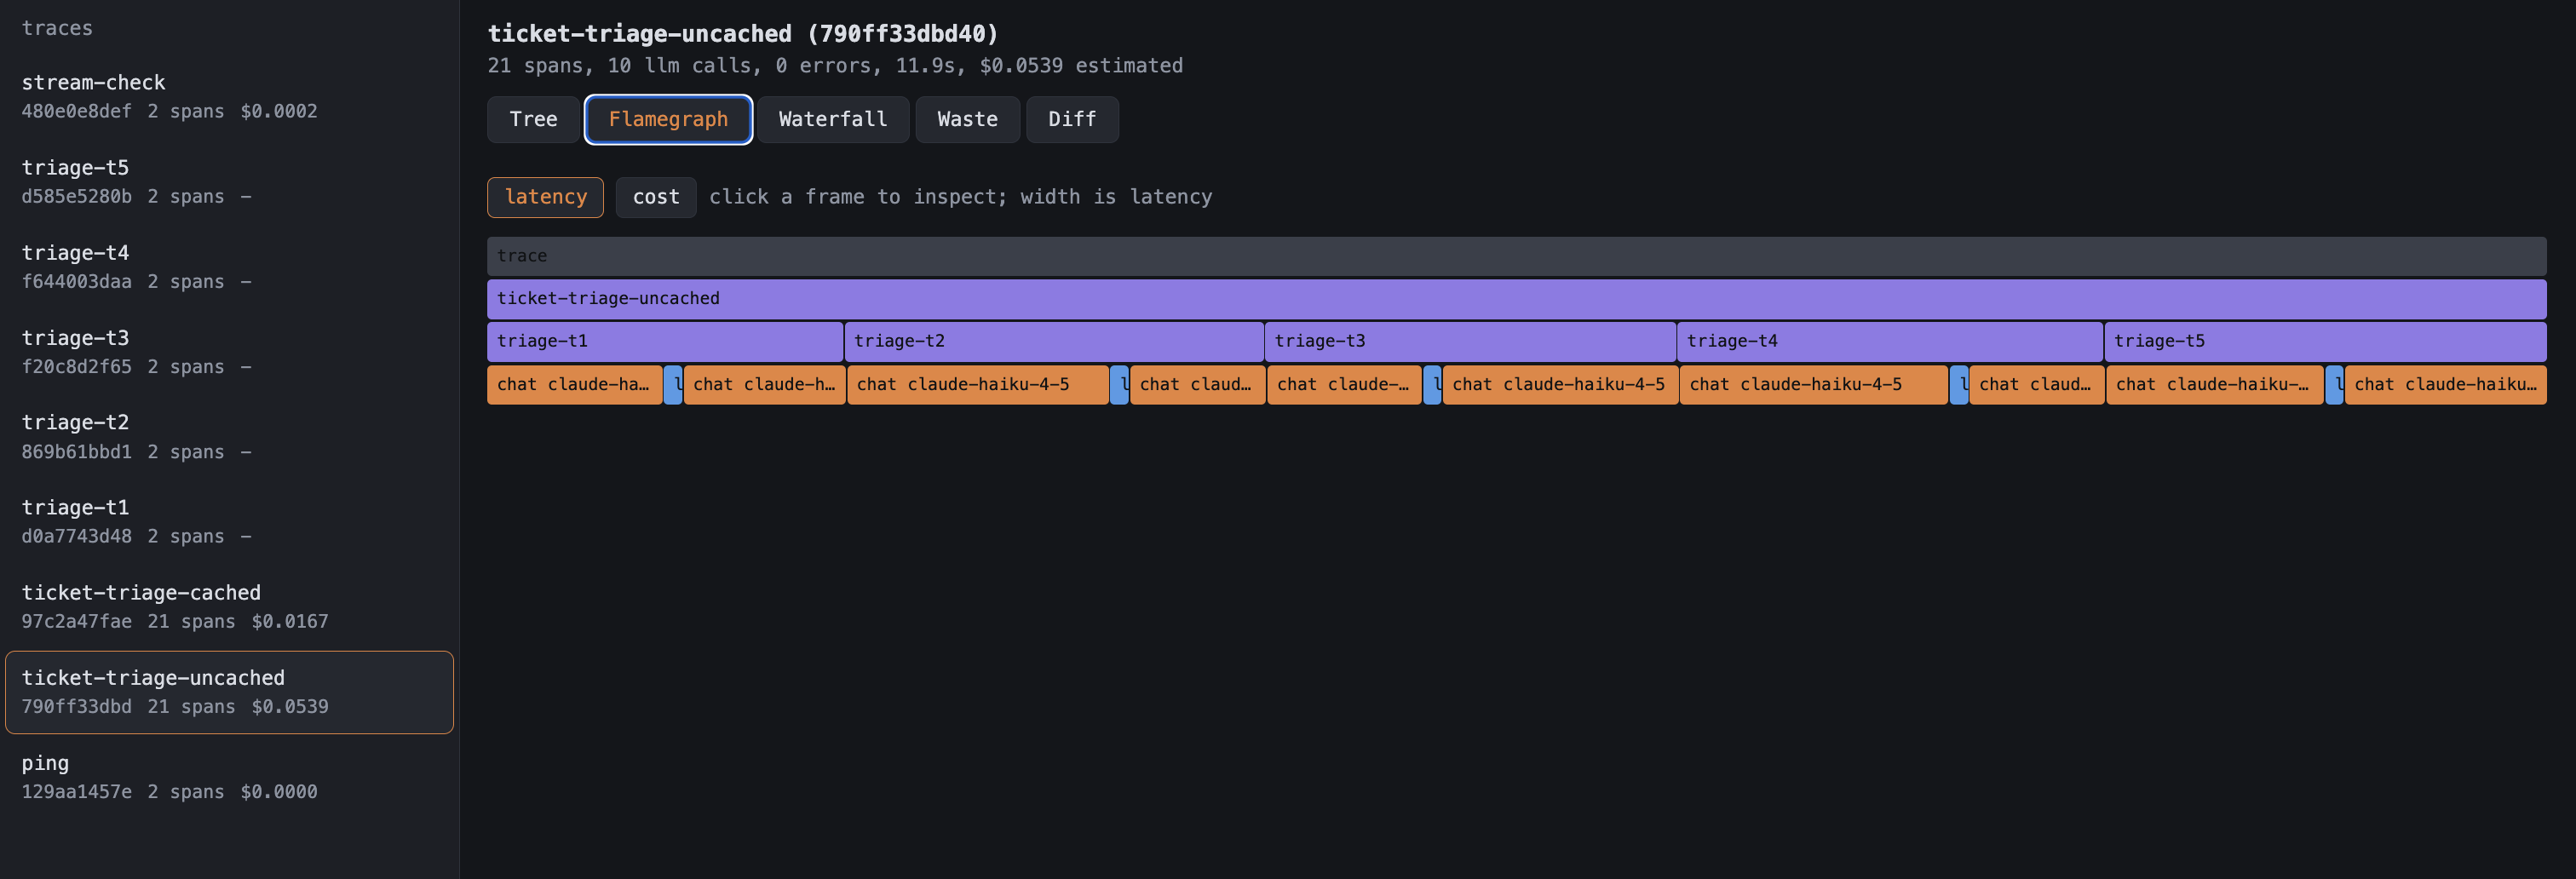
+
email: "tommy.tranxhec@gmail.com"
|
|
9
|
+
repository-code: "https://github.com/TommyTranX/traceburn"
|
|
10
|
+
license: MIT
|
|
11
|
+
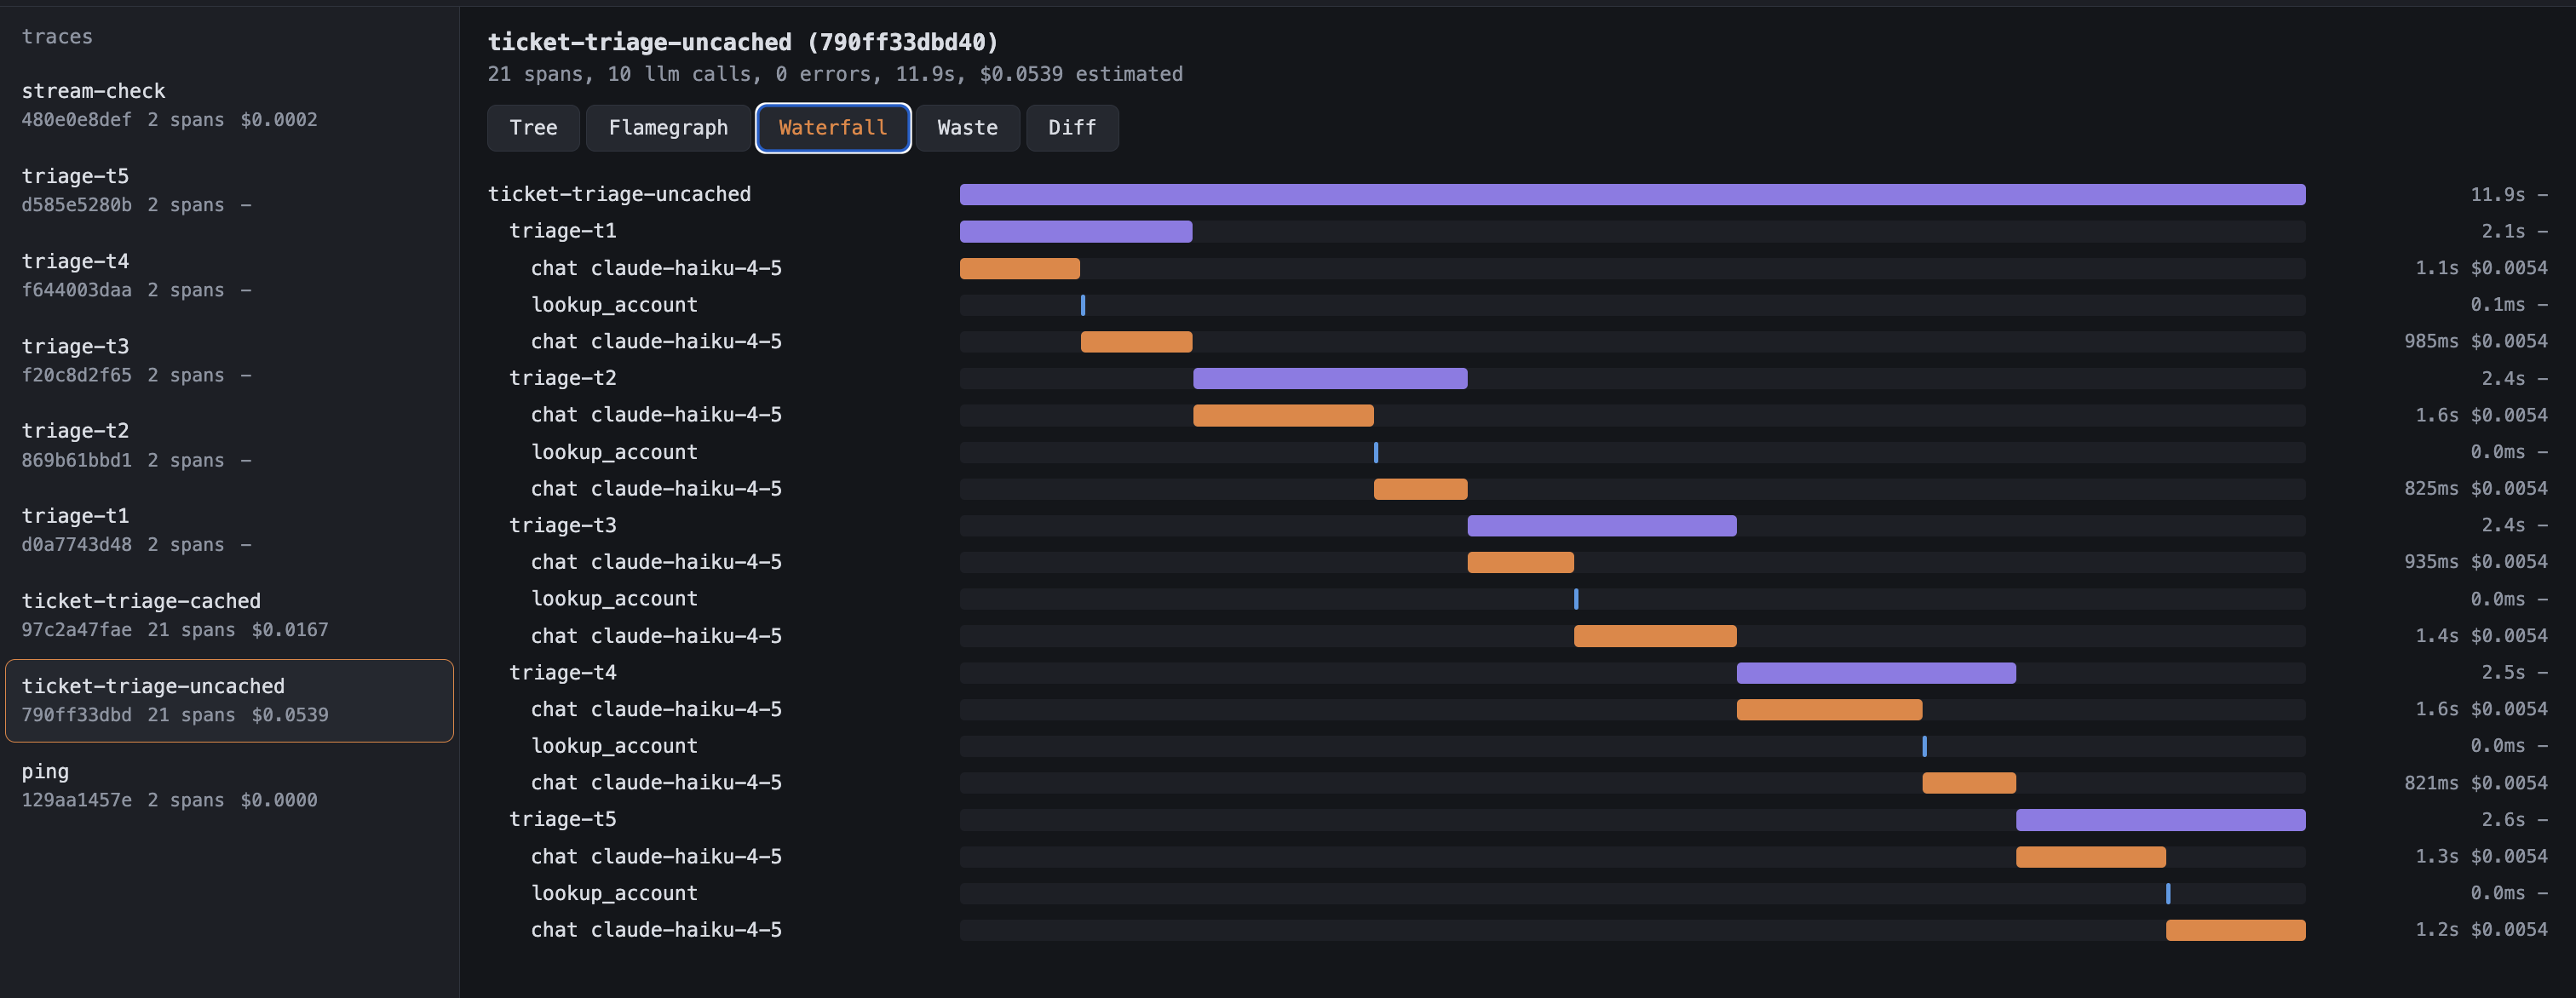
version: 0.1.0
|
|
12
|
+
date-released: "2026-07-05"
|
|
13
|
+
keywords:
|
|
14
|
+
- AI agents
|
|
15
|
+
- LLM observability
|
|
16
|
+
- tracing
|
|
17
|
+
- profiling
|
|
18
|
+
- cost efficiency
|
|
@@ -0,0 +1,54 @@
|
|
|
1
|
+
# Contributing
|
|
2
|
+
|
|
3
|
+
Contributions are welcome, and two kinds are especially wanted: new
|
|
4
|
+
instrumentation adapters and new waste rules. Both are deliberately small
|
|
5
|
+
interfaces; either is an afternoon of work.
|
|
6
|
+
|
|
7
|
+
## Setup
|
|
8
|
+
|
|
9
|
+
```
|
|
10
|
+
git clone https://github.com/TommyTranX/traceburn
|
|
11
|
+
cd traceburn
|
|
12
|
+
python -m venv .venv && . .venv/bin/activate
|
|
13
|
+
pip install -e ".[ui]" pytest openai anthropic httpx
|
|
14
|
+
pytest
|
|
15
|
+
```
|
|
16
|
+
|
|
17
|
+
The test suite makes no network calls. Instrumentation tests run the real
|
|
18
|
+
provider SDKs over `httpx.MockTransport`, so they exercise the exact
|
|
19
|
+
objects the patchers see in production without a key.
|
|
20
|
+
|
|
21
|
+
## Adding an instrumentation adapter
|
|
22
|
+
|
|
23
|
+
One module in `src/traceburn/instrument/`, three functions:
|
|
24
|
+
`is_available()`, `patch()`, `unpatch()`. The walkthrough with the span
|
|
25
|
+
attribute conventions, streaming wrappers, and the never-break rule is in
|
|
26
|
+
[docs/instrumentation.md](docs/instrumentation.md). Requirements:
|
|
27
|
+
|
|
28
|
+
- lazy imports, so the module is importable when the client library is not
|
|
29
|
+
- capture failures are swallowed and logged, never raised into the host
|
|
30
|
+
- tests via a mock transport: sync, async, streaming, tool calls, an error
|
|
31
|
+
- register it in `instrument/__init__.py`
|
|
32
|
+
|
|
33
|
+
## Adding a waste rule
|
|
34
|
+
|
|
35
|
+
One module in `src/traceburn/analyze/waste/` with `run(ctx) -> list[Finding]`.
|
|
36
|
+
The contract, helpers, and the precision bar are in
|
|
37
|
+
[docs/waste-rules.md](docs/waste-rules.md). The short version: a positive
|
|
38
|
+
test, a negative test, no dollar figure that does not follow from observed
|
|
39
|
+
tokens and the pricing table, and an honest confidence level.
|
|
40
|
+
|
|
41
|
+
## Ground rules
|
|
42
|
+
|
|
43
|
+
- `pytest` passes; new behavior comes with tests.
|
|
44
|
+
- The core package imports stdlib only. Anything heavier goes behind an
|
|
45
|
+
extra.
|
|
46
|
+
- No telemetry, no network calls of the tool's own, ever.
|
|
47
|
+
- Plain prose in docs and messages. Cost figures are always labeled
|
|
48
|
+
estimates.
|
|
49
|
+
|
|
50
|
+
## Updating the pricing table
|
|
51
|
+
|
|
52
|
+
`src/traceburn/pricing.json` carries provider list prices with an `as_of`
|
|
53
|
+
date. Corrections and new models are welcome; cite the public pricing page
|
|
54
|
+
in the PR and update `as_of`.
|
traceburn-0.1.0/LICENSE
ADDED
|
@@ -0,0 +1,21 @@
|
|
|
1
|
+
MIT License
|
|
2
|
+
|
|
3
|
+
Copyright (c) 2026 Tommy Tran
|
|
4
|
+
|
|
5
|
+
Permission is hereby granted, free of charge, to any person obtaining a copy
|
|
6
|
+
of this software and associated documentation files (the "Software"), to deal
|
|
7
|
+
in the Software without restriction, including without limitation the rights
|
|
8
|
+
to use, copy, modify, merge, publish, distribute, sublicense, and/or sell
|
|
9
|
+
copies of the Software, and to permit persons to whom the Software is
|
|
10
|
+
furnished to do so, subject to the following conditions:
|
|
11
|
+
|
|
12
|
+
The above copyright notice and this permission notice shall be included in all
|
|
13
|
+
copies or substantial portions of the Software.
|
|
14
|
+
|
|
15
|
+
THE SOFTWARE IS PROVIDED "AS IS", WITHOUT WARRANTY OF ANY KIND, EXPRESS OR
|
|
16
|
+
IMPLIED, INCLUDING BUT NOT LIMITED TO THE WARRANTIES OF MERCHANTABILITY,
|
|
17
|
+
FITNESS FOR A PARTICULAR PURPOSE AND NONINFRINGEMENT. IN NO EVENT SHALL THE
|
|
18
|
+
AUTHORS OR COPYRIGHT HOLDERS BE LIABLE FOR ANY CLAIM, DAMAGES OR OTHER
|
|
19
|
+
LIABILITY, WHETHER IN AN ACTION OF CONTRACT, TORT OR OTHERWISE, ARISING FROM,
|
|
20
|
+
OUT OF OR IN CONNECTION WITH THE SOFTWARE OR THE USE OR OTHER DEALINGS IN THE
|
|
21
|
+
SOFTWARE.
|
traceburn-0.1.0/PKG-INFO
ADDED
|
@@ -0,0 +1,259 @@
|
|
|
1
|
+
Metadata-Version: 2.4
|
|
2
|
+
Name: traceburn
|
|
3
|
+
Version: 0.1.0
|
|
4
|
+
Summary: Local-first tracer and efficiency profiler for AI agents: cost and latency flamegraphs, deterministic replay, run diffs, and waste detection over one SQLite file.
|
|
5
|
+
Project-URL: Homepage, https://github.com/TommyTranX/traceburn
|
|
6
|
+
Project-URL: Repository, https://github.com/TommyTranX/traceburn
|
|
7
|
+
Project-URL: Issues, https://github.com/TommyTranX/traceburn/issues
|
|
8
|
+
Author-email: Tommy Tran <tommy.tranxhec@gmail.com>
|
|
9
|
+
License: MIT
|
|
10
|
+
License-File: LICENSE
|
|
11
|
+
Keywords: agents,cost,llm,observability,profiling,tracing
|
|
12
|
+
Classifier: Development Status :: 3 - Alpha
|
|
13
|
+
Classifier: Intended Audience :: Developers
|
|
14
|
+
Classifier: License :: OSI Approved :: MIT License
|
|
15
|
+
Classifier: Programming Language :: Python :: 3
|
|
16
|
+
Classifier: Topic :: Software Development :: Debuggers
|
|
17
|
+
Classifier: Topic :: System :: Monitoring
|
|
18
|
+
Requires-Python: >=3.10
|
|
19
|
+
Provides-Extra: all
|
|
20
|
+
Requires-Dist: starlette>=0.37; extra == 'all'
|
|
21
|
+
Requires-Dist: uvicorn>=0.29; extra == 'all'
|
|
22
|
+
Provides-Extra: ui
|
|
23
|
+
Requires-Dist: starlette>=0.37; extra == 'ui'
|
|
24
|
+
Requires-Dist: uvicorn>=0.29; extra == 'ui'
|
|
25
|
+
Description-Content-Type: text/markdown
|
|
26
|
+
|
|
27
|
+
# traceburn
|
|
28
|
+
|
|
29
|
+
## The finding that made me build this
|
|
30
|
+
|
|
31
|
+
I wrote a small support ticket triage agent: five tickets, one tool call each, a roughly 4,700
|
|
32
|
+
token static policy prompt sent fresh on every call, model claude-haiku-4-5. Running it uncached
|
|
33
|
+
cost $0.0539. traceburn's waste report looked at the trace, noticed that same 4,700 token prefix
|
|
34
|
+
going out uncached on all 10 calls, and estimated that about 82 percent of that spend was
|
|
35
|
+
avoidable. So I added exactly the one cache_control block it suggested and reran the same five
|
|
36
|
+
tickets: $0.0167.
|
|
37
|
+
|
|
38
|
+
That's a 69 percent measured saving. The tool's estimate landed within 18 percent of what actually
|
|
39
|
+
happened, close enough to trust as a first signal, not close enough to treat as gospel. That's
|
|
40
|
+
roughly how I want a cost estimator to behave.
|
|
41
|
+
|
|
42
|
+
Prices change and models get repriced, so do not take my word for it: the reproduction is a few
|
|
43
|
+
cents and a couple of minutes, at
|
|
44
|
+
[examples/cache_before_after.py](https://github.com/TommyTranX/traceburn/blob/main/examples/cache_before_after.py).
|
|
45
|
+
Measured 2026-07-05.
|
|
46
|
+
|
|
47
|
+
|
|
48
|
+
|
|
49
|
+
That's the whole pitch in one run. traceburn is a local-first tracer and efficiency profiler for
|
|
50
|
+
AI agents, built on top of the openai and anthropic Python SDKs: a cost and latency flamegraph, a
|
|
51
|
+
waste report that quantifies avoidable spend instead of just gesturing at it, deterministic replay
|
|
52
|
+
of recorded calls, and run diffs, all backed by one SQLite file on disk. No account, no server to
|
|
53
|
+
stand up for basic use, no telemetry leaving your machine.
|
|
54
|
+
|
|
55
|
+
## Install
|
|
56
|
+
|
|
57
|
+
Core tracer, stdlib only, zero dependencies:
|
|
58
|
+
|
|
59
|
+
```bash
|
|
60
|
+
pip install traceburn
|
|
61
|
+
```
|
|
62
|
+
|
|
63
|
+
Tracer plus the local web viewer (adds starlette and uvicorn):
|
|
64
|
+
|
|
65
|
+
```bash
|
|
66
|
+
pip install "traceburn[ui]"
|
|
67
|
+
```
|
|
68
|
+
|
|
69
|
+
Requires Python 3.10 or later.
|
|
70
|
+
|
|
71
|
+
## Quickstart
|
|
72
|
+
|
|
73
|
+
Patch the SDKs at the top of your agent:
|
|
74
|
+
|
|
75
|
+
```python
|
|
76
|
+
import traceburn
|
|
77
|
+
traceburn.install()
|
|
78
|
+
|
|
79
|
+
# your existing openai / anthropic code, unchanged
|
|
80
|
+
```
|
|
81
|
+
|
|
82
|
+
Every sync call, async call, streaming response, tool call, and prompt cache hit on either SDK now
|
|
83
|
+
gets recorded as a span. Traces live in one SQLite file, `./.traceburn/traces.db` by default; set
|
|
84
|
+
the `TRACEBURN_DB` environment variable if you want it somewhere else. If you'd rather not touch
|
|
85
|
+
the source at all, wrap the run instead:
|
|
86
|
+
|
|
87
|
+
```bash
|
|
88
|
+
TRACEBURN=1 python your_agent.py
|
|
89
|
+
```
|
|
90
|
+
|
|
91
|
+
Then look at what happened:
|
|
92
|
+
|
|
93
|
+
```bash
|
|
94
|
+
traceburn ui # opens the web viewer at 127.0.0.1:8765
|
|
95
|
+
traceburn ls # list recorded traces
|
|
96
|
+
traceburn show <id> # inspect one trace
|
|
97
|
+
traceburn waste <id> # run the waste report on one trace
|
|
98
|
+
traceburn diff <a> <b> # compare two traces span by span
|
|
99
|
+
```
|
|
100
|
+
|
|
101
|
+
No API keys and nothing to configure: `python examples/offline_demo.py` records a simulated agent
|
|
102
|
+
run with realistic token counts, including one deliberate duplicate call, so you can see a real
|
|
103
|
+
trace, a real flamegraph, and a real waste finding inside a minute.
|
|
104
|
+
|
|
105
|
+
## What it actually does
|
|
106
|
+
|
|
107
|
+
**Trace.** `traceburn.install()` patches both SDKs so every call becomes a span with tokens,
|
|
108
|
+
latency, and cost attached, no code changes required past that one line. Want manual control
|
|
109
|
+
instead, or you're using a framework outside the two supported SDKs? The explicit API, `@trace`,
|
|
110
|
+
`span()`, and `session()`, works by hand with anything.
|
|
111
|
+
|
|
112
|
+
|
|
113
|
+
|
|
114
|
+
**Flamegraph.** Spans render as a flamegraph you can size two ways: by wall-clock time or by
|
|
115
|
+
dollars spent, with self-time kept separate from time spent in children, so a slow parent span
|
|
116
|
+
doesn't hide which child call actually burned the seconds or the money.
|
|
117
|
+
|
|
118
|
+
**Waste report.** Heuristics look for duplicate calls, unused cache opportunities, bloated
|
|
119
|
+
prompts, model overkill, and retry loops. Each finding ships with a confidence level and, where the
|
|
120
|
+
numbers support it, a dollar figure. More on this below.
|
|
121
|
+
|
|
122
|
+
**Replay.** `traceburn.analyze.replay.replay()` plays recorded provider responses back through the
|
|
123
|
+
real SDK types, so your agent code runs again exactly as before with zero tokens spent. That's
|
|
124
|
+
useful for tests and for debugging without burning a budget. Streaming calls aren't replayable
|
|
125
|
+
yet; replay currently only serves non-streaming recordings.
|
|
126
|
+
|
|
127
|
+
**Diff.** `traceburn diff <a> <b>` lines up two traces span by span and reports the delta in
|
|
128
|
+
tokens, cost, and latency, alongside text diffs of the prompts and responses that changed between
|
|
129
|
+
the runs. Good for answering "did that prompt tweak actually help."
|
|
130
|
+
|
|
131
|
+
## The web viewer
|
|
132
|
+
|
|
133
|
+
`traceburn ui` starts a small, read-only Starlette API in front of a vendored single-page app: no
|
|
134
|
+
build step, no CDN, everything ships in the package. It gives you the trace tree, the flamegraph,
|
|
135
|
+
a waterfall timeline, the waste report, and the run diff view.
|
|
136
|
+
|
|
137
|
+
It binds to 127.0.0.1 only and checks the request's host header against DNS rebinding, but it has
|
|
138
|
+
no authentication of any kind. That's a deliberate tradeoff: the viewer isn't meant to be reachable
|
|
139
|
+
from anywhere but your own machine.
|
|
140
|
+
|
|
141
|
+
|
|
142
|
+
|
|
143
|
+
|
|
144
|
+
|
|
145
|
+
## Framework support
|
|
146
|
+
|
|
147
|
+
Today, that means the raw `openai` and `anthropic` Python SDKs, patched automatically by
|
|
148
|
+
`traceburn.install()`. If you're on something else, the explicit `span()` / `trace()` / `session()`
|
|
149
|
+
API works with any framework right now, by hand, since it doesn't care what's making the call.
|
|
150
|
+
LangChain, LlamaIndex, and anything already emitting OpenTelemetry GenAI spans aren't instrumented
|
|
151
|
+
automatically yet. That's real, planned work for v0.2, not something already built and just
|
|
152
|
+
undocumented, and it's covered in the roadmap below.
|
|
153
|
+
|
|
154
|
+
## How the waste rules work
|
|
155
|
+
|
|
156
|
+
The rules live in `traceburn/analyze/waste/` and are documented in full at
|
|
157
|
+
[docs/waste-rules.md](https://github.com/TommyTranX/traceburn/blob/main/docs/waste-rules.md). Five
|
|
158
|
+
kinds of waste get checked for: duplicates (exact and near-duplicate repeated calls), cache (a
|
|
159
|
+
stable prompt prefix resent without ever hitting a provider cache), context_bloat (duplicate
|
|
160
|
+
blocks inside one prompt, or a huge prompt for a tiny output), model_overkill (a frontier-priced
|
|
161
|
+
model spent on trivial short calls, phrased as a suggestion and kept at low confidence on purpose),
|
|
162
|
+
and loops (retry storms, repeated identical tool calls, or a runaway step count). Every finding
|
|
163
|
+
also carries a confidence level: high, medium, low, or info.
|
|
164
|
+
|
|
165
|
+
Two principles govern all of them. A wrong finding does more damage than a missed one, so the
|
|
166
|
+
rules are tuned for precision over recall and would rather stay quiet than guess. And no dollar
|
|
167
|
+
figure is ever printed without observed tokens behind it and a price in the pricing table to
|
|
168
|
+
multiply against; everything the tool prints is labeled an estimate, because it is one.
|
|
169
|
+
|
|
170
|
+
## Privacy
|
|
171
|
+
|
|
172
|
+
traceburn makes no network calls of its own and sends no telemetry anywhere. The only traffic on
|
|
173
|
+
the wire is your own calls to your own model provider, exactly as they'd happen without traceburn
|
|
174
|
+
installed. A test,
|
|
175
|
+
[tests/test_no_network.py](https://github.com/TommyTranX/traceburn/blob/main/tests/test_no_network.py),
|
|
176
|
+
blocks all socket access at the interpreter level and then runs the recorder, the store, every
|
|
177
|
+
analyzer, and the CLI against that blockade, to prove the point rather than just assert it. Auth
|
|
178
|
+
headers are never recorded in a trace, so an API key cannot end up sitting in a stored span.
|
|
179
|
+
|
|
180
|
+
## Limitations
|
|
181
|
+
|
|
182
|
+
Instrumentation currently covers only the `openai` and `anthropic` Python SDKs. Within those,
|
|
183
|
+
`parse()` convenience methods and `with_raw_response` calls pass through untraced rather than being
|
|
184
|
+
recorded incorrectly, and multi-choice requests (`n > 1`) only record the first choice.
|
|
185
|
+
|
|
186
|
+
Cost figures come from a dated public pricing table
|
|
187
|
+
([pricing.json](https://github.com/TommyTranX/traceburn/blob/main/src/traceburn/pricing.json)) and
|
|
188
|
+
don't model long-context pricing tiers or regional surcharges. Token counts prefer whatever the
|
|
189
|
+
provider itself reports as usage; anything estimated is flagged as estimated rather than presented
|
|
190
|
+
as measured.
|
|
191
|
+
|
|
192
|
+
The waste rules are heuristics tuned for precision over recall, which means they'll miss real
|
|
193
|
+
waste sooner than they'll invent fake waste, and every finding states its own confidence so you
|
|
194
|
+
can judge it accordingly. Streaming calls aren't replayable yet; only non-streaming recordings are.
|
|
195
|
+
|
|
196
|
+
The web viewer is read-only, bound to 127.0.0.1 only, and has no authentication.
|
|
197
|
+
|
|
198
|
+
## Roadmap: v0.2
|
|
199
|
+
|
|
200
|
+
- OpenTelemetry GenAI span ingest plus OTLP export. This is also the path for capturing LangChain
|
|
201
|
+
and LlamaIndex traces, since it rides on their existing OTel instrumentation rather than
|
|
202
|
+
requiring bespoke adapters for each.
|
|
203
|
+
- A pytest plugin built on replay, for deterministic, token-free agent tests.
|
|
204
|
+
- litellm instrumentation.
|
|
205
|
+
- More waste rules.
|
|
206
|
+
|
|
207
|
+
## Related work
|
|
208
|
+
|
|
209
|
+
[Langfuse](https://github.com/langfuse/langfuse) is a full open-source LLM platform: tracing,
|
|
210
|
+
evals, and prompt management, backed by Postgres and ClickHouse and meant to run as a server.
|
|
211
|
+
|
|
212
|
+
[Arize Phoenix](https://github.com/Arize-ai/phoenix) is the closest neighbor here. It runs locally
|
|
213
|
+
against SQLite with no account needed, and it's strong on tracing and evals, but it runs as a
|
|
214
|
+
server process with a fairly large dependency set, and it doesn't focus on waste detection, a
|
|
215
|
+
cost-weighted flamegraph, deterministic replay, or run diffs.
|
|
216
|
+
|
|
217
|
+
MLflow has been adding GenAI tracing, trace comparison, and efficiency scoring to its tracking
|
|
218
|
+
server; see [mlflow/mlflow](https://github.com/mlflow/mlflow).
|
|
219
|
+
|
|
220
|
+
[LangSmith](https://smith.langchain.com) is LangChain's hosted, proprietary platform.
|
|
221
|
+
[OpenLLMetry](https://github.com/traceloop/openllmetry) takes a different approach: it instruments
|
|
222
|
+
your code and exports OpenTelemetry spans to whatever backend you choose to point it at, rather
|
|
223
|
+
than shipping a backend of its own.
|
|
224
|
+
|
|
225
|
+
[AgentSight](https://github.com/eunomia-bpf/agentsight) renders token flamegraphs of coding agents
|
|
226
|
+
from the system side using eBPF, a genuinely different vantage point, though it's Linux only.
|
|
227
|
+
|
|
228
|
+
Helicone ([Helicone/helicone](https://github.com/Helicone/helicone)), OpenLIT
|
|
229
|
+
([openlit/openlit](https://github.com/openlit/openlit)), Braintrust
|
|
230
|
+
([braintrust.dev](https://braintrust.dev)), and Logfire
|
|
231
|
+
([pydantic.dev/logfire](https://pydantic.dev/logfire)) each pair instrumentation with a server or a
|
|
232
|
+
cloud backend of their own.
|
|
233
|
+
|
|
234
|
+
traceburn's own position is narrower than most of the above: strictly local, one file, no account
|
|
235
|
+
and no server needed for basic use, framework-agnostic at the SDK level, and built around
|
|
236
|
+
efficiency first, meaning the waste report, the dollar-weighted flamegraph, replay, and diff all
|
|
237
|
+
live together in one small package. It's meant to sit next to whatever observability stack you
|
|
238
|
+
already run, not replace it.
|
|
239
|
+
|
|
240
|
+
## Contributing
|
|
241
|
+
|
|
242
|
+
There are two extension points, each documented and each meant to be roughly an afternoon of work:
|
|
243
|
+
an [instrumentation adapter](https://github.com/TommyTranX/traceburn/blob/main/docs/instrumentation.md)
|
|
244
|
+
for a new SDK or framework, and a
|
|
245
|
+
[waste rule](https://github.com/TommyTranX/traceburn/blob/main/docs/waste-rules.md) for a new
|
|
246
|
+
pattern of avoidable spend. The full guide is at
|
|
247
|
+
[CONTRIBUTING.md](https://github.com/TommyTranX/traceburn/blob/main/CONTRIBUTING.md).
|
|
248
|
+
|
|
249
|
+
## Citation
|
|
250
|
+
|
|
251
|
+
A citation file is included at
|
|
252
|
+
[CITATION.cff](https://github.com/TommyTranX/traceburn/blob/main/CITATION.cff).
|
|
253
|
+
|
|
254
|
+
## License
|
|
255
|
+
|
|
256
|
+
MIT. Full text at
|
|
257
|
+
[LICENSE](https://github.com/TommyTranX/traceburn/blob/main/LICENSE).
|
|
258
|
+
|
|
259
|
+
Written by Tommy Tran.
|
|
@@ -0,0 +1,233 @@
|
|
|
1
|
+
# traceburn
|
|
2
|
+
|
|
3
|
+
## The finding that made me build this
|
|
4
|
+
|
|
5
|
+
I wrote a small support ticket triage agent: five tickets, one tool call each, a roughly 4,700
|
|
6
|
+
token static policy prompt sent fresh on every call, model claude-haiku-4-5. Running it uncached
|
|
7
|
+
cost $0.0539. traceburn's waste report looked at the trace, noticed that same 4,700 token prefix
|
|
8
|
+
going out uncached on all 10 calls, and estimated that about 82 percent of that spend was
|
|
9
|
+
avoidable. So I added exactly the one cache_control block it suggested and reran the same five
|
|
10
|
+
tickets: $0.0167.
|
|
11
|
+
|
|
12
|
+
That's a 69 percent measured saving. The tool's estimate landed within 18 percent of what actually
|
|
13
|
+
happened, close enough to trust as a first signal, not close enough to treat as gospel. That's
|
|
14
|
+
roughly how I want a cost estimator to behave.
|
|
15
|
+
|
|
16
|
+
Prices change and models get repriced, so do not take my word for it: the reproduction is a few
|
|
17
|
+
cents and a couple of minutes, at
|
|
18
|
+
[examples/cache_before_after.py](https://github.com/TommyTranX/traceburn/blob/main/examples/cache_before_after.py).
|
|
19
|
+
Measured 2026-07-05.
|
|
20
|
+
|
|
21
|
+

|
|
22
|
+
|
|
23
|
+
That's the whole pitch in one run. traceburn is a local-first tracer and efficiency profiler for
|
|
24
|
+
AI agents, built on top of the openai and anthropic Python SDKs: a cost and latency flamegraph, a
|
|
25
|
+
waste report that quantifies avoidable spend instead of just gesturing at it, deterministic replay
|
|
26
|
+
of recorded calls, and run diffs, all backed by one SQLite file on disk. No account, no server to
|
|
27
|
+
stand up for basic use, no telemetry leaving your machine.
|
|
28
|
+
|
|
29
|
+
## Install
|
|
30
|
+
|
|
31
|
+
Core tracer, stdlib only, zero dependencies:
|
|
32
|
+
|
|
33
|
+
```bash
|
|
34
|
+
pip install traceburn
|
|
35
|
+
```
|
|
36
|
+
|
|
37
|
+
Tracer plus the local web viewer (adds starlette and uvicorn):
|
|
38
|
+
|
|
39
|
+
```bash
|
|
40
|
+
pip install "traceburn[ui]"
|
|
41
|
+
```
|
|
42
|
+
|
|
43
|
+
Requires Python 3.10 or later.
|
|
44
|
+
|
|
45
|
+
## Quickstart
|
|
46
|
+
|
|
47
|
+
Patch the SDKs at the top of your agent:
|
|
48
|
+
|
|
49
|
+
```python
|
|
50
|
+
import traceburn
|
|
51
|
+
traceburn.install()
|
|
52
|
+
|
|
53
|
+
# your existing openai / anthropic code, unchanged
|
|
54
|
+
```
|
|
55
|
+
|
|
56
|
+
Every sync call, async call, streaming response, tool call, and prompt cache hit on either SDK now
|
|
57
|
+
gets recorded as a span. Traces live in one SQLite file, `./.traceburn/traces.db` by default; set
|
|
58
|
+
the `TRACEBURN_DB` environment variable if you want it somewhere else. If you'd rather not touch
|
|
59
|
+
the source at all, wrap the run instead:
|
|
60
|
+
|
|
61
|
+
```bash
|
|
62
|
+
TRACEBURN=1 python your_agent.py
|
|
63
|
+
```
|
|
64
|
+
|
|
65
|
+
Then look at what happened:
|
|
66
|
+
|
|
67
|
+
```bash
|
|
68
|
+
traceburn ui # opens the web viewer at 127.0.0.1:8765
|
|
69
|
+
traceburn ls # list recorded traces
|
|
70
|
+
traceburn show <id> # inspect one trace
|
|
71
|
+
traceburn waste <id> # run the waste report on one trace
|
|
72
|
+
traceburn diff <a> <b> # compare two traces span by span
|
|
73
|
+
```
|
|
74
|
+
|
|
75
|
+
No API keys and nothing to configure: `python examples/offline_demo.py` records a simulated agent
|
|
76
|
+
run with realistic token counts, including one deliberate duplicate call, so you can see a real
|
|
77
|
+
trace, a real flamegraph, and a real waste finding inside a minute.
|
|
78
|
+
|
|
79
|
+
## What it actually does
|
|
80
|
+
|
|
81
|
+
**Trace.** `traceburn.install()` patches both SDKs so every call becomes a span with tokens,
|
|
82
|
+
latency, and cost attached, no code changes required past that one line. Want manual control
|
|
83
|
+
instead, or you're using a framework outside the two supported SDKs? The explicit API, `@trace`,
|
|
84
|
+
`span()`, and `session()`, works by hand with anything.
|
|
85
|
+
|
|
86
|
+

|
|
87
|
+
|
|
88
|
+
**Flamegraph.** Spans render as a flamegraph you can size two ways: by wall-clock time or by
|
|
89
|
+
dollars spent, with self-time kept separate from time spent in children, so a slow parent span
|
|
90
|
+
doesn't hide which child call actually burned the seconds or the money.
|
|
91
|
+
|
|
92
|
+
**Waste report.** Heuristics look for duplicate calls, unused cache opportunities, bloated
|
|
93
|
+
prompts, model overkill, and retry loops. Each finding ships with a confidence level and, where the
|
|
94
|
+
numbers support it, a dollar figure. More on this below.
|
|
95
|
+
|
|
96
|
+
**Replay.** `traceburn.analyze.replay.replay()` plays recorded provider responses back through the
|
|
97
|
+
real SDK types, so your agent code runs again exactly as before with zero tokens spent. That's
|
|
98
|
+
useful for tests and for debugging without burning a budget. Streaming calls aren't replayable
|
|
99
|
+
yet; replay currently only serves non-streaming recordings.
|
|
100
|
+
|
|
101
|
+
**Diff.** `traceburn diff <a> <b>` lines up two traces span by span and reports the delta in
|
|
102
|
+
tokens, cost, and latency, alongside text diffs of the prompts and responses that changed between
|
|
103
|
+
the runs. Good for answering "did that prompt tweak actually help."
|
|
104
|
+
|
|
105
|
+
## The web viewer
|
|
106
|
+
|
|
107
|
+
`traceburn ui` starts a small, read-only Starlette API in front of a vendored single-page app: no
|
|
108
|
+
build step, no CDN, everything ships in the package. It gives you the trace tree, the flamegraph,
|
|
109
|
+
a waterfall timeline, the waste report, and the run diff view.
|
|
110
|
+
|
|
111
|
+
It binds to 127.0.0.1 only and checks the request's host header against DNS rebinding, but it has
|
|
112
|
+
no authentication of any kind. That's a deliberate tradeoff: the viewer isn't meant to be reachable
|
|
113
|
+
from anywhere but your own machine.
|
|
114
|
+
|
|
115
|
+

|
|
116
|
+
|
|
117
|
+

|
|
118
|
+
|
|
119
|
+
## Framework support
|
|
120
|
+
|
|
121
|
+
Today, that means the raw `openai` and `anthropic` Python SDKs, patched automatically by
|
|
122
|
+
`traceburn.install()`. If you're on something else, the explicit `span()` / `trace()` / `session()`
|
|
123
|
+
API works with any framework right now, by hand, since it doesn't care what's making the call.
|
|
124
|
+
LangChain, LlamaIndex, and anything already emitting OpenTelemetry GenAI spans aren't instrumented
|
|
125
|
+
automatically yet. That's real, planned work for v0.2, not something already built and just
|
|
126
|
+
undocumented, and it's covered in the roadmap below.
|
|
127
|
+
|
|
128
|
+
## How the waste rules work
|
|
129
|
+
|
|
130
|
+
The rules live in `traceburn/analyze/waste/` and are documented in full at
|
|
131
|
+
[docs/waste-rules.md](https://github.com/TommyTranX/traceburn/blob/main/docs/waste-rules.md). Five
|
|
132
|
+
kinds of waste get checked for: duplicates (exact and near-duplicate repeated calls), cache (a
|
|
133
|
+
stable prompt prefix resent without ever hitting a provider cache), context_bloat (duplicate
|
|
134
|
+
blocks inside one prompt, or a huge prompt for a tiny output), model_overkill (a frontier-priced
|
|
135
|
+
model spent on trivial short calls, phrased as a suggestion and kept at low confidence on purpose),
|
|
136
|
+
and loops (retry storms, repeated identical tool calls, or a runaway step count). Every finding
|
|
137
|
+
also carries a confidence level: high, medium, low, or info.
|
|
138
|
+
|
|
139
|
+
Two principles govern all of them. A wrong finding does more damage than a missed one, so the
|
|
140
|
+
rules are tuned for precision over recall and would rather stay quiet than guess. And no dollar
|
|
141
|
+
figure is ever printed without observed tokens behind it and a price in the pricing table to
|
|
142
|
+
multiply against; everything the tool prints is labeled an estimate, because it is one.
|
|
143
|
+
|
|
144
|
+
## Privacy
|
|
145
|
+
|
|
146
|
+
traceburn makes no network calls of its own and sends no telemetry anywhere. The only traffic on
|
|
147
|
+
the wire is your own calls to your own model provider, exactly as they'd happen without traceburn
|
|
148
|
+
installed. A test,
|
|
149
|
+
[tests/test_no_network.py](https://github.com/TommyTranX/traceburn/blob/main/tests/test_no_network.py),
|
|
150
|
+
blocks all socket access at the interpreter level and then runs the recorder, the store, every
|
|
151
|
+
analyzer, and the CLI against that blockade, to prove the point rather than just assert it. Auth
|
|
152
|
+
headers are never recorded in a trace, so an API key cannot end up sitting in a stored span.
|
|
153
|
+
|
|
154
|
+
## Limitations
|
|
155
|
+
|
|
156
|
+
Instrumentation currently covers only the `openai` and `anthropic` Python SDKs. Within those,
|
|
157
|
+
`parse()` convenience methods and `with_raw_response` calls pass through untraced rather than being
|
|
158
|
+
recorded incorrectly, and multi-choice requests (`n > 1`) only record the first choice.
|
|
159
|
+
|
|
160
|
+
Cost figures come from a dated public pricing table
|
|
161
|
+
([pricing.json](https://github.com/TommyTranX/traceburn/blob/main/src/traceburn/pricing.json)) and
|
|
162
|
+
don't model long-context pricing tiers or regional surcharges. Token counts prefer whatever the
|
|
163
|
+
provider itself reports as usage; anything estimated is flagged as estimated rather than presented
|
|
164
|
+
as measured.
|
|
165
|
+
|
|
166
|
+
The waste rules are heuristics tuned for precision over recall, which means they'll miss real
|
|
167
|
+
waste sooner than they'll invent fake waste, and every finding states its own confidence so you
|
|
168
|
+
can judge it accordingly. Streaming calls aren't replayable yet; only non-streaming recordings are.
|
|
169
|
+
|
|
170
|
+
The web viewer is read-only, bound to 127.0.0.1 only, and has no authentication.
|
|
171
|
+
|
|
172
|
+
## Roadmap: v0.2
|
|
173
|
+
|
|
174
|
+
- OpenTelemetry GenAI span ingest plus OTLP export. This is also the path for capturing LangChain
|
|
175
|
+
and LlamaIndex traces, since it rides on their existing OTel instrumentation rather than
|
|
176
|
+
requiring bespoke adapters for each.
|
|
177
|
+
- A pytest plugin built on replay, for deterministic, token-free agent tests.
|
|
178
|
+
- litellm instrumentation.
|
|
179
|
+
- More waste rules.
|
|
180
|
+
|
|
181
|
+
## Related work
|
|
182
|
+
|
|
183
|
+
[Langfuse](https://github.com/langfuse/langfuse) is a full open-source LLM platform: tracing,
|
|
184
|
+
evals, and prompt management, backed by Postgres and ClickHouse and meant to run as a server.
|
|
185
|
+
|
|
186
|
+
[Arize Phoenix](https://github.com/Arize-ai/phoenix) is the closest neighbor here. It runs locally
|
|
187
|
+
against SQLite with no account needed, and it's strong on tracing and evals, but it runs as a
|
|
188
|
+
server process with a fairly large dependency set, and it doesn't focus on waste detection, a
|
|
189
|
+
cost-weighted flamegraph, deterministic replay, or run diffs.
|
|
190
|
+
|
|
191
|
+
MLflow has been adding GenAI tracing, trace comparison, and efficiency scoring to its tracking
|
|
192
|
+
server; see [mlflow/mlflow](https://github.com/mlflow/mlflow).
|
|
193
|
+
|
|
194
|
+
[LangSmith](https://smith.langchain.com) is LangChain's hosted, proprietary platform.
|
|
195
|
+
[OpenLLMetry](https://github.com/traceloop/openllmetry) takes a different approach: it instruments
|
|
196
|
+
your code and exports OpenTelemetry spans to whatever backend you choose to point it at, rather
|
|
197
|
+
than shipping a backend of its own.
|
|
198
|
+
|
|
199
|
+
[AgentSight](https://github.com/eunomia-bpf/agentsight) renders token flamegraphs of coding agents
|
|
200
|
+
from the system side using eBPF, a genuinely different vantage point, though it's Linux only.
|
|
201
|
+
|
|
202
|
+
Helicone ([Helicone/helicone](https://github.com/Helicone/helicone)), OpenLIT
|
|
203
|
+
([openlit/openlit](https://github.com/openlit/openlit)), Braintrust
|
|
204
|
+
([braintrust.dev](https://braintrust.dev)), and Logfire
|
|
205
|
+
([pydantic.dev/logfire](https://pydantic.dev/logfire)) each pair instrumentation with a server or a
|
|
206
|
+
cloud backend of their own.
|
|
207
|
+
|
|
208
|
+
traceburn's own position is narrower than most of the above: strictly local, one file, no account
|
|
209
|
+
and no server needed for basic use, framework-agnostic at the SDK level, and built around
|
|
210
|
+
efficiency first, meaning the waste report, the dollar-weighted flamegraph, replay, and diff all
|
|
211
|
+
live together in one small package. It's meant to sit next to whatever observability stack you
|
|
212
|
+
already run, not replace it.
|
|
213
|
+
|
|
214
|
+
## Contributing
|
|
215
|
+
|
|
216
|
+
There are two extension points, each documented and each meant to be roughly an afternoon of work:
|
|
217
|
+
an [instrumentation adapter](https://github.com/TommyTranX/traceburn/blob/main/docs/instrumentation.md)
|
|
218
|
+
for a new SDK or framework, and a
|
|
219
|
+
[waste rule](https://github.com/TommyTranX/traceburn/blob/main/docs/waste-rules.md) for a new
|
|
220
|
+
pattern of avoidable spend. The full guide is at
|
|
221
|
+
[CONTRIBUTING.md](https://github.com/TommyTranX/traceburn/blob/main/CONTRIBUTING.md).
|
|
222
|
+
|
|
223
|
+
## Citation
|
|
224
|
+
|
|
225
|
+
A citation file is included at
|
|
226
|
+
[CITATION.cff](https://github.com/TommyTranX/traceburn/blob/main/CITATION.cff).
|
|
227
|
+
|
|
228
|
+
## License
|
|
229
|
+
|
|
230
|
+
MIT. Full text at
|
|
231
|
+
[LICENSE](https://github.com/TommyTranX/traceburn/blob/main/LICENSE).
|
|
232
|
+
|
|
233
|
+
Written by Tommy Tran.
|
|
Binary file
|
|
Binary file
|
|
Binary file
|
|
Binary file
|
|
@@ -0,0 +1,57 @@
|
|
|
1
|
+
# Concepts
|
|
2
|
+
|
|
3
|
+
## The data model
|
|
4
|
+
|
|
5
|
+
Three tables, plus content-addressed blobs, in one SQLite file:
|
|
6
|
+
|
|
7
|
+
- A **session** groups related traces (a batch run, a test suite pass).
|
|
8
|
+
- A **trace** is one run: everything under one root span.
|
|
9
|
+
- A **span** is one timed operation with a `kind`: `llm`, `tool`, `agent`,
|
|
10
|
+
`retrieval`, or `custom`. Spans nest via `parent_id`.
|
|
11
|
+
|
|
12
|
+
LLM spans follow the OpenTelemetry GenAI attribute names where they exist
|
|
13
|
+
(`gen_ai.system`, `gen_ai.request.model`, `gen_ai.usage.input_tokens`, and
|
|
14
|
+
so on) plus traceburn extensions: cache token splits, estimated cost, the
|
|
15
|
+
normalized request and response, and a `request_hash` used by replay and
|
|
16
|
+
duplicate detection. The full conventions live in `schema.py` and are a
|
|
17
|
+
public, versioned interface.
|
|
18
|
+
|
|
19
|
+
## Token accounting
|
|
20
|
+
|
|
21
|
+
`gen_ai.usage.input_tokens` counts only tokens billed at the full input
|
|
22
|
+
rate. Cache reads (`cached_input_tokens`) and cache writes
|
|
23
|
+
(`cache_write_tokens`) are separate, so cost math stays auditable:
|
|
24
|
+
|
|
25
|
+
```
|
|
26
|
+
cost = input * input_rate + cached * cached_rate
|
|
27
|
+
+ cache_write * write_rate + output * output_rate
|
|
28
|
+
```
|
|
29
|
+
|
|
30
|
+
Rates come from a dated, user-overridable pricing table
|
|
31
|
+
(`pricing.json`, `TRACEBURN_PRICING`). When a provider omits usage (some
|
|
32
|
+
streaming shapes), counts are estimated and the span carries
|
|
33
|
+
`usage_estimated: true`.
|
|
34
|
+
|
|
35
|
+
## Storage
|
|
36
|
+
|
|
37
|
+
WAL mode, so the viewer reads while your agent writes. Large request and
|
|
38
|
+
response payloads are stored once in a blobs table, keyed by content hash;
|
|
39
|
+
identical payloads across calls cost one row, which is also what makes
|
|
40
|
+
duplicate detection and replay lookups cheap. The schema is versioned via
|
|
41
|
+
a meta row.
|
|
42
|
+
|
|
43
|
+
## Write path guarantees
|
|
44
|
+
|
|
45
|
+
A failure inside traceburn never breaks your agent: store writes are
|
|
46
|
+
guarded, patcher capture errors degrade to an untraced call, and spans for
|
|
47
|
+
abandoned streams finalize at garbage collection. Exceptions from your own
|
|
48
|
+
code always propagate; the span just records the error first.
|
|
49
|
+
|
|
50
|
+
## The analyzers
|
|
51
|
+
|
|
52
|
+
Everything in `traceburn/analyze/` reads the store and computes:
|
|
53
|
+
flamegraph folds (latency- or cost-weighted), waterfall timelines, run
|
|
54
|
+
diffs, deterministic replay, and the waste report. None of it makes a
|
|
55
|
+
network call. The CLI and the web viewer are two skins over the same
|
|
56
|
+
functions, and every JSON shape they emit is a public interface you can
|
|
57
|
+
consume without importing the analyzers.
|