torchwatch-tui 0.1.0__tar.gz
This diff represents the content of publicly available package versions that have been released to one of the supported registries. The information contained in this diff is provided for informational purposes only and reflects changes between package versions as they appear in their respective public registries.
- torchwatch_tui-0.1.0/.gitignore +18 -0
- torchwatch_tui-0.1.0/LICENSE +21 -0
- torchwatch_tui-0.1.0/PKG-INFO +138 -0
- torchwatch_tui-0.1.0/README.md +105 -0
- torchwatch_tui-0.1.0/pyproject.toml +66 -0
- torchwatch_tui-0.1.0/tests/fixtures/README.md +14 -0
- torchwatch_tui-0.1.0/tests/fixtures/hf_trainer.log +7 -0
- torchwatch_tui-0.1.0/tests/fixtures/lightning.log +5 -0
- torchwatch_tui-0.1.0/tests/fixtures/noise.log +6 -0
- torchwatch_tui-0.1.0/tests/fixtures/plain.log +6 -0
- torchwatch_tui-0.1.0/tests/fixtures/tqdm.log +1 -0
- torchwatch_tui-0.1.0/tests/test_alert_log.py +65 -0
- torchwatch_tui-0.1.0/tests/test_alert_wiring.py +145 -0
- torchwatch_tui-0.1.0/tests/test_alerts.py +49 -0
- torchwatch_tui-0.1.0/tests/test_app.py +89 -0
- torchwatch_tui-0.1.0/tests/test_cli.py +48 -0
- torchwatch_tui-0.1.0/tests/test_demo.py +11 -0
- torchwatch_tui-0.1.0/tests/test_eta.py +64 -0
- torchwatch_tui-0.1.0/tests/test_nvidia.py +17 -0
- torchwatch_tui-0.1.0/tests/test_proc.py +48 -0
- torchwatch_tui-0.1.0/tests/test_sparkline.py +32 -0
- torchwatch_tui-0.1.0/tests/test_stdout_parser.py +75 -0
- torchwatch_tui-0.1.0/tests/test_stream.py +44 -0
- torchwatch_tui-0.1.0/tests/test_tail.py +76 -0
- torchwatch_tui-0.1.0/tests/test_wrapper.py +37 -0
- torchwatch_tui-0.1.0/torchwatch/__init__.py +3 -0
- torchwatch_tui-0.1.0/torchwatch/alerts.py +141 -0
- torchwatch_tui-0.1.0/torchwatch/app.py +264 -0
- torchwatch_tui-0.1.0/torchwatch/cli.py +98 -0
- torchwatch_tui-0.1.0/torchwatch/collector/__init__.py +1 -0
- torchwatch_tui-0.1.0/torchwatch/collector/demo.py +41 -0
- torchwatch_tui-0.1.0/torchwatch/collector/nvidia.py +141 -0
- torchwatch_tui-0.1.0/torchwatch/collector/proc.py +83 -0
- torchwatch_tui-0.1.0/torchwatch/collector/stdout.py +116 -0
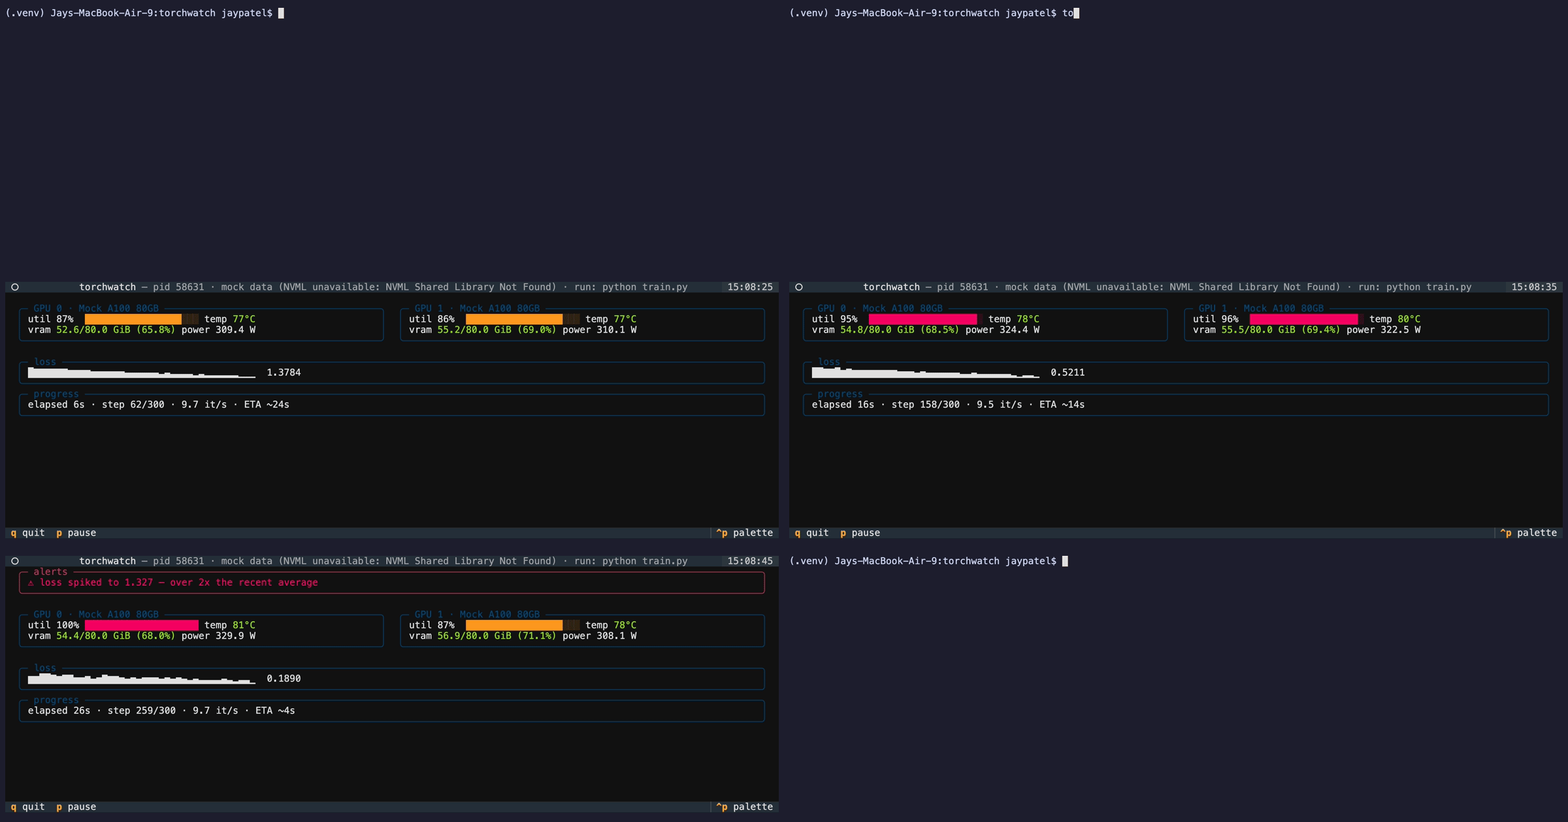
- torchwatch_tui-0.1.0/torchwatch/collector/stream.py +40 -0
- torchwatch_tui-0.1.0/torchwatch/collector/tail.py +130 -0
- torchwatch_tui-0.1.0/torchwatch/collector/wrapper.py +114 -0
- torchwatch_tui-0.1.0/torchwatch/eta.py +69 -0
- torchwatch_tui-0.1.0/torchwatch/widgets/__init__.py +1 -0
- torchwatch_tui-0.1.0/torchwatch/widgets/alert_panel.py +42 -0
- torchwatch_tui-0.1.0/torchwatch/widgets/eta_bar.py +28 -0
- torchwatch_tui-0.1.0/torchwatch/widgets/gpu_panel.py +114 -0
- torchwatch_tui-0.1.0/torchwatch/widgets/sparkline.py +62 -0
|
@@ -0,0 +1,21 @@
|
|
|
1
|
+
MIT License
|
|
2
|
+
|
|
3
|
+
Copyright (c) 2026 Jay Patel
|
|
4
|
+
|
|
5
|
+
Permission is hereby granted, free of charge, to any person obtaining a copy
|
|
6
|
+
of this software and associated documentation files (the "Software"), to deal
|
|
7
|
+
in the Software without restriction, including without limitation the rights
|
|
8
|
+
to use, copy, modify, merge, publish, distribute, sublicense, and/or sell
|
|
9
|
+
copies of the Software, and to permit persons to whom the Software is
|
|
10
|
+
furnished to do so, subject to the following conditions:
|
|
11
|
+
|
|
12
|
+
The above copyright notice and this permission notice shall be included in all
|
|
13
|
+
copies or substantial portions of the Software.
|
|
14
|
+
|
|
15
|
+
THE SOFTWARE IS PROVIDED "AS IS", WITHOUT WARRANTY OF ANY KIND, EXPRESS OR
|
|
16
|
+
IMPLIED, INCLUDING BUT NOT LIMITED TO THE WARRANTIES OF MERCHANTABILITY,
|
|
17
|
+
FITNESS FOR A PARTICULAR PURPOSE AND NONINFRINGEMENT. IN NO EVENT SHALL THE
|
|
18
|
+
AUTHORS OR COPYRIGHT HOLDERS BE LIABLE FOR ANY CLAIM, DAMAGES OR OTHER
|
|
19
|
+
LIABILITY, WHETHER IN AN ACTION OF CONTRACT, TORT OR OTHERWISE, ARISING FROM,
|
|
20
|
+
OUT OF OR IN CONNECTION WITH THE SOFTWARE OR THE USE OR OTHER DEALINGS IN THE
|
|
21
|
+
SOFTWARE.
|
|
@@ -0,0 +1,138 @@
|
|
|
1
|
+
Metadata-Version: 2.4
|
|
2
|
+
Name: torchwatch-tui
|
|
3
|
+
Version: 0.1.0
|
|
4
|
+
Summary: A btop for your PyTorch GPU jobs: live terminal dashboard for training runs
|
|
5
|
+
Project-URL: Homepage, https://github.com/JayPatel095/TorchWatch
|
|
6
|
+
Project-URL: Repository, https://github.com/JayPatel095/TorchWatch
|
|
7
|
+
Project-URL: Issues, https://github.com/JayPatel095/TorchWatch/issues
|
|
8
|
+
Author-email: Jay Patel <jayashish.patel@mail.utoronto.ca>
|
|
9
|
+
License-Expression: MIT
|
|
10
|
+
License-File: LICENSE
|
|
11
|
+
Keywords: gpu,monitoring,pytorch,terminal,training,tui
|
|
12
|
+
Classifier: Development Status :: 3 - Alpha
|
|
13
|
+
Classifier: Environment :: Console
|
|
14
|
+
Classifier: Intended Audience :: Developers
|
|
15
|
+
Classifier: Operating System :: MacOS
|
|
16
|
+
Classifier: Operating System :: POSIX :: Linux
|
|
17
|
+
Classifier: Programming Language :: Python :: 3
|
|
18
|
+
Classifier: Programming Language :: Python :: 3.10
|
|
19
|
+
Classifier: Programming Language :: Python :: 3.11
|
|
20
|
+
Classifier: Programming Language :: Python :: 3.12
|
|
21
|
+
Classifier: Topic :: Scientific/Engineering :: Artificial Intelligence
|
|
22
|
+
Classifier: Topic :: System :: Monitoring
|
|
23
|
+
Requires-Python: >=3.10
|
|
24
|
+
Requires-Dist: click
|
|
25
|
+
Requires-Dist: nvidia-ml-py
|
|
26
|
+
Requires-Dist: psutil
|
|
27
|
+
Requires-Dist: textual
|
|
28
|
+
Provides-Extra: dev
|
|
29
|
+
Requires-Dist: mypy; extra == 'dev'
|
|
30
|
+
Requires-Dist: pytest; extra == 'dev'
|
|
31
|
+
Requires-Dist: ruff; extra == 'dev'
|
|
32
|
+
Description-Content-Type: text/markdown
|
|
33
|
+
|
|
34
|
+
# torchwatch
|
|
35
|
+
|
|
36
|
+
A btop for your PyTorch GPU jobs with live per-GPU utilization, VRAM pressure, training
|
|
37
|
+
throughput, loss curve, and ETA, all in your terminal, with zero code changes.
|
|
38
|
+
|
|
39
|
+
|
|
40
|
+
|
|
41
|
+
## Install
|
|
42
|
+
|
|
43
|
+
```
|
|
44
|
+
pip install torchwatch-tui
|
|
45
|
+
```
|
|
46
|
+
|
|
47
|
+
(The command and package are `torchwatch`; only the PyPI name carries the suffix.)
|
|
48
|
+
|
|
49
|
+
## Run
|
|
50
|
+
|
|
51
|
+
The easiest way is to launch your training command under torchwatch:
|
|
52
|
+
|
|
53
|
+
```
|
|
54
|
+
torchwatch run -- python train.py --epochs 10
|
|
55
|
+
```
|
|
56
|
+
|
|
57
|
+
Your script runs as a child of torchwatch under a pseudo-terminal. Its output is
|
|
58
|
+
parsed live, and quitting the dashboard (`q`) terminates it.
|
|
59
|
+
|
|
60
|
+
Attach to a job that's already running:
|
|
61
|
+
|
|
62
|
+
```
|
|
63
|
+
torchwatch list # list running PyTorch processes
|
|
64
|
+
torchwatch --pid 12345 # attach to one of them
|
|
65
|
+
```
|
|
66
|
+
|
|
67
|
+
Attaching reads the process's stdout via `/proc` (Linux only), and only works when
|
|
68
|
+
stdout is redirected to a file (`python train.py > train.log`). If it isn't,
|
|
69
|
+
torchwatch tells you why and suggests alternatives instead of guessing.
|
|
70
|
+
|
|
71
|
+
Smoke-test the dashboard on synthetic data
|
|
72
|
+
|
|
73
|
+
```
|
|
74
|
+
torchwatch --demo
|
|
75
|
+
```
|
|
76
|
+
|
|
77
|
+
## Current Features
|
|
78
|
+
|
|
79
|
+
- **Per-GPU panels** — utilization, VRAM (used/total and a pressure-colored gauge),
|
|
80
|
+
temperature, and power with one tile per device
|
|
81
|
+
- **Loss sparkline** — scrolling curve of recent loss values
|
|
82
|
+
- **Throughput + ETA** — steps/sec over a rolling window, elapsed time, and a
|
|
83
|
+
time-to-completion estimate through epoch restarts
|
|
84
|
+
- **Alerts area** — appears only when something needs attention, and lingers long
|
|
85
|
+
enough to read:
|
|
86
|
+
- VRAM above 95% on a specific GPU, with concrete fixes (smaller batch size,
|
|
87
|
+
mixed precision, gradient checkpointing)
|
|
88
|
+
- loss stalled (no meaningful change over the last 100 updates)
|
|
89
|
+
- loss spike (latest value far above the recent average)
|
|
90
|
+
|
|
91
|
+
Keys: `q` quit · `p` pause
|
|
92
|
+
|
|
93
|
+
## Supported log formats
|
|
94
|
+
|
|
95
|
+
torchwatch parses training progress straight from stdout with no imports or callbacks.
|
|
96
|
+
Detected automatically:
|
|
97
|
+
|
|
98
|
+
| format | example line |
|
|
99
|
+
|---|---|
|
|
100
|
+
| tqdm | ` 42/500 [00:12<02:15, 3.4it/s, loss=0.693]` |
|
|
101
|
+
| PyTorch Lightning | `Epoch 3/10: 42/500 [... loss=0.693 ...]` |
|
|
102
|
+
| HF Trainer | `{'loss': 0.693, 'learning_rate': 5e-05, 'epoch': 1.2}` |
|
|
103
|
+
| plain | `step 42/500 loss: 0.693` |
|
|
104
|
+
|
|
105
|
+
The header shows which format was detected. Lines that match nothing are ignored.
|
|
106
|
+
|
|
107
|
+
## Notes
|
|
108
|
+
|
|
109
|
+
- GPU stats come from NVML (NVIDIA). Without a usable NVML (e.g. macOS, no driver),
|
|
110
|
+
torchwatch falls back to clearly-labeled mock data so the dashboard still runs.
|
|
111
|
+
- `--pid` attach and process detection use `/proc` and process memory maps, so they
|
|
112
|
+
are Linux-only. `torchwatch run` works everywhere.
|
|
113
|
+
|
|
114
|
+
## Development
|
|
115
|
+
|
|
116
|
+
```
|
|
117
|
+
pip install -e ".[dev]"
|
|
118
|
+
pytest
|
|
119
|
+
ruff check .
|
|
120
|
+
```
|
|
121
|
+
|
|
122
|
+
## Planned
|
|
123
|
+
|
|
124
|
+
Roughly in order of likelihood:
|
|
125
|
+
|
|
126
|
+
- **More alert rules** — NaN/inf loss (the run is dead, say so immediately),
|
|
127
|
+
GPU temperature, sustained throughput drops (often a dataloader bottleneck)
|
|
128
|
+
- **Alert logging** — opt-in `--alert-log alerts.log`: a timestamped record of
|
|
129
|
+
every alert, so a spike at 3am is still explainable at 9am
|
|
130
|
+
- **Configurable thresholds** — `--vram-warn` / `--vram-alert` instead of the
|
|
131
|
+
built-in 85/95
|
|
132
|
+
- **Generic metric sparklines** — track any `key=value` metric your logs already
|
|
133
|
+
print (accuracy, val_loss, grad_norm, …) and chart the ones you pick
|
|
134
|
+
- **Appearance** — theme selection, optional extra GPU stats
|
|
135
|
+
- **Config file** — persistent defaults once the flag count justifies it
|
|
136
|
+
- **Raw output pane** — the wrapped process's actual stdout, scrolling under
|
|
137
|
+
the dashboard
|
|
138
|
+
- **Multi-job dashboard** — one dashboard, several training processes
|
|
@@ -0,0 +1,105 @@
|
|
|
1
|
+
# torchwatch
|
|
2
|
+
|
|
3
|
+
A btop for your PyTorch GPU jobs with live per-GPU utilization, VRAM pressure, training
|
|
4
|
+
throughput, loss curve, and ETA, all in your terminal, with zero code changes.
|
|
5
|
+
|
|
6
|
+

|
|
7
|
+
|
|
8
|
+
## Install
|
|
9
|
+
|
|
10
|
+
```
|
|
11
|
+
pip install torchwatch-tui
|
|
12
|
+
```
|
|
13
|
+
|
|
14
|
+
(The command and package are `torchwatch`; only the PyPI name carries the suffix.)
|
|
15
|
+
|
|
16
|
+
## Run
|
|
17
|
+
|
|
18
|
+
The easiest way is to launch your training command under torchwatch:
|
|
19
|
+
|
|
20
|
+
```
|
|
21
|
+
torchwatch run -- python train.py --epochs 10
|
|
22
|
+
```
|
|
23
|
+
|
|
24
|
+
Your script runs as a child of torchwatch under a pseudo-terminal. Its output is
|
|
25
|
+
parsed live, and quitting the dashboard (`q`) terminates it.
|
|
26
|
+
|
|
27
|
+
Attach to a job that's already running:
|
|
28
|
+
|
|
29
|
+
```
|
|
30
|
+
torchwatch list # list running PyTorch processes
|
|
31
|
+
torchwatch --pid 12345 # attach to one of them
|
|
32
|
+
```
|
|
33
|
+
|
|
34
|
+
Attaching reads the process's stdout via `/proc` (Linux only), and only works when
|
|
35
|
+
stdout is redirected to a file (`python train.py > train.log`). If it isn't,
|
|
36
|
+
torchwatch tells you why and suggests alternatives instead of guessing.
|
|
37
|
+
|
|
38
|
+
Smoke-test the dashboard on synthetic data
|
|
39
|
+
|
|
40
|
+
```
|
|
41
|
+
torchwatch --demo
|
|
42
|
+
```
|
|
43
|
+
|
|
44
|
+
## Current Features
|
|
45
|
+
|
|
46
|
+
- **Per-GPU panels** — utilization, VRAM (used/total and a pressure-colored gauge),
|
|
47
|
+
temperature, and power with one tile per device
|
|
48
|
+
- **Loss sparkline** — scrolling curve of recent loss values
|
|
49
|
+
- **Throughput + ETA** — steps/sec over a rolling window, elapsed time, and a
|
|
50
|
+
time-to-completion estimate through epoch restarts
|
|
51
|
+
- **Alerts area** — appears only when something needs attention, and lingers long
|
|
52
|
+
enough to read:
|
|
53
|
+
- VRAM above 95% on a specific GPU, with concrete fixes (smaller batch size,
|
|
54
|
+
mixed precision, gradient checkpointing)
|
|
55
|
+
- loss stalled (no meaningful change over the last 100 updates)
|
|
56
|
+
- loss spike (latest value far above the recent average)
|
|
57
|
+
|
|
58
|
+
Keys: `q` quit · `p` pause
|
|
59
|
+
|
|
60
|
+
## Supported log formats
|
|
61
|
+
|
|
62
|
+
torchwatch parses training progress straight from stdout with no imports or callbacks.
|
|
63
|
+
Detected automatically:
|
|
64
|
+
|
|
65
|
+
| format | example line |
|
|
66
|
+
|---|---|
|
|
67
|
+
| tqdm | ` 42/500 [00:12<02:15, 3.4it/s, loss=0.693]` |
|
|
68
|
+
| PyTorch Lightning | `Epoch 3/10: 42/500 [... loss=0.693 ...]` |
|
|
69
|
+
| HF Trainer | `{'loss': 0.693, 'learning_rate': 5e-05, 'epoch': 1.2}` |
|
|
70
|
+
| plain | `step 42/500 loss: 0.693` |
|
|
71
|
+
|
|
72
|
+
The header shows which format was detected. Lines that match nothing are ignored.
|
|
73
|
+
|
|
74
|
+
## Notes
|
|
75
|
+
|
|
76
|
+
- GPU stats come from NVML (NVIDIA). Without a usable NVML (e.g. macOS, no driver),
|
|
77
|
+
torchwatch falls back to clearly-labeled mock data so the dashboard still runs.
|
|
78
|
+
- `--pid` attach and process detection use `/proc` and process memory maps, so they
|
|
79
|
+
are Linux-only. `torchwatch run` works everywhere.
|
|
80
|
+
|
|
81
|
+
## Development
|
|
82
|
+
|
|
83
|
+
```
|
|
84
|
+
pip install -e ".[dev]"
|
|
85
|
+
pytest
|
|
86
|
+
ruff check .
|
|
87
|
+
```
|
|
88
|
+
|
|
89
|
+
## Planned
|
|
90
|
+
|
|
91
|
+
Roughly in order of likelihood:
|
|
92
|
+
|
|
93
|
+
- **More alert rules** — NaN/inf loss (the run is dead, say so immediately),
|
|
94
|
+
GPU temperature, sustained throughput drops (often a dataloader bottleneck)
|
|
95
|
+
- **Alert logging** — opt-in `--alert-log alerts.log`: a timestamped record of
|
|
96
|
+
every alert, so a spike at 3am is still explainable at 9am
|
|
97
|
+
- **Configurable thresholds** — `--vram-warn` / `--vram-alert` instead of the
|
|
98
|
+
built-in 85/95
|
|
99
|
+
- **Generic metric sparklines** — track any `key=value` metric your logs already
|
|
100
|
+
print (accuracy, val_loss, grad_norm, …) and chart the ones you pick
|
|
101
|
+
- **Appearance** — theme selection, optional extra GPU stats
|
|
102
|
+
- **Config file** — persistent defaults once the flag count justifies it
|
|
103
|
+
- **Raw output pane** — the wrapped process's actual stdout, scrolling under
|
|
104
|
+
the dashboard
|
|
105
|
+
- **Multi-job dashboard** — one dashboard, several training processes
|
|
@@ -0,0 +1,66 @@
|
|
|
1
|
+
[build-system]
|
|
2
|
+
requires = ["hatchling"]
|
|
3
|
+
build-backend = "hatchling.build"
|
|
4
|
+
|
|
5
|
+
[project]
|
|
6
|
+
# PyPI distribution name; the import package and CLI are still `torchwatch`.
|
|
7
|
+
# (pypi.org/project/torchwatch is an abandoned 0.0.0 placeholder.)
|
|
8
|
+
name = "torchwatch-tui"
|
|
9
|
+
version = "0.1.0"
|
|
10
|
+
description = "A btop for your PyTorch GPU jobs: live terminal dashboard for training runs"
|
|
11
|
+
readme = "README.md"
|
|
12
|
+
requires-python = ">=3.10"
|
|
13
|
+
license = "MIT"
|
|
14
|
+
authors = [
|
|
15
|
+
{ name = "Jay Patel", email = "jayashish.patel@mail.utoronto.ca" },
|
|
16
|
+
]
|
|
17
|
+
keywords = ["pytorch", "gpu", "monitoring", "tui", "terminal", "training"]
|
|
18
|
+
classifiers = [
|
|
19
|
+
"Development Status :: 3 - Alpha",
|
|
20
|
+
"Environment :: Console",
|
|
21
|
+
"Intended Audience :: Developers",
|
|
22
|
+
"Operating System :: POSIX :: Linux",
|
|
23
|
+
"Operating System :: MacOS",
|
|
24
|
+
"Programming Language :: Python :: 3",
|
|
25
|
+
"Programming Language :: Python :: 3.10",
|
|
26
|
+
"Programming Language :: Python :: 3.11",
|
|
27
|
+
"Programming Language :: Python :: 3.12",
|
|
28
|
+
"Topic :: Scientific/Engineering :: Artificial Intelligence",
|
|
29
|
+
"Topic :: System :: Monitoring",
|
|
30
|
+
]
|
|
31
|
+
dependencies = [
|
|
32
|
+
"textual",
|
|
33
|
+
"nvidia-ml-py",
|
|
34
|
+
"psutil",
|
|
35
|
+
"click",
|
|
36
|
+
]
|
|
37
|
+
|
|
38
|
+
[project.urls]
|
|
39
|
+
Homepage = "https://github.com/JayPatel095/TorchWatch"
|
|
40
|
+
Repository = "https://github.com/JayPatel095/TorchWatch"
|
|
41
|
+
Issues = "https://github.com/JayPatel095/TorchWatch/issues"
|
|
42
|
+
|
|
43
|
+
[project.scripts]
|
|
44
|
+
torchwatch = "torchwatch.cli:main"
|
|
45
|
+
|
|
46
|
+
[project.optional-dependencies]
|
|
47
|
+
dev = [
|
|
48
|
+
"ruff",
|
|
49
|
+
"mypy",
|
|
50
|
+
"pytest",
|
|
51
|
+
]
|
|
52
|
+
|
|
53
|
+
[tool.hatch.build.targets.wheel]
|
|
54
|
+
packages = ["torchwatch"]
|
|
55
|
+
|
|
56
|
+
[tool.hatch.build.targets.sdist]
|
|
57
|
+
# Ship the code and tests, not the demo assets or planning docs.
|
|
58
|
+
exclude = ["docs/", "torchwatch_project_brief.md"]
|
|
59
|
+
|
|
60
|
+
[tool.ruff]
|
|
61
|
+
line-length = 100
|
|
62
|
+
target-version = "py310"
|
|
63
|
+
|
|
64
|
+
[tool.mypy]
|
|
65
|
+
python_version = "3.10"
|
|
66
|
+
strict = true
|
|
@@ -0,0 +1,14 @@
|
|
|
1
|
+
# Log fixtures
|
|
2
|
+
|
|
3
|
+
Real or faithful captures of training-log formats the stdout parser must handle.
|
|
4
|
+
|
|
5
|
+
| file | provenance |
|
|
6
|
+
|---|---|
|
|
7
|
+
| `tqdm.log` | **Real capture**: `tqdm==4.x` `trange` with a `loss` postfix, stderr piped to a file (non-tty — exactly what torchwatch sees when attached). Frames are `\r`-separated. |
|
|
8
|
+
| `hf_trainer.log` | Hand-written to match HuggingFace `Trainer` stdout: dict-repr log lines interleaved with bare tqdm progress. The `eval_loss` / `train_loss` lines are traps — they must NOT parse as training loss. |
|
|
9
|
+
| `plain.log` | Hand-written `print()`-style lines, plus one `Loss=` capitalization variant. |
|
|
10
|
+
| `lightning.log` | Hand-written PyTorch Lightning progress lines (Lightning wraps tqdm, hence the resemblance). |
|
|
11
|
+
| `noise.log` | Typical non-metric stdout: warnings, wandb banner, torchvision download note, a metrics dict with no loss. Nothing here should match. |
|
|
12
|
+
|
|
13
|
+
When a real-world format breaks the parser, capture the offending lines into a
|
|
14
|
+
new fixture *first*, then fix the regex against it.
|
|
@@ -0,0 +1,7 @@
|
|
|
1
|
+
0%| | 0/500 [00:00<?, ?it/s]
|
|
2
|
+
{'loss': 2.4915, 'grad_norm': 8.301953315734863, 'learning_rate': 4.95e-05, 'epoch': 0.1}
|
|
3
|
+
10%|█ | 50/500 [00:12<01:52, 4.01it/s]
|
|
4
|
+
{'loss': 1.9847, 'grad_norm': 6.192838191986084, 'learning_rate': 4.85e-05, 'epoch': 0.2}
|
|
5
|
+
{'eval_loss': 1.7523119449615479, 'eval_runtime': 12.4817, 'eval_samples_per_second': 80.117, 'epoch': 1.0}
|
|
6
|
+
100%|██████████| 500/500 [02:05<00:00, 4.00it/s]
|
|
7
|
+
{'train_runtime': 125.9012, 'train_samples_per_second': 79.428, 'train_steps_per_second': 3.972, 'train_loss': 1.8912, 'epoch': 2.0}
|
|
@@ -0,0 +1,5 @@
|
|
|
1
|
+
GPU available: True (cuda), used: True
|
|
2
|
+
Epoch 0/9: 0%| | 0/500 [00:00<?, ?it/s]
|
|
3
|
+
Epoch 0/9: 45%|████▌ | 225/500 [00:05<00:06, 41.72it/s, loss=1.892, v_num=3]
|
|
4
|
+
Epoch 0/9: 100%|██████████| 500/500 [00:12<00:00, 41.20it/s, loss=1.204, v_num=3]
|
|
5
|
+
Epoch 1/9: 60%|██████ | 300/500 [00:07<00:04, 41.55it/s, loss=0.987, v_num=3]
|
|
@@ -0,0 +1,6 @@
|
|
|
1
|
+
/usr/lib/python3/site-packages/torch/cuda/__init__.py:123: UserWarning: CUDA initialization: forked subprocess
|
|
2
|
+
INFO: Using device cuda:0 (NVIDIA A100 80GB)
|
|
3
|
+
wandb: View run at https://wandb.ai/jay/proj/runs/abc123
|
|
4
|
+
Files already downloaded and verified
|
|
5
|
+
{'accuracy': 0.912, 'f1': 0.884}
|
|
6
|
+
Saving checkpoint to ./checkpoints/epoch-1/
|
|
@@ -0,0 +1,6 @@
|
|
|
1
|
+
Starting training with 1000 steps, lr=0.001, batch_size=64
|
|
2
|
+
Step 100/1000 | loss: 0.4230 | lr: 0.001
|
|
3
|
+
Step 200/1000 | loss: 0.3891 | lr: 0.001
|
|
4
|
+
Step 300/1000 | loss: 0.3514 | lr: 0.0009
|
|
5
|
+
Epoch 2 | Step 350/1000 | Loss=0.3312
|
|
6
|
+
Step 400/1000 | loss: 0.3120 | lr: 0.0009
|
|
@@ -0,0 +1 @@
|
|
|
1
|
+
|
|
@@ -0,0 +1,65 @@
|
|
|
1
|
+
"""Acceptance tests for AlertLog: dedup, lingering, and expiry."""
|
|
2
|
+
|
|
3
|
+
from torchwatch.alerts import AlertLog
|
|
4
|
+
|
|
5
|
+
|
|
6
|
+
def test_reported_alert_is_active():
|
|
7
|
+
log = AlertLog(ttl_s=10.0)
|
|
8
|
+
log.report("vram:0", "vram high", now=0.0)
|
|
9
|
+
(alert,) = log.active(now=0.0)
|
|
10
|
+
assert alert.key == "vram:0"
|
|
11
|
+
assert alert.message == "vram high"
|
|
12
|
+
assert alert.first_seen == 0.0
|
|
13
|
+
assert alert.last_seen == 0.0
|
|
14
|
+
|
|
15
|
+
|
|
16
|
+
def test_empty_log_has_no_active_alerts():
|
|
17
|
+
assert AlertLog().active(now=100.0) == []
|
|
18
|
+
|
|
19
|
+
|
|
20
|
+
def test_rereport_dedups_by_key():
|
|
21
|
+
log = AlertLog(ttl_s=10.0)
|
|
22
|
+
log.report("vram:0", "vram at 95.1%", now=0.0)
|
|
23
|
+
log.report("vram:0", "vram at 96.4%", now=1.0)
|
|
24
|
+
(alert,) = log.active(now=1.0)
|
|
25
|
+
assert alert.message == "vram at 96.4%" # latest numbers win
|
|
26
|
+
assert alert.first_seen == 0.0 # but the alert is still the same event
|
|
27
|
+
assert alert.last_seen == 1.0
|
|
28
|
+
|
|
29
|
+
|
|
30
|
+
def test_alert_lingers_after_condition_stops():
|
|
31
|
+
log = AlertLog(ttl_s=10.0)
|
|
32
|
+
log.report("spike", "loss spike", now=0.0)
|
|
33
|
+
assert len(log.active(now=5.0)) == 1 # condition gone, still readable
|
|
34
|
+
assert len(log.active(now=10.0)) == 1 # boundary: now - last_seen == ttl
|
|
35
|
+
|
|
36
|
+
|
|
37
|
+
def test_alert_expires_after_ttl():
|
|
38
|
+
log = AlertLog(ttl_s=10.0)
|
|
39
|
+
log.report("spike", "loss spike", now=0.0)
|
|
40
|
+
assert log.active(now=10.1) == []
|
|
41
|
+
|
|
42
|
+
|
|
43
|
+
def test_rereport_refreshes_lifespan():
|
|
44
|
+
log = AlertLog(ttl_s=10.0)
|
|
45
|
+
log.report("stall", "loss stalled", now=0.0)
|
|
46
|
+
log.report("stall", "loss stalled", now=8.0)
|
|
47
|
+
assert len(log.active(now=15.0)) == 1 # 15 - 8 = 7 < ttl
|
|
48
|
+
assert log.active(now=18.1) == []
|
|
49
|
+
|
|
50
|
+
|
|
51
|
+
def test_active_orders_by_first_seen():
|
|
52
|
+
log = AlertLog(ttl_s=100.0)
|
|
53
|
+
log.report("b-later-refire", "b", now=0.0)
|
|
54
|
+
log.report("a-newcomer", "a", now=1.0)
|
|
55
|
+
log.report("b-later-refire", "b", now=2.0) # re-fire must not reorder
|
|
56
|
+
assert [a.key for a in log.active(now=2.0)] == ["b-later-refire", "a-newcomer"]
|
|
57
|
+
|
|
58
|
+
|
|
59
|
+
def test_expired_alert_can_fire_again_as_new():
|
|
60
|
+
log = AlertLog(ttl_s=10.0)
|
|
61
|
+
log.report("spike", "loss spike", now=0.0)
|
|
62
|
+
assert log.active(now=50.0) == [] # long gone
|
|
63
|
+
log.report("spike", "loss spike again", now=50.0)
|
|
64
|
+
(alert,) = log.active(now=50.0)
|
|
65
|
+
assert alert.first_seen == 50.0 # a fresh event, not the old one revived
|
|
@@ -0,0 +1,145 @@
|
|
|
1
|
+
"""Alerts must flow from the rules through the AlertLog into the alerts area."""
|
|
2
|
+
|
|
3
|
+
import asyncio
|
|
4
|
+
|
|
5
|
+
from textual.app import App
|
|
6
|
+
|
|
7
|
+
from torchwatch.alerts import Alert
|
|
8
|
+
from torchwatch.app import TorchwatchApp
|
|
9
|
+
from torchwatch.collector.nvidia import GiB, GpuSample
|
|
10
|
+
from torchwatch.collector.stdout import TrainingUpdate
|
|
11
|
+
from torchwatch.widgets.alert_panel import AlertPanel
|
|
12
|
+
from torchwatch.widgets.gpu_panel import GpuPanel
|
|
13
|
+
|
|
14
|
+
|
|
15
|
+
def _sample(vram_pct: float) -> GpuSample:
|
|
16
|
+
total = 80 * GiB
|
|
17
|
+
return GpuSample(
|
|
18
|
+
index=0,
|
|
19
|
+
name="Fake A100",
|
|
20
|
+
utilization_pct=50,
|
|
21
|
+
vram_used_bytes=int(total * vram_pct / 100),
|
|
22
|
+
vram_total_bytes=total,
|
|
23
|
+
temperature_c=60,
|
|
24
|
+
power_w=250.0,
|
|
25
|
+
)
|
|
26
|
+
|
|
27
|
+
|
|
28
|
+
class FakeCollector:
|
|
29
|
+
"""Always reports the same sample, so alert conditions are deterministic."""
|
|
30
|
+
|
|
31
|
+
is_mock = True
|
|
32
|
+
|
|
33
|
+
def __init__(self, vram_pct: float) -> None:
|
|
34
|
+
self._vram_pct = vram_pct
|
|
35
|
+
|
|
36
|
+
def gpu_count(self) -> int:
|
|
37
|
+
return 1
|
|
38
|
+
|
|
39
|
+
def sample(self) -> list[GpuSample]:
|
|
40
|
+
return [_sample(self._vram_pct)]
|
|
41
|
+
|
|
42
|
+
|
|
43
|
+
class ScriptedSource:
|
|
44
|
+
"""Replays a fixed list of losses, then goes quiet."""
|
|
45
|
+
|
|
46
|
+
label = "scripted"
|
|
47
|
+
interval_s = 0.01
|
|
48
|
+
|
|
49
|
+
def __init__(self, losses: list[float]) -> None:
|
|
50
|
+
self._updates = [
|
|
51
|
+
TrainingUpdate(step=i + 1, total_steps=len(losses), loss=loss, format_name="plain")
|
|
52
|
+
for i, loss in enumerate(losses)
|
|
53
|
+
]
|
|
54
|
+
|
|
55
|
+
def next_update(self) -> TrainingUpdate | None:
|
|
56
|
+
return self._updates.pop(0) if self._updates else None
|
|
57
|
+
|
|
58
|
+
def close(self) -> None:
|
|
59
|
+
pass
|
|
60
|
+
|
|
61
|
+
|
|
62
|
+
class PanelHarness(App[None]):
|
|
63
|
+
def compose(self):
|
|
64
|
+
yield AlertPanel(id="alert-panel")
|
|
65
|
+
|
|
66
|
+
|
|
67
|
+
def test_alert_panel_hidden_when_empty():
|
|
68
|
+
async def scenario() -> None:
|
|
69
|
+
app = PanelHarness()
|
|
70
|
+
async with app.run_test(size=(120, 20)) as pilot:
|
|
71
|
+
panel = app.query_one(AlertPanel)
|
|
72
|
+
assert panel.display is False # collapsed from the start
|
|
73
|
+
|
|
74
|
+
panel.show_alerts(
|
|
75
|
+
[Alert(key="k", message="something bad", first_seen=0.0, last_seen=0.0)]
|
|
76
|
+
)
|
|
77
|
+
await pilot.pause()
|
|
78
|
+
assert panel.display is True
|
|
79
|
+
assert "something bad" in str(panel.render())
|
|
80
|
+
|
|
81
|
+
panel.show_alerts([])
|
|
82
|
+
await pilot.pause()
|
|
83
|
+
assert panel.display is False
|
|
84
|
+
|
|
85
|
+
asyncio.run(scenario())
|
|
86
|
+
|
|
87
|
+
|
|
88
|
+
async def _wait_for_alert(app: TorchwatchApp, pilot, needle: str) -> str:
|
|
89
|
+
for _ in range(60):
|
|
90
|
+
await pilot.pause(0.05)
|
|
91
|
+
panel = app.query_one("#alert-panel", AlertPanel)
|
|
92
|
+
rendered = str(panel.render())
|
|
93
|
+
if panel.display and needle in rendered.lower():
|
|
94
|
+
return rendered
|
|
95
|
+
raise AssertionError(f"no active alert containing {needle!r} ever appeared")
|
|
96
|
+
|
|
97
|
+
|
|
98
|
+
def test_vram_alert_reaches_alert_panel():
|
|
99
|
+
async def scenario() -> None:
|
|
100
|
+
app = TorchwatchApp(poll_ms=25, collector=FakeCollector(vram_pct=97.0))
|
|
101
|
+
async with app.run_test(size=(120, 30)) as pilot:
|
|
102
|
+
rendered = await _wait_for_alert(app, pilot, "batch")
|
|
103
|
+
assert "vram" in rendered.lower()
|
|
104
|
+
assert "gpu 0" in rendered.lower() # says WHICH gpu is under pressure
|
|
105
|
+
# the suggestion lives in the alerts area now, not the GPU panel
|
|
106
|
+
gpu_text = str(app.query_one(GpuPanel).render())
|
|
107
|
+
assert "batch" not in gpu_text.lower()
|
|
108
|
+
|
|
109
|
+
asyncio.run(scenario())
|
|
110
|
+
|
|
111
|
+
|
|
112
|
+
def test_healthy_vram_raises_no_alert():
|
|
113
|
+
async def scenario() -> None:
|
|
114
|
+
app = TorchwatchApp(poll_ms=25, collector=FakeCollector(vram_pct=60.0))
|
|
115
|
+
async with app.run_test(size=(120, 30)) as pilot:
|
|
116
|
+
await pilot.pause(0.5)
|
|
117
|
+
assert app.query_one("#alert-panel", AlertPanel).display is False
|
|
118
|
+
|
|
119
|
+
asyncio.run(scenario())
|
|
120
|
+
|
|
121
|
+
|
|
122
|
+
def test_loss_spike_reaches_alert_panel():
|
|
123
|
+
async def scenario() -> None:
|
|
124
|
+
app = TorchwatchApp(
|
|
125
|
+
poll_ms=200,
|
|
126
|
+
collector=FakeCollector(vram_pct=50.0),
|
|
127
|
+
metrics_source=ScriptedSource([1.0] * 19 + [2.5]),
|
|
128
|
+
)
|
|
129
|
+
async with app.run_test(size=(120, 30)) as pilot:
|
|
130
|
+
await _wait_for_alert(app, pilot, "spike")
|
|
131
|
+
|
|
132
|
+
asyncio.run(scenario())
|
|
133
|
+
|
|
134
|
+
|
|
135
|
+
def test_loss_stall_reaches_alert_panel():
|
|
136
|
+
async def scenario() -> None:
|
|
137
|
+
app = TorchwatchApp(
|
|
138
|
+
poll_ms=200,
|
|
139
|
+
collector=FakeCollector(vram_pct=50.0),
|
|
140
|
+
metrics_source=ScriptedSource([0.5] * 100),
|
|
141
|
+
)
|
|
142
|
+
async with app.run_test(size=(120, 30)) as pilot:
|
|
143
|
+
await _wait_for_alert(app, pilot, "stall")
|
|
144
|
+
|
|
145
|
+
asyncio.run(scenario())
|
|
@@ -0,0 +1,49 @@
|
|
|
1
|
+
"""Acceptance tests for alert rules."""
|
|
2
|
+
|
|
3
|
+
from torchwatch.alerts import is_spiking, is_stalled, vram_suggestion
|
|
4
|
+
|
|
5
|
+
|
|
6
|
+
def test_no_suggestion_below_alert_threshold():
|
|
7
|
+
assert vram_suggestion(50.0) is None
|
|
8
|
+
assert vram_suggestion(94.9) is None # warn zone colors, but no nagging
|
|
9
|
+
|
|
10
|
+
|
|
11
|
+
def test_suggestion_at_alert_threshold():
|
|
12
|
+
hint = vram_suggestion(95.0)
|
|
13
|
+
assert hint is not None
|
|
14
|
+
lowered = hint.lower()
|
|
15
|
+
assert "batch" in lowered # cheapest fix must be mentioned
|
|
16
|
+
assert "amp" in lowered or "precision" in lowered
|
|
17
|
+
assert "checkpoint" in lowered
|
|
18
|
+
|
|
19
|
+
|
|
20
|
+
def test_flat_loss_stalls():
|
|
21
|
+
assert is_stalled([1.0] * 100)
|
|
22
|
+
|
|
23
|
+
|
|
24
|
+
def test_stall_needs_a_full_window():
|
|
25
|
+
assert not is_stalled([1.0] * 99)
|
|
26
|
+
assert not is_stalled([])
|
|
27
|
+
|
|
28
|
+
|
|
29
|
+
def test_improving_loss_is_not_stalled():
|
|
30
|
+
losses = [1.0 - 0.005 * i for i in range(100)]
|
|
31
|
+
assert not is_stalled(losses)
|
|
32
|
+
|
|
33
|
+
|
|
34
|
+
def test_stall_looks_only_at_recent_window():
|
|
35
|
+
# improved long ago, flat for the last 100 → stalled
|
|
36
|
+
losses = [2.0 - 0.01 * i for i in range(100)] + [0.5] * 100
|
|
37
|
+
assert is_stalled(losses)
|
|
38
|
+
|
|
39
|
+
|
|
40
|
+
def test_spike_detected():
|
|
41
|
+
assert is_spiking([1.0] * 19 + [2.5])
|
|
42
|
+
|
|
43
|
+
|
|
44
|
+
def test_steady_loss_no_spike():
|
|
45
|
+
assert not is_spiking([1.0] * 20)
|
|
46
|
+
|
|
47
|
+
|
|
48
|
+
def test_spike_needs_a_full_window():
|
|
49
|
+
assert not is_spiking([1.0, 5.0])
|