tipbox 0.1.0__tar.gz
This diff represents the content of publicly available package versions that have been released to one of the supported registries. The information contained in this diff is provided for informational purposes only and reflects changes between package versions as they appear in their respective public registries.
- tipbox-0.1.0/LICENSE +21 -0
- tipbox-0.1.0/PKG-INFO +200 -0
- tipbox-0.1.0/README.md +175 -0
- tipbox-0.1.0/pyproject.toml +38 -0
- tipbox-0.1.0/setup.cfg +4 -0
- tipbox-0.1.0/tipbox/__init__.py +13 -0
- tipbox-0.1.0/tipbox/_amoc.py +126 -0
- tipbox-0.1.0/tipbox/bifurcation/__init__.py +0 -0
- tipbox-0.1.0/tipbox/bifurcation/amoc.py +307 -0
- tipbox-0.1.0/tipbox/bifurcation/bifurcation_simulator.py +140 -0
- tipbox-0.1.0/tipbox/bifurcation/may_harvesting.py +309 -0
- tipbox-0.1.0/tipbox/bifurcation/ricker.py +110 -0
- tipbox-0.1.0/tipbox/bifurcation/rosenzweig_macarthur.py +417 -0
- tipbox-0.1.0/tipbox/bifurcation/seirx.py +355 -0
- tipbox-0.1.0/tipbox/bifurcation/thermoacoustic.py +144 -0
- tipbox-0.1.0/tipbox/datasets/__init__.py +22 -0
- tipbox-0.1.0/tipbox/datasets/_cache.py +53 -0
- tipbox-0.1.0/tipbox/datasets/benchmarks.py +196 -0
- tipbox-0.1.0/tipbox/datasets/empirical.py +236 -0
- tipbox-0.1.0/tipbox/datasets/microcosm.py +87 -0
- tipbox-0.1.0/tipbox/generate.py +107 -0
- tipbox-0.1.0/tipbox/indicators.py +193 -0
- tipbox-0.1.0/tipbox/metrics.py +183 -0
- tipbox-0.1.0/tipbox/models.py +65 -0
- tipbox-0.1.0/tipbox/rate/__init__.py +0 -0
- tipbox-0.1.0/tipbox/rate/amoc.py +252 -0
- tipbox-0.1.0/tipbox/rate/bautin.py +261 -0
- tipbox-0.1.0/tipbox/rate/compost_bomb.py +265 -0
- tipbox-0.1.0/tipbox/rate/rate_simulator.py +155 -0
- tipbox-0.1.0/tipbox/rate/saddle_node.py +217 -0
- tipbox-0.1.0/tipbox/registry.py +206 -0
- tipbox-0.1.0/tipbox/types.py +320 -0
- tipbox-0.1.0/tipbox/utils.py +100 -0
- tipbox-0.1.0/tipbox.egg-info/PKG-INFO +200 -0
- tipbox-0.1.0/tipbox.egg-info/SOURCES.txt +36 -0
- tipbox-0.1.0/tipbox.egg-info/dependency_links.txt +1 -0
- tipbox-0.1.0/tipbox.egg-info/requires.txt +10 -0
- tipbox-0.1.0/tipbox.egg-info/top_level.txt +1 -0
tipbox-0.1.0/LICENSE
ADDED
|
@@ -0,0 +1,21 @@
|
|
|
1
|
+
MIT License
|
|
2
|
+
|
|
3
|
+
Copyright (c) 2026 Juan Nathaniel
|
|
4
|
+
|
|
5
|
+
Permission is hereby granted, free of charge, to any person obtaining a copy
|
|
6
|
+
of this software and associated documentation files (the "Software"), to deal
|
|
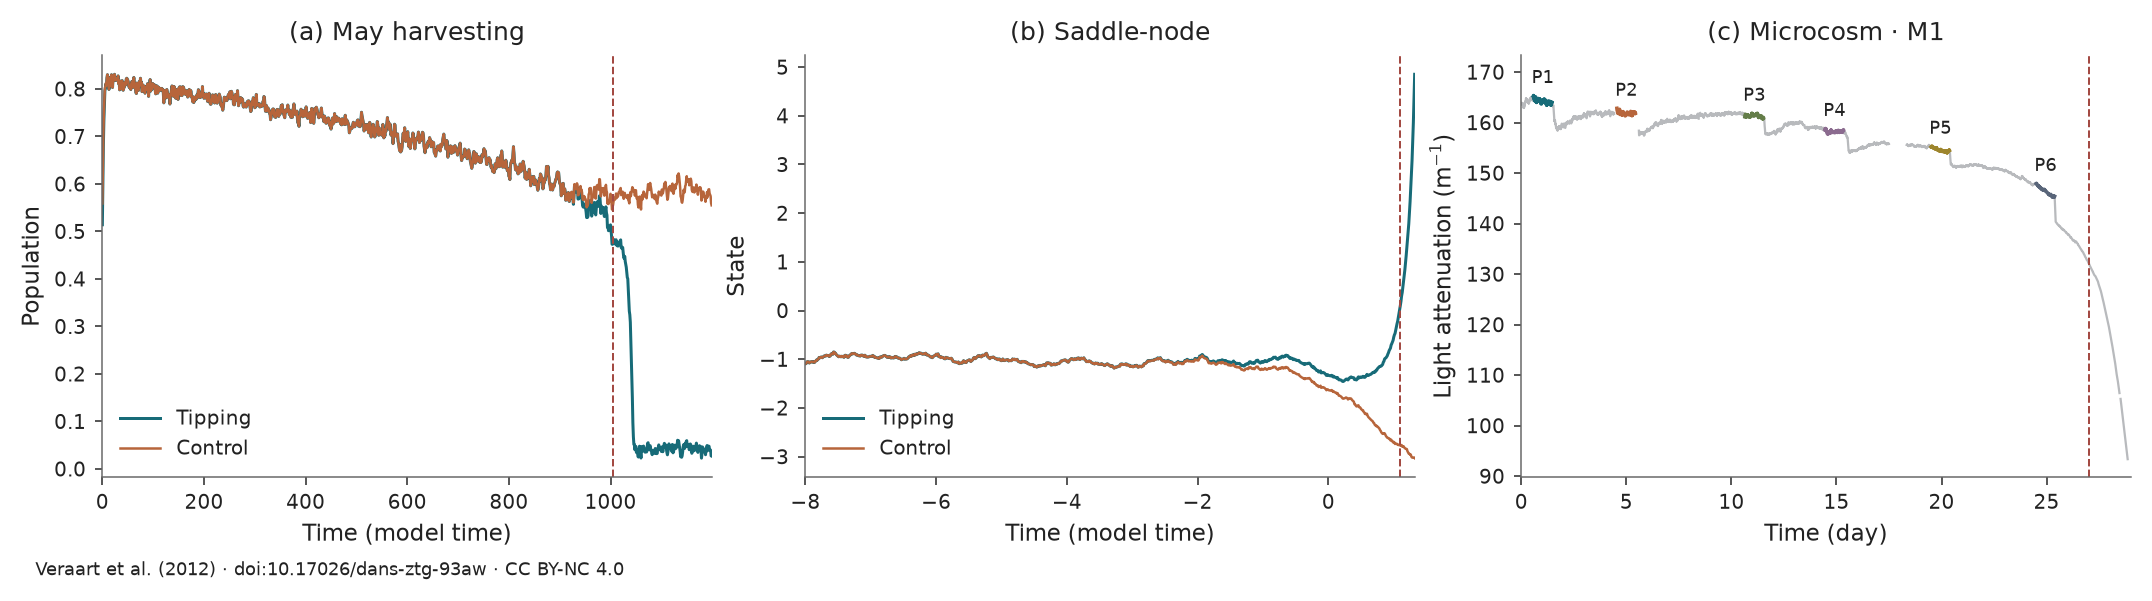
7
|
+
in the Software without restriction, including without limitation the rights
|
|
8
|
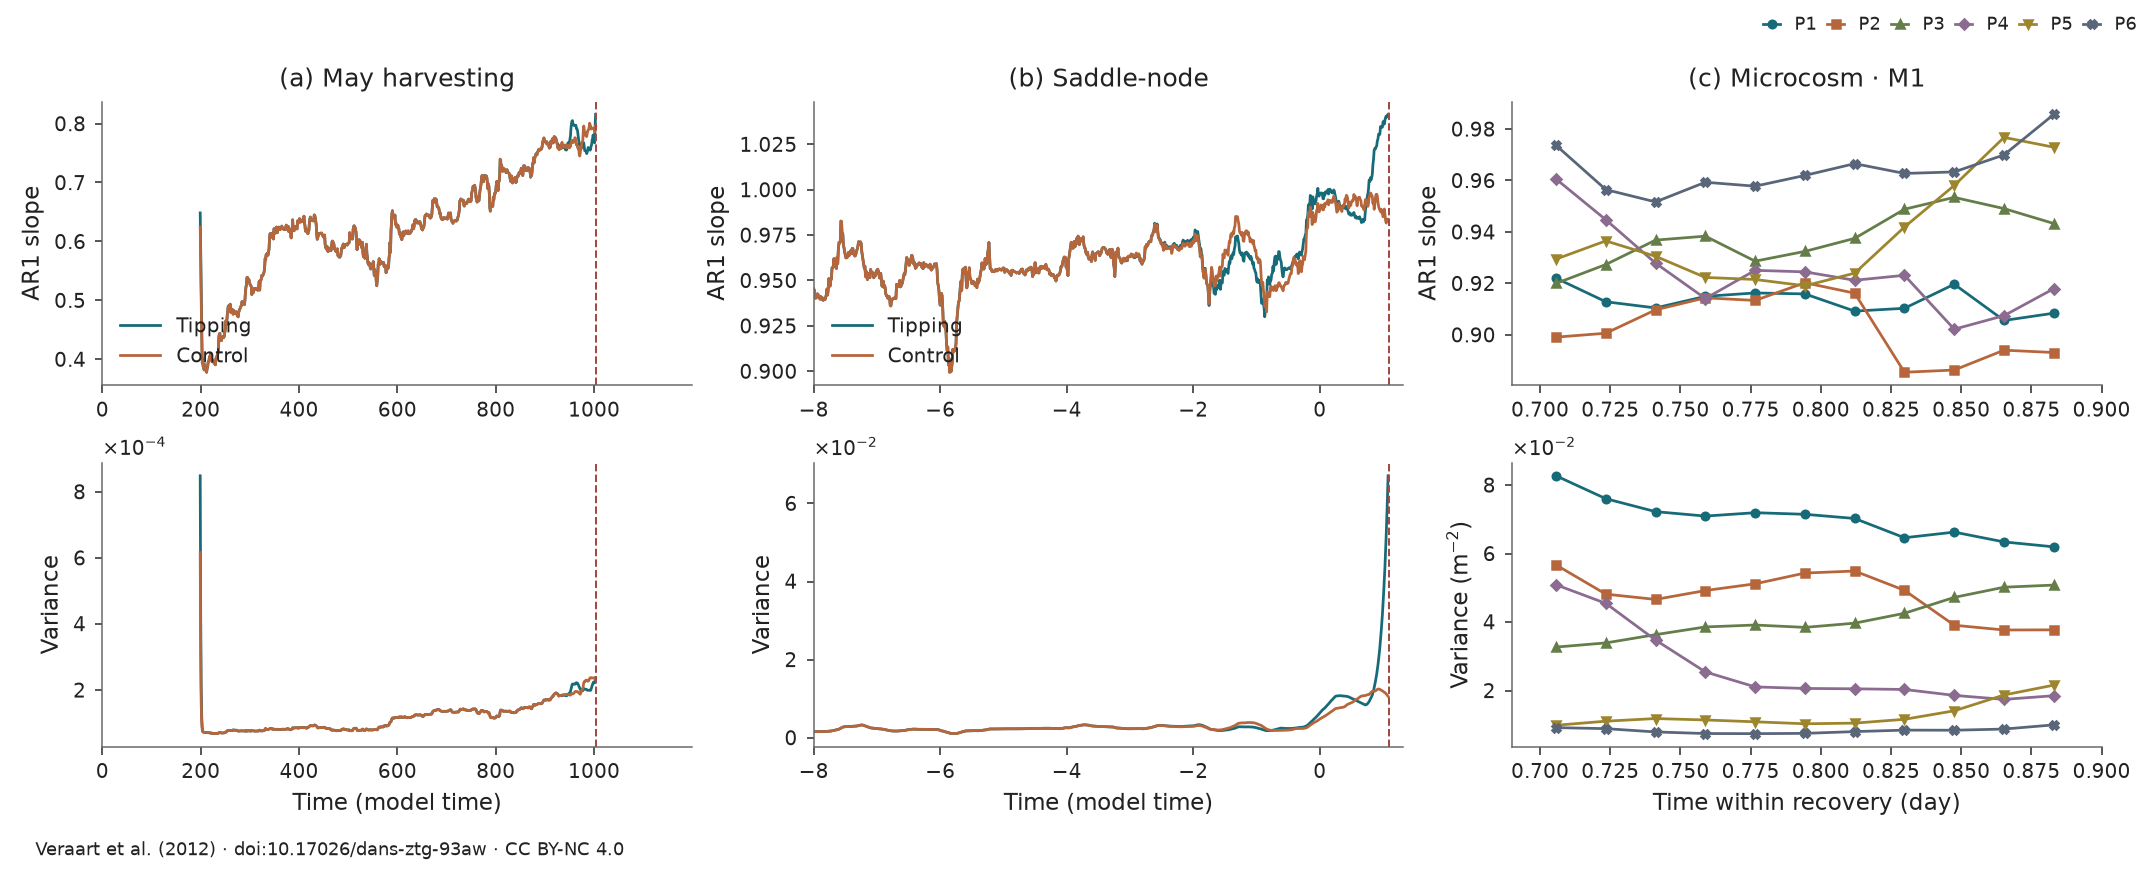
+
to use, copy, modify, merge, publish, distribute, sublicense, and/or sell
|
|
9
|
+
copies of the Software, and to permit persons to whom the Software is
|
|
10
|
+
furnished to do so, subject to the following conditions:
|
|
11
|
+
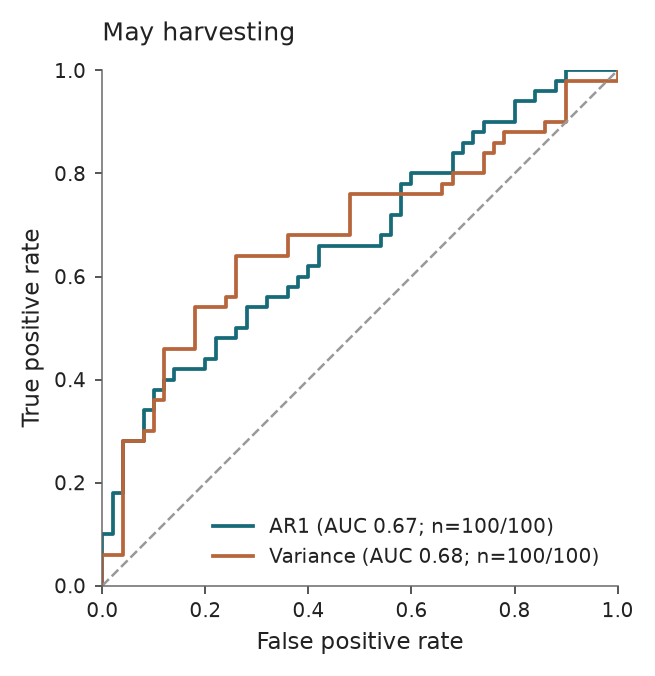
|
|
12
|
+
The above copyright notice and this permission notice shall be included in all
|
|
13
|
+
copies or substantial portions of the Software.
|
|
14
|
+
|
|
15
|
+
THE SOFTWARE IS PROVIDED "AS IS", WITHOUT WARRANTY OF ANY KIND, EXPRESS OR
|
|
16
|
+
IMPLIED, INCLUDING BUT NOT LIMITED TO THE WARRANTIES OF MERCHANTABILITY,
|
|
17
|
+
FITNESS FOR A PARTICULAR PURPOSE AND NONINFRINGEMENT. IN NO EVENT SHALL THE
|
|
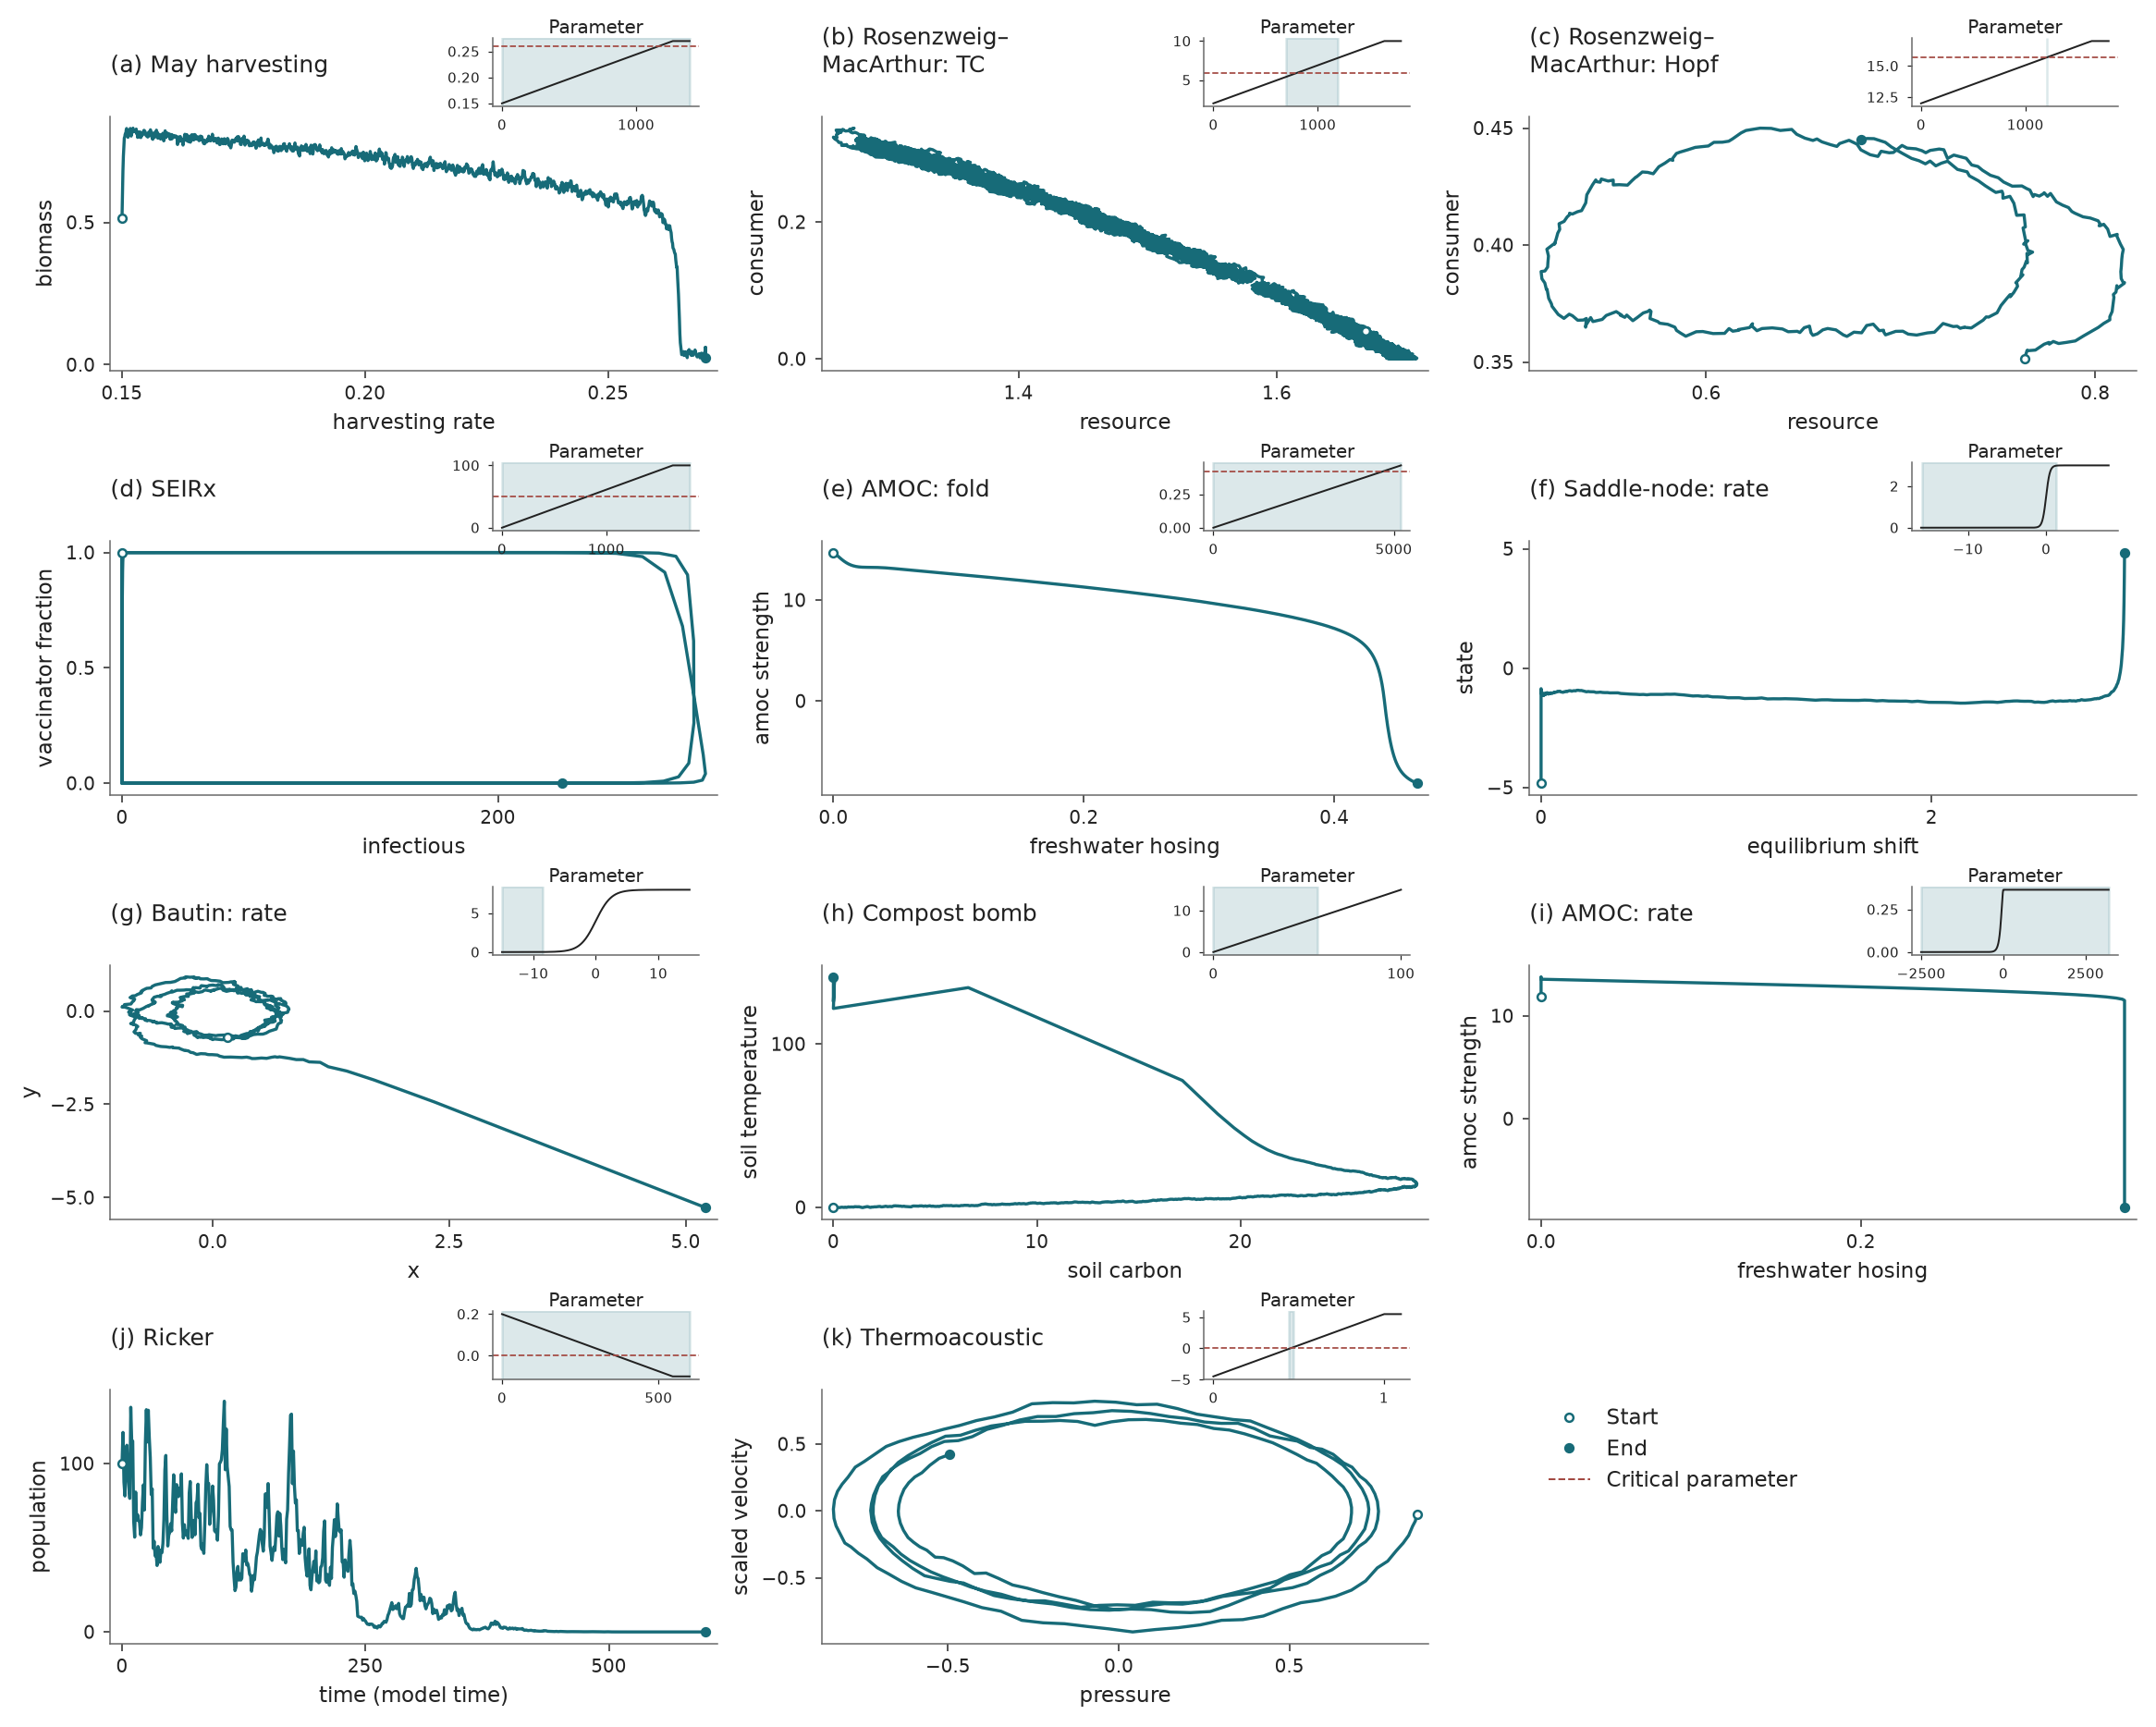
18
|
+
AUTHORS OR COPYRIGHT HOLDERS BE LIABLE FOR ANY CLAIM, DAMAGES OR OTHER
|
|
19
|
+
LIABILITY, WHETHER IN AN ACTION OF CONTRACT, TORT OR OTHERWISE, ARISING FROM,
|
|
20
|
+
OUT OF OR IN CONNECTION WITH THE SOFTWARE OR THE USE OR OTHER DEALINGS IN THE
|
|
21
|
+
SOFTWARE.
|
tipbox-0.1.0/PKG-INFO
ADDED
|
@@ -0,0 +1,200 @@
|
|
|
1
|
+
Metadata-Version: 2.4
|
|
2
|
+
Name: tipbox
|
|
3
|
+
Version: 0.1.0
|
|
4
|
+
Summary: Stochastic tipping models, empirical observations, and early-warning benchmarks
|
|
5
|
+
Author-email: Juan Nathaniel <jn2808@columbia.edu>
|
|
6
|
+
License-Expression: MIT
|
|
7
|
+
Project-URL: Homepage, https://github.com/juannat7/tipbox
|
|
8
|
+
Project-URL: Documentation, https://juannat7.github.io/tipbox/
|
|
9
|
+
Project-URL: Issues, https://github.com/juannat7/tipbox/issues
|
|
10
|
+
Classifier: Programming Language :: Python :: 3
|
|
11
|
+
Classifier: Operating System :: OS Independent
|
|
12
|
+
Requires-Python: >=3.10
|
|
13
|
+
Description-Content-Type: text/markdown
|
|
14
|
+
License-File: LICENSE
|
|
15
|
+
Requires-Dist: jax
|
|
16
|
+
Requires-Dist: jaxlib
|
|
17
|
+
Requires-Dist: numpy
|
|
18
|
+
Requires-Dist: scipy
|
|
19
|
+
Requires-Dist: matplotlib
|
|
20
|
+
Provides-Extra: docs
|
|
21
|
+
Requires-Dist: sphinx<9,>=7; extra == "docs"
|
|
22
|
+
Requires-Dist: furo>=2024.8.6; extra == "docs"
|
|
23
|
+
Requires-Dist: sphinx-copybutton>=0.5; extra == "docs"
|
|
24
|
+
Dynamic: license-file
|
|
25
|
+
|
|
26
|
+
# <img src="https://raw.githubusercontent.com/juannat7/tipbox/main/docs/tipbox-icon-300ppi.png" alt="" width="48" height="48" align="absmiddle"> TipBox
|
|
27
|
+
|
|
28
|
+
TipBox is a collection of tipping models and empirical observations. It covers bifurcation- and rate-induced tipping in stochastic systems, with early-warning indicators such as lag-1 autocorrelation and variance.
|
|
29
|
+
|
|
30
|
+
<div align="center">
|
|
31
|
+
|
|
32
|
+
[](https://www.python.org/)
|
|
33
|
+
[](https://pypi.org/project/tipbox/)
|
|
34
|
+
[](https://pepy.tech/projects/tipbox)
|
|
35
|
+
[](https://juannat7.github.io/tipbox/)
|
|
36
|
+
[](https://github.com/juannat7/tipbox/blob/main/LICENSE)
|
|
37
|
+
|
|
38
|
+
</div>
|
|
39
|
+
|
|
40
|
+
## Contents
|
|
41
|
+
|
|
42
|
+
- [Installation](#installation)
|
|
43
|
+
- [Generate or load a time series](#generate-or-load-a-time-series)
|
|
44
|
+
- [Early-warning indicators](#compute-early-warning-indicators)
|
|
45
|
+
- [Benchmarking](#benchmarking)
|
|
46
|
+
- [Systems](#systems)
|
|
47
|
+
- [Notebook examples](#notebook-examples)
|
|
48
|
+
- [Used in research](#used-in-research)
|
|
49
|
+
- [Citation](#citation)
|
|
50
|
+
|
|
51
|
+
## Installation
|
|
52
|
+
|
|
53
|
+
```bash
|
|
54
|
+
pip install tipbox
|
|
55
|
+
```
|
|
56
|
+
|
|
57
|
+
For development, clone this repository and run `pip install -e .`.
|
|
58
|
+
|
|
59
|
+
## Generate or load a time series
|
|
60
|
+
|
|
61
|
+
TipBox provides a common interface to simulate tipping systems and load observations. See the [system collection](#systems) for available models and their documentation.
|
|
62
|
+
|
|
63
|
+
```python
|
|
64
|
+
from tipbox.models import MayHarvesting, SaddleNode
|
|
65
|
+
from tipbox.datasets import Microcosm
|
|
66
|
+
|
|
67
|
+
# Bifurcation-induced tipping
|
|
68
|
+
harvesting = MayHarvesting()
|
|
69
|
+
bifurcation = harvesting.make_trajectory(num_samples=1200, noise=1.0, seed=43)
|
|
70
|
+
bifurcation_control = harvesting.make_trajectory(num_samples=1200, noise=1.0, seed=43, null_simulation=True)
|
|
71
|
+
|
|
72
|
+
# Rate-induced tipping
|
|
73
|
+
rate_model = SaddleNode(epsilon=1.4)
|
|
74
|
+
rate = rate_model.make_trajectory(num_samples=2401, noise=0.01, seed=43)
|
|
75
|
+
rate_control = rate_model.make_trajectory(num_samples=2401, noise=0.01, seed=43, null_simulation=True)
|
|
76
|
+
|
|
77
|
+
# Empirical observations: Veraart et al. (2012), chemostats M1 and M2.
|
|
78
|
+
observed = Microcosm().load()
|
|
79
|
+
```
|
|
80
|
+
|
|
81
|
+
Simulation results contain `time` and `trajectory` arrays; loaded observations contain `time` and `observations`. Equations, parameters, and simulation controls are in the [documentation](https://juannat7.github.io/tipbox/usage.html).
|
|
82
|
+
|
|
83
|
+
|
|
84
|
+
|
|
85
|
+
Empirical panels: [CC BY-NC 4.0](https://github.com/juannat7/tipbox/blob/main/docs/_static/figures/LICENSE.md).
|
|
86
|
+
|
|
87
|
+
## Compute early-warning indicators
|
|
88
|
+
|
|
89
|
+
Choose an observable and apply a trailing-window statistic before the fold:
|
|
90
|
+
|
|
91
|
+
```python
|
|
92
|
+
from tipbox.indicators import rolling_ar1, rolling_variance
|
|
93
|
+
|
|
94
|
+
before_fold = bifurcation.param_values < harvesting.critical_parameter
|
|
95
|
+
signal = bifurcation.trajectory[before_fold, 0]
|
|
96
|
+
|
|
97
|
+
# Get early warning signals
|
|
98
|
+
ar1 = rolling_ar1(signal, window=200, detrend="linear")
|
|
99
|
+
variance = rolling_variance(signal, window=200, detrend="linear")
|
|
100
|
+
```
|
|
101
|
+
|
|
102
|
+
The [indicator reference](https://juannat7.github.io/tipbox/indicators.html) also covers autocorrelation, skewness, and kurtosis.
|
|
103
|
+
|
|
104
|
+
|
|
105
|
+
|
|
106
|
+
## Benchmarking
|
|
107
|
+
|
|
108
|
+
Evaluate indicator trends on tipping and control trajectories with the area under the ROC curve (AUROC). Each trajectory contributes one score.
|
|
109
|
+
|
|
110
|
+
### Generate a batch
|
|
111
|
+
|
|
112
|
+
Batches support repeated experiments and indicator comparisons:
|
|
113
|
+
|
|
114
|
+
```python
|
|
115
|
+
from tipbox.models import MayHarvesting
|
|
116
|
+
from tipbox.datasets import generate_dataset
|
|
117
|
+
from tipbox.indicators import rolling_ar1, rolling_variance
|
|
118
|
+
from tipbox.metrics import ensemble_roc, plot_roc
|
|
119
|
+
|
|
120
|
+
# 50 tipping trajectories + 50 controls; retain 300 samples before each tipping threshold.
|
|
121
|
+
batch = generate_dataset(
|
|
122
|
+
MayHarvesting(), num_tipping=50, num_controls=50, num_samples=1000,
|
|
123
|
+
context_samples=300, noise=1.0, seed=43,
|
|
124
|
+
)
|
|
125
|
+
signals = batch.observations[:, :, 0] # First observed variable in each trajectory.
|
|
126
|
+
indicators = {
|
|
127
|
+
"AR1": [rolling_ar1(x, window=100, detrend="linear") for x in signals],
|
|
128
|
+
"Variance": [rolling_variance(x, window=100, detrend="linear") for x in signals],
|
|
129
|
+
}
|
|
130
|
+
```
|
|
131
|
+
|
|
132
|
+
Score the indicator trend in each trajectory and plot the ROC curves:
|
|
133
|
+
|
|
134
|
+
```python
|
|
135
|
+
report = ensemble_roc(batch.labels, indicators) # Labels: 0 control, 1 tipping.
|
|
136
|
+
ax = plot_roc(report)
|
|
137
|
+
```
|
|
138
|
+
|
|
139
|
+
|
|
140
|
+
|
|
141
|
+
See the [benchmark guide](https://juannat7.github.io/tipbox/benchmarks.html) for labels, trend scores, and evaluation conventions.
|
|
142
|
+
|
|
143
|
+
## Systems
|
|
144
|
+
|
|
145
|
+
Import model classes from `tipbox.models` and observation classes from `tipbox.datasets`.
|
|
146
|
+
Model links include equations and defaults; observation links describe `.load()`.
|
|
147
|
+
|
|
148
|
+
| System | Class / call | Mechanism / observable |
|
|
149
|
+
|---|---|---|
|
|
150
|
+
| **Models** | | |
|
|
151
|
+
| [May harvesting](https://juannat7.github.io/tipbox/models/harvesting.html) | `MayHarvesting` | Fold |
|
|
152
|
+
| [Rosenzweig–MacArthur](https://juannat7.github.io/tipbox/models/consumer_resource.html) | `RosenzweigMacArthur` | Transcritical / Hopf |
|
|
153
|
+
| [Disease and vaccination](https://juannat7.github.io/tipbox/models/seirx.html) | `SEIRx` | Transcritical |
|
|
154
|
+
| [Ocean overturning](https://juannat7.github.io/tipbox/models/amoc.html#amoc-fold) | `AMOCFold` | Fold |
|
|
155
|
+
| [Moving saddle-node](https://juannat7.github.io/tipbox/models/saddle_node.html) | `SaddleNode` | Rate-induced |
|
|
156
|
+
| [Moving Bautin](https://juannat7.github.io/tipbox/models/bautin.html) | `Bautin` | Rate-induced |
|
|
157
|
+
| [Compost bomb](https://juannat7.github.io/tipbox/models/compost.html) | `CompostBomb` | Rate-induced |
|
|
158
|
+
| [Ocean overturning](https://juannat7.github.io/tipbox/models/amoc.html#amoc-rate) | `AMOCRate` | Rate-induced |
|
|
159
|
+
| [Ricker population map](https://juannat7.github.io/tipbox/models/ricker.html) | `Ricker` | Population decline |
|
|
160
|
+
| [Combustion oscillator](https://juannat7.github.io/tipbox/models/thermoacoustic.html) | `Thermoacoustic` | Subcritical Hopf |
|
|
161
|
+
| **Empirical observations** | | |
|
|
162
|
+
| [Microcosm · M1 and M2](https://juannat7.github.io/tipbox/api.html#tipbox.datasets.Microcosm) | `Microcosm().load()` | Light attenuation |
|
|
163
|
+
| [Voice onset](https://juannat7.github.io/tipbox/api.html#tipbox.datasets.VoiceOnset) | `VoiceOnset().load()` | Subglottal pressure |
|
|
164
|
+
| [Cellular ATP](https://juannat7.github.io/tipbox/api.html#tipbox.datasets.CellularATP) | `CellularATP().load()` | Fluorescence ratio |
|
|
165
|
+
| [Paleoclimate](https://juannat7.github.io/tipbox/api.html#tipbox.datasets.Paleoclimate) | `Paleoclimate().load()` | CaCO₃ |
|
|
166
|
+
| [Electrical blackout](https://juannat7.github.io/tipbox/api.html#tipbox.datasets.ElectricalBlackout) | `ElectricalBlackout().load()` | Frequency |
|
|
167
|
+
|
|
168
|
+
Full reference: [system catalog](https://juannat7.github.io/tipbox/models/index.html).
|
|
169
|
+
|
|
170
|
+
|
|
171
|
+
|
|
172
|
+
## Notebook examples
|
|
173
|
+
|
|
174
|
+
- [Generation and evaluation](https://github.com/juannat7/tipbox/blob/main/notebook/01_generate_batch.ipynb)
|
|
175
|
+
- [Parameter sensitivity](https://github.com/juannat7/tipbox/blob/main/notebook/02_sensitivity_analysis.ipynb)
|
|
176
|
+
|
|
177
|
+
## Used in research
|
|
178
|
+
|
|
179
|
+
- **[In revision]** Nathaniel et al. (2026), [Koopman early warning signals for bifurcation and rate-induced tipping](https://arxiv.org/abs/2608.14716). Code: [KEWS](https://github.com/juannat7/kews).
|
|
180
|
+
- **[NeurIPS 2026]** Sevinchan, Nathaniel, et al. (2026), [In-context learning to predict critical transitions in dynamical systems](https://arxiv.org/abs/2605.12308).
|
|
181
|
+
|
|
182
|
+
## Citation
|
|
183
|
+
|
|
184
|
+
If you use TipBox's code or datasets, we would appreciate citations to these works:
|
|
185
|
+
|
|
186
|
+
```bibtex
|
|
187
|
+
@article{nathaniel2026koopman,
|
|
188
|
+
title={Koopman early warning signals for bifurcation and rate-induced tipping},
|
|
189
|
+
author={Nathaniel, Juan and Roesch, Carla and DeSantis, Derek and Kooloth, Parvathi and Fan, Hang and Lucarini, Valerio and Romanou, Anastasia and Gentine, Pierre},
|
|
190
|
+
journal={arXiv preprint arXiv:2608.14716},
|
|
191
|
+
year={2026}
|
|
192
|
+
}
|
|
193
|
+
|
|
194
|
+
@article{sevinchan2026context,
|
|
195
|
+
title={In-context learning to predict critical transitions in dynamical systems},
|
|
196
|
+
author={Sevinchan, Yunus and Nathaniel, Juan and Ueltzh{\"o}ffer, Kai and Roesch, Carla and Weber, Tobias and Laschos, Vaios and Fan, Hang and Ramien, Gregor and Haux, Johannes and Gentine, Pierre and others},
|
|
197
|
+
journal={arXiv preprint arXiv:2605.12308},
|
|
198
|
+
year={2026}
|
|
199
|
+
}
|
|
200
|
+
```
|
tipbox-0.1.0/README.md
ADDED
|
@@ -0,0 +1,175 @@
|
|
|
1
|
+
# <img src="https://raw.githubusercontent.com/juannat7/tipbox/main/docs/tipbox-icon-300ppi.png" alt="" width="48" height="48" align="absmiddle"> TipBox
|
|
2
|
+
|
|
3
|
+
TipBox is a collection of tipping models and empirical observations. It covers bifurcation- and rate-induced tipping in stochastic systems, with early-warning indicators such as lag-1 autocorrelation and variance.
|
|
4
|
+
|
|
5
|
+
<div align="center">
|
|
6
|
+
|
|
7
|
+
[](https://www.python.org/)
|
|
8
|
+
[](https://pypi.org/project/tipbox/)
|
|
9
|
+
[](https://pepy.tech/projects/tipbox)
|
|
10
|
+
[](https://juannat7.github.io/tipbox/)
|
|
11
|
+
[](https://github.com/juannat7/tipbox/blob/main/LICENSE)
|
|
12
|
+
|
|
13
|
+
</div>
|
|
14
|
+
|
|
15
|
+
## Contents
|
|
16
|
+
|
|
17
|
+
- [Installation](#installation)
|
|
18
|
+
- [Generate or load a time series](#generate-or-load-a-time-series)
|
|
19
|
+
- [Early-warning indicators](#compute-early-warning-indicators)
|
|
20
|
+
- [Benchmarking](#benchmarking)
|
|
21
|
+
- [Systems](#systems)
|
|
22
|
+
- [Notebook examples](#notebook-examples)
|
|
23
|
+
- [Used in research](#used-in-research)
|
|
24
|
+
- [Citation](#citation)
|
|
25
|
+
|
|
26
|
+
## Installation
|
|
27
|
+
|
|
28
|
+
```bash
|
|
29
|
+
pip install tipbox
|
|
30
|
+
```
|
|
31
|
+
|
|
32
|
+
For development, clone this repository and run `pip install -e .`.
|
|
33
|
+
|
|
34
|
+
## Generate or load a time series
|
|
35
|
+
|
|
36
|
+
TipBox provides a common interface to simulate tipping systems and load observations. See the [system collection](#systems) for available models and their documentation.
|
|
37
|
+
|
|
38
|
+
```python
|
|
39
|
+
from tipbox.models import MayHarvesting, SaddleNode
|
|
40
|
+
from tipbox.datasets import Microcosm
|
|
41
|
+
|
|
42
|
+
# Bifurcation-induced tipping
|
|
43
|
+
harvesting = MayHarvesting()
|
|
44
|
+
bifurcation = harvesting.make_trajectory(num_samples=1200, noise=1.0, seed=43)
|
|
45
|
+
bifurcation_control = harvesting.make_trajectory(num_samples=1200, noise=1.0, seed=43, null_simulation=True)
|
|
46
|
+
|
|
47
|
+
# Rate-induced tipping
|
|
48
|
+
rate_model = SaddleNode(epsilon=1.4)
|
|
49
|
+
rate = rate_model.make_trajectory(num_samples=2401, noise=0.01, seed=43)
|
|
50
|
+
rate_control = rate_model.make_trajectory(num_samples=2401, noise=0.01, seed=43, null_simulation=True)
|
|
51
|
+
|
|
52
|
+
# Empirical observations: Veraart et al. (2012), chemostats M1 and M2.
|
|
53
|
+
observed = Microcosm().load()
|
|
54
|
+
```
|
|
55
|
+
|
|
56
|
+
Simulation results contain `time` and `trajectory` arrays; loaded observations contain `time` and `observations`. Equations, parameters, and simulation controls are in the [documentation](https://juannat7.github.io/tipbox/usage.html).
|
|
57
|
+
|
|
58
|
+

|
|
59
|
+
|
|
60
|
+
Empirical panels: [CC BY-NC 4.0](https://github.com/juannat7/tipbox/blob/main/docs/_static/figures/LICENSE.md).
|
|
61
|
+
|
|
62
|
+
## Compute early-warning indicators
|
|
63
|
+
|
|
64
|
+
Choose an observable and apply a trailing-window statistic before the fold:
|
|
65
|
+
|
|
66
|
+
```python
|
|
67
|
+
from tipbox.indicators import rolling_ar1, rolling_variance
|
|
68
|
+
|
|
69
|
+
before_fold = bifurcation.param_values < harvesting.critical_parameter
|
|
70
|
+
signal = bifurcation.trajectory[before_fold, 0]
|
|
71
|
+
|
|
72
|
+
# Get early warning signals
|
|
73
|
+
ar1 = rolling_ar1(signal, window=200, detrend="linear")
|
|
74
|
+
variance = rolling_variance(signal, window=200, detrend="linear")
|
|
75
|
+
```
|
|
76
|
+
|
|
77
|
+
The [indicator reference](https://juannat7.github.io/tipbox/indicators.html) also covers autocorrelation, skewness, and kurtosis.
|
|
78
|
+
|
|
79
|
+

|
|
80
|
+
|
|
81
|
+
## Benchmarking
|
|
82
|
+
|
|
83
|
+
Evaluate indicator trends on tipping and control trajectories with the area under the ROC curve (AUROC). Each trajectory contributes one score.
|
|
84
|
+
|
|
85
|
+
### Generate a batch
|
|
86
|
+
|
|
87
|
+
Batches support repeated experiments and indicator comparisons:
|
|
88
|
+
|
|
89
|
+
```python
|
|
90
|
+
from tipbox.models import MayHarvesting
|
|
91
|
+
from tipbox.datasets import generate_dataset
|
|
92
|
+
from tipbox.indicators import rolling_ar1, rolling_variance
|
|
93
|
+
from tipbox.metrics import ensemble_roc, plot_roc
|
|
94
|
+
|
|
95
|
+
# 50 tipping trajectories + 50 controls; retain 300 samples before each tipping threshold.
|
|
96
|
+
batch = generate_dataset(
|
|
97
|
+
MayHarvesting(), num_tipping=50, num_controls=50, num_samples=1000,
|
|
98
|
+
context_samples=300, noise=1.0, seed=43,
|
|
99
|
+
)
|
|
100
|
+
signals = batch.observations[:, :, 0] # First observed variable in each trajectory.
|
|
101
|
+
indicators = {
|
|
102
|
+
"AR1": [rolling_ar1(x, window=100, detrend="linear") for x in signals],
|
|
103
|
+
"Variance": [rolling_variance(x, window=100, detrend="linear") for x in signals],
|
|
104
|
+
}
|
|
105
|
+
```
|
|
106
|
+
|
|
107
|
+
Score the indicator trend in each trajectory and plot the ROC curves:
|
|
108
|
+
|
|
109
|
+
```python
|
|
110
|
+
report = ensemble_roc(batch.labels, indicators) # Labels: 0 control, 1 tipping.
|
|
111
|
+
ax = plot_roc(report)
|
|
112
|
+
```
|
|
113
|
+
|
|
114
|
+

|
|
115
|
+
|
|
116
|
+
See the [benchmark guide](https://juannat7.github.io/tipbox/benchmarks.html) for labels, trend scores, and evaluation conventions.
|
|
117
|
+
|
|
118
|
+
## Systems
|
|
119
|
+
|
|
120
|
+
Import model classes from `tipbox.models` and observation classes from `tipbox.datasets`.
|
|
121
|
+
Model links include equations and defaults; observation links describe `.load()`.
|
|
122
|
+
|
|
123
|
+
| System | Class / call | Mechanism / observable |
|
|
124
|
+
|---|---|---|
|
|
125
|
+
| **Models** | | |
|
|
126
|
+
| [May harvesting](https://juannat7.github.io/tipbox/models/harvesting.html) | `MayHarvesting` | Fold |
|
|
127
|
+
| [Rosenzweig–MacArthur](https://juannat7.github.io/tipbox/models/consumer_resource.html) | `RosenzweigMacArthur` | Transcritical / Hopf |
|
|
128
|
+
| [Disease and vaccination](https://juannat7.github.io/tipbox/models/seirx.html) | `SEIRx` | Transcritical |
|
|
129
|
+
| [Ocean overturning](https://juannat7.github.io/tipbox/models/amoc.html#amoc-fold) | `AMOCFold` | Fold |
|
|
130
|
+
| [Moving saddle-node](https://juannat7.github.io/tipbox/models/saddle_node.html) | `SaddleNode` | Rate-induced |
|
|
131
|
+
| [Moving Bautin](https://juannat7.github.io/tipbox/models/bautin.html) | `Bautin` | Rate-induced |
|
|
132
|
+
| [Compost bomb](https://juannat7.github.io/tipbox/models/compost.html) | `CompostBomb` | Rate-induced |
|
|
133
|
+
| [Ocean overturning](https://juannat7.github.io/tipbox/models/amoc.html#amoc-rate) | `AMOCRate` | Rate-induced |
|
|
134
|
+
| [Ricker population map](https://juannat7.github.io/tipbox/models/ricker.html) | `Ricker` | Population decline |
|
|
135
|
+
| [Combustion oscillator](https://juannat7.github.io/tipbox/models/thermoacoustic.html) | `Thermoacoustic` | Subcritical Hopf |
|
|
136
|
+
| **Empirical observations** | | |
|
|
137
|
+
| [Microcosm · M1 and M2](https://juannat7.github.io/tipbox/api.html#tipbox.datasets.Microcosm) | `Microcosm().load()` | Light attenuation |
|
|
138
|
+
| [Voice onset](https://juannat7.github.io/tipbox/api.html#tipbox.datasets.VoiceOnset) | `VoiceOnset().load()` | Subglottal pressure |
|
|
139
|
+
| [Cellular ATP](https://juannat7.github.io/tipbox/api.html#tipbox.datasets.CellularATP) | `CellularATP().load()` | Fluorescence ratio |
|
|
140
|
+
| [Paleoclimate](https://juannat7.github.io/tipbox/api.html#tipbox.datasets.Paleoclimate) | `Paleoclimate().load()` | CaCO₃ |
|
|
141
|
+
| [Electrical blackout](https://juannat7.github.io/tipbox/api.html#tipbox.datasets.ElectricalBlackout) | `ElectricalBlackout().load()` | Frequency |
|
|
142
|
+
|
|
143
|
+
Full reference: [system catalog](https://juannat7.github.io/tipbox/models/index.html).
|
|
144
|
+
|
|
145
|
+

|
|
146
|
+
|
|
147
|
+
## Notebook examples
|
|
148
|
+
|
|
149
|
+
- [Generation and evaluation](https://github.com/juannat7/tipbox/blob/main/notebook/01_generate_batch.ipynb)
|
|
150
|
+
- [Parameter sensitivity](https://github.com/juannat7/tipbox/blob/main/notebook/02_sensitivity_analysis.ipynb)
|
|
151
|
+
|
|
152
|
+
## Used in research
|
|
153
|
+
|
|
154
|
+
- **[In revision]** Nathaniel et al. (2026), [Koopman early warning signals for bifurcation and rate-induced tipping](https://arxiv.org/abs/2608.14716). Code: [KEWS](https://github.com/juannat7/kews).
|
|
155
|
+
- **[NeurIPS 2026]** Sevinchan, Nathaniel, et al. (2026), [In-context learning to predict critical transitions in dynamical systems](https://arxiv.org/abs/2605.12308).
|
|
156
|
+
|
|
157
|
+
## Citation
|
|
158
|
+
|
|
159
|
+
If you use TipBox's code or datasets, we would appreciate citations to these works:
|
|
160
|
+
|
|
161
|
+
```bibtex
|
|
162
|
+
@article{nathaniel2026koopman,
|
|
163
|
+
title={Koopman early warning signals for bifurcation and rate-induced tipping},
|
|
164
|
+
author={Nathaniel, Juan and Roesch, Carla and DeSantis, Derek and Kooloth, Parvathi and Fan, Hang and Lucarini, Valerio and Romanou, Anastasia and Gentine, Pierre},
|
|
165
|
+
journal={arXiv preprint arXiv:2608.14716},
|
|
166
|
+
year={2026}
|
|
167
|
+
}
|
|
168
|
+
|
|
169
|
+
@article{sevinchan2026context,
|
|
170
|
+
title={In-context learning to predict critical transitions in dynamical systems},
|
|
171
|
+
author={Sevinchan, Yunus and Nathaniel, Juan and Ueltzh{\"o}ffer, Kai and Roesch, Carla and Weber, Tobias and Laschos, Vaios and Fan, Hang and Ramien, Gregor and Haux, Johannes and Gentine, Pierre and others},
|
|
172
|
+
journal={arXiv preprint arXiv:2605.12308},
|
|
173
|
+
year={2026}
|
|
174
|
+
}
|
|
175
|
+
```
|
|
@@ -0,0 +1,38 @@
|
|
|
1
|
+
[build-system]
|
|
2
|
+
requires = ["setuptools>=77"]
|
|
3
|
+
build-backend = "setuptools.build_meta"
|
|
4
|
+
|
|
5
|
+
[project]
|
|
6
|
+
name = "tipbox"
|
|
7
|
+
version = "0.1.0"
|
|
8
|
+
description = "Stochastic tipping models, empirical observations, and early-warning benchmarks"
|
|
9
|
+
authors = [
|
|
10
|
+
{name = "Juan Nathaniel", email = "jn2808@columbia.edu"},
|
|
11
|
+
]
|
|
12
|
+
dependencies = [
|
|
13
|
+
"jax",
|
|
14
|
+
"jaxlib",
|
|
15
|
+
"numpy",
|
|
16
|
+
"scipy",
|
|
17
|
+
"matplotlib",
|
|
18
|
+
]
|
|
19
|
+
|
|
20
|
+
requires-python = ">=3.10"
|
|
21
|
+
readme = "README.md"
|
|
22
|
+
license = "MIT"
|
|
23
|
+
license-files = ["LICEN[CS]E*"]
|
|
24
|
+
classifiers = [
|
|
25
|
+
"Programming Language :: Python :: 3",
|
|
26
|
+
"Operating System :: OS Independent",
|
|
27
|
+
]
|
|
28
|
+
|
|
29
|
+
[project.optional-dependencies]
|
|
30
|
+
docs = ["sphinx>=7,<9", "furo>=2024.8.6", "sphinx-copybutton>=0.5"]
|
|
31
|
+
|
|
32
|
+
[tool.setuptools.packages.find]
|
|
33
|
+
include = ["tipbox*"]
|
|
34
|
+
|
|
35
|
+
[project.urls]
|
|
36
|
+
Homepage = "https://github.com/juannat7/tipbox"
|
|
37
|
+
Documentation = "https://juannat7.github.io/tipbox/"
|
|
38
|
+
Issues = "https://github.com/juannat7/tipbox/issues"
|
tipbox-0.1.0/setup.cfg
ADDED
|
@@ -0,0 +1,13 @@
|
|
|
1
|
+
"""Box models and reproducible tipping-point benchmarks."""
|
|
2
|
+
|
|
3
|
+
from . import generate
|
|
4
|
+
from .registry import get_system_info, list_systems
|
|
5
|
+
from .types import BoxModel, TrajectoryResult
|
|
6
|
+
|
|
7
|
+
__all__ = [
|
|
8
|
+
"BoxModel",
|
|
9
|
+
"TrajectoryResult",
|
|
10
|
+
"generate",
|
|
11
|
+
"get_system_info",
|
|
12
|
+
"list_systems",
|
|
13
|
+
]
|
|
@@ -0,0 +1,126 @@
|
|
|
1
|
+
"""Shared physical parameters and numerical kernels for the two-state AMOC model."""
|
|
2
|
+
|
|
3
|
+
from dataclasses import dataclass
|
|
4
|
+
|
|
5
|
+
import jax.numpy as jnp
|
|
6
|
+
|
|
7
|
+
from .utils import parameter, register_dataclass_pytree
|
|
8
|
+
|
|
9
|
+
|
|
10
|
+
@register_dataclass_pytree
|
|
11
|
+
@dataclass(frozen=True)
|
|
12
|
+
class AMOCPhysics:
|
|
13
|
+
"""Calibrated 2×CO₂ box-model parameters; salinities are mass fractions.
|
|
14
|
+
|
|
15
|
+
The states are 100 times salinity anomalies. Their drift therefore includes
|
|
16
|
+
100 times the seconds-per-year conversion. Model time is years; box volumes
|
|
17
|
+
use m³ and transports use m³/s.
|
|
18
|
+
"""
|
|
19
|
+
|
|
20
|
+
S0: float = parameter(0.035, "Reference salinity mass fraction.", "mass fraction")
|
|
21
|
+
alpha: float = parameter(0.12, "Thermal-density coefficient.", "kg / m^3 / K")
|
|
22
|
+
beta: float = parameter(
|
|
23
|
+
790.0, "Haline-density coefficient per salinity mass fraction.", "kg / m^3"
|
|
24
|
+
)
|
|
25
|
+
seconds_per_year: float = parameter(
|
|
26
|
+
31500000.0,
|
|
27
|
+
"Seconds per model year; the separate factor100 converts salinity fractions to anomaly coordinates.",
|
|
28
|
+
"s / year",
|
|
29
|
+
)
|
|
30
|
+
V_N: float = parameter(3.683e16, "North Atlantic box volume.", "m^3")
|
|
31
|
+
V_T: float = parameter(5.418e16, "Tropical Atlantic box volume.", "m^3")
|
|
32
|
+
V_S: float = parameter(6.097e16, "Southern Ocean box volume.", "m^3")
|
|
33
|
+
V_IP: float = parameter(1.486e17, "Indo-Pacific box volume.", "m^3")
|
|
34
|
+
V_B: float = parameter(9.925e17, "Bottom-water box volume.", "m^3")
|
|
35
|
+
T_S: float = parameter(
|
|
36
|
+
7.919, "Southern reference temperature in the transport closure.", "degC"
|
|
37
|
+
)
|
|
38
|
+
T_0: float = parameter(
|
|
39
|
+
3.87, "North Atlantic reference temperature in the transport closure.", "degC"
|
|
40
|
+
)
|
|
41
|
+
total_salt: float = parameter(
|
|
42
|
+
4.4735e16, "Conserved salinity-volume integral.", "m^3"
|
|
43
|
+
)
|
|
44
|
+
lambda_q: float = parameter(
|
|
45
|
+
16200000.0, "Density-to-volume-transport coefficient.", "m^6 / kg / s"
|
|
46
|
+
)
|
|
47
|
+
gamma: float = parameter(
|
|
48
|
+
0.36, "Southern contribution to northward advective inflow.", "dimensionless"
|
|
49
|
+
)
|
|
50
|
+
mu: float = parameter(
|
|
51
|
+
2.2e-07,
|
|
52
|
+
"Temperature-transport coupling in the transport denominator.",
|
|
53
|
+
"K s / m^3",
|
|
54
|
+
)
|
|
55
|
+
K_N: float = parameter(1762000.0, "Northern gyre exchange transport.", "m^3 / s")
|
|
56
|
+
K_S: float = parameter(1872000.0, "Southern gyre exchange transport.", "m^3 / s")
|
|
57
|
+
S_S: float = parameter(0.034427, "Fixed Southern Ocean salinity.", "mass fraction")
|
|
58
|
+
S_B: float = parameter(0.034538, "Fixed bottom-water salinity.", "mass fraction")
|
|
59
|
+
F_N0: float = parameter(0.486, "Northern freshwater flux at zero hosing.", "Sv")
|
|
60
|
+
F_NH: float = parameter(
|
|
61
|
+
0.1311, "Northern freshwater-flux response to hosing.", "dimensionless"
|
|
62
|
+
)
|
|
63
|
+
F_T0: float = parameter(-0.997, "Tropical freshwater flux at zero hosing.", "Sv")
|
|
64
|
+
F_TH: float = parameter(
|
|
65
|
+
0.6961, "Tropical freshwater-flux response to hosing.", "dimensionless"
|
|
66
|
+
)
|
|
67
|
+
|
|
68
|
+
|
|
69
|
+
def strength_sv(SN, p: AMOCPhysics):
|
|
70
|
+
"""AMOC transport in Sverdrups from North Atlantic salinity anomaly."""
|
|
71
|
+
south = p.S_S - p.S0
|
|
72
|
+
return (
|
|
73
|
+
p.lambda_q
|
|
74
|
+
* (p.alpha * (p.T_S - p.T_0) + p.beta * (SN / 100 - south))
|
|
75
|
+
/ (1 + p.lambda_q * p.alpha * p.mu)
|
|
76
|
+
* 1e-6
|
|
77
|
+
)
|
|
78
|
+
|
|
79
|
+
|
|
80
|
+
def drift(state, H, p: AMOCPhysics):
|
|
81
|
+
"""Salinity-anomaly drift, preserving the calibrated sign-dependent transport."""
|
|
82
|
+
SN, ST = state
|
|
83
|
+
SS, SB = (p.S_S - p.S0) * 100, (p.S_B - p.S0) * 100
|
|
84
|
+
SIP = (
|
|
85
|
+
100
|
|
86
|
+
* (
|
|
87
|
+
p.total_salt
|
|
88
|
+
- (p.V_N * SN + p.V_T * ST + p.V_S * SS + p.V_B * SB) / 100
|
|
89
|
+
- p.S0 * (p.V_B + p.V_N + p.V_T + p.V_IP + p.V_S)
|
|
90
|
+
)
|
|
91
|
+
/ p.V_IP
|
|
92
|
+
)
|
|
93
|
+
q = strength_sv(SN, p) * 1e6
|
|
94
|
+
aq = jnp.abs(q)
|
|
95
|
+
FN, FT = (p.F_N0 + p.F_NH * H) * 1e6, (p.F_T0 + p.F_TH * H) * 1e6
|
|
96
|
+
north_exchange = p.K_N * (ST - SN) / 100
|
|
97
|
+
tropical_exchange = p.K_S * (SS - ST) / 100 + p.K_N * (SN - ST) / 100
|
|
98
|
+
north_adv = jnp.where(q >= 0, q * (ST - SN) / 100, aq * (SB - SN) / 100)
|
|
99
|
+
tropical_adv = jnp.where(
|
|
100
|
+
q >= 0,
|
|
101
|
+
q * (p.gamma * SS + (1 - p.gamma) * SIP - ST) / 100,
|
|
102
|
+
aq * (SN - ST) / 100,
|
|
103
|
+
)
|
|
104
|
+
return jnp.array(
|
|
105
|
+
[
|
|
106
|
+
100 * p.seconds_per_year / p.V_N * (north_adv + north_exchange - FN * p.S0),
|
|
107
|
+
100
|
|
108
|
+
* p.seconds_per_year
|
|
109
|
+
/ p.V_T
|
|
110
|
+
* (tropical_adv + tropical_exchange - FT * p.S0),
|
|
111
|
+
]
|
|
112
|
+
)
|
|
113
|
+
|
|
114
|
+
|
|
115
|
+
def rk4_step(state, h_cur, h_mid, h_next, dt, physics):
|
|
116
|
+
"""RK4 drift update; diffusion is applied separately by the caller."""
|
|
117
|
+
k1 = drift(state, h_cur, physics)
|
|
118
|
+
k2 = drift(state + 0.5 * dt * k1, h_mid, physics)
|
|
119
|
+
k3 = drift(state + 0.5 * dt * k2, h_mid, physics)
|
|
120
|
+
k4 = drift(state + dt * k3, h_next, physics)
|
|
121
|
+
return state + dt / 6 * (k1 + 2 * k2 + 2 * k3 + k4)
|
|
122
|
+
|
|
123
|
+
|
|
124
|
+
def observe(path, physics):
|
|
125
|
+
"""Observed transport followed by the two physical salinity-anomaly states."""
|
|
126
|
+
return jnp.column_stack([strength_sv(path[:, 0], physics), path])
|
|
File without changes
|