seraplot 2.4.0__tar.gz → 2.4.1__tar.gz
This diff represents the content of publicly available package versions that have been released to one of the supported registries. The information contained in this diff is provided for informational purposes only and reflects changes between package versions as they appear in their respective public registries.
- {seraplot-2.4.0 → seraplot-2.4.1}/Cargo.lock +1 -1
- {seraplot-2.4.0 → seraplot-2.4.1}/Cargo.toml +9 -1
- {seraplot-2.4.0 → seraplot-2.4.1}/PKG-INFO +24 -35
- {seraplot-2.4.0 → seraplot-2.4.1}/README.md +23 -34
- seraplot-2.4.1/maturin_output.log +0 -0
- seraplot-2.4.1/publish_v241.log +0 -0
- {seraplot-2.4.0 → seraplot-2.4.1}/pyproject.toml +1 -1
- seraplot-2.4.1/src/docs/ml/adaboost.md +203 -0
- seraplot-2.4.1/src/docs/ml/dbscan-class.md +203 -0
- seraplot-2.4.0/src/docs/ml/adaboost.md +0 -185
- seraplot-2.4.0/src/docs/ml/dbscan-class.md +0 -227
- {seraplot-2.4.0 → seraplot-2.4.1}/.gitignore +0 -0
- {seraplot-2.4.0 → seraplot-2.4.1}/05--Diabetes_SeraPlot.ipynb +0 -0
- {seraplot-2.4.0 → seraplot-2.4.1}/07--OpenFoodFacts_SeraPlot_Benchmark.ipynb +0 -0
- {seraplot-2.4.0 → seraplot-2.4.1}/TEST_1M_Battle.ipynb +0 -0
- {seraplot-2.4.0 → seraplot-2.4.1}/bench_all.py +0 -0
- {seraplot-2.4.0 → seraplot-2.4.1}/bench_bigdata.py +0 -0
- {seraplot-2.4.0 → seraplot-2.4.1}/bench_full.py +0 -0
- {seraplot-2.4.0 → seraplot-2.4.1}/bench_issues.json +0 -0
- {seraplot-2.4.0 → seraplot-2.4.1}/bench_knn_sgd.py +0 -0
- {seraplot-2.4.0 → seraplot-2.4.1}/bench_perf.py +0 -0
- {seraplot-2.4.0 → seraplot-2.4.1}/bench_quick.py +0 -0
- {seraplot-2.4.0 → seraplot-2.4.1}/bench_quick2.py +0 -0
- {seraplot-2.4.0 → seraplot-2.4.1}/bench_scale.py +0 -0
- {seraplot-2.4.0 → seraplot-2.4.1}/bench_seraplot.py +0 -0
- {seraplot-2.4.0 → seraplot-2.4.1}/bench_sklearn.py +0 -0
- {seraplot-2.4.0 → seraplot-2.4.1}/bench_svc.py +0 -0
- {seraplot-2.4.0 → seraplot-2.4.1}/bench_svc2.py +0 -0
- {seraplot-2.4.0 → seraplot-2.4.1}/bench_test.py +0 -0
- {seraplot-2.4.0 → seraplot-2.4.1}/benchmark_gridsearch.py +0 -0
- {seraplot-2.4.0 → seraplot-2.4.1}/benchmark_gridsearch2.py +0 -0
- {seraplot-2.4.0 → seraplot-2.4.1}/benchmark_kmeans_heavy.ipynb +0 -0
- {seraplot-2.4.0 → seraplot-2.4.1}/benchmark_kmeans_openfoodfacts.ipynb +0 -0
- {seraplot-2.4.0 → seraplot-2.4.1}/benchmark_ml.ipynb +0 -0
- {seraplot-2.4.0 → seraplot-2.4.1}/benchmark_ml_openfoodfacts.ipynb +0 -0
- {seraplot-2.4.0 → seraplot-2.4.1}/benchmark_ml_out.ipynb +0 -0
- {seraplot-2.4.0 → seraplot-2.4.1}/build.log +0 -0
- {seraplot-2.4.0 → seraplot-2.4.1}/gen_bench_slides.py +0 -0
- {seraplot-2.4.0 → seraplot-2.4.1}/images/2d/1.png +0 -0
- {seraplot-2.4.0 → seraplot-2.4.1}/images/2d/2.png +0 -0
- {seraplot-2.4.0 → seraplot-2.4.1}/images/2d/3.png +0 -0
- {seraplot-2.4.0 → seraplot-2.4.1}/images/2d/4.png +0 -0
- {seraplot-2.4.0 → seraplot-2.4.1}/images/2d/5.png +0 -0
- {seraplot-2.4.0 → seraplot-2.4.1}/images/2d/6.png +0 -0
- {seraplot-2.4.0 → seraplot-2.4.1}/images/2d/7.png +0 -0
- {seraplot-2.4.0 → seraplot-2.4.1}/images/2d/8.png +0 -0
- {seraplot-2.4.0 → seraplot-2.4.1}/images/3d/1.png +0 -0
- {seraplot-2.4.0 → seraplot-2.4.1}/images/3d/2.png +0 -0
- {seraplot-2.4.0 → seraplot-2.4.1}/images/3d/3.png +0 -0
- {seraplot-2.4.0 → seraplot-2.4.1}/images/3d/4.png +0 -0
- {seraplot-2.4.0 → seraplot-2.4.1}/images/3d/5.png +0 -0
- {seraplot-2.4.0 → seraplot-2.4.1}/images/3d/6.png +0 -0
- {seraplot-2.4.0 → seraplot-2.4.1}/images/3d/7.png +0 -0
- {seraplot-2.4.0 → seraplot-2.4.1}/images/3d/8.png +0 -0
- {seraplot-2.4.0 → seraplot-2.4.1}/images/README.md +0 -0
- {seraplot-2.4.0 → seraplot-2.4.1}/images/benchmark/1.png +0 -0
- {seraplot-2.4.0 → seraplot-2.4.1}/images/benchmark/2.png +0 -0
- {seraplot-2.4.0 → seraplot-2.4.1}/images/benchmark/3.png +0 -0
- {seraplot-2.4.0 → seraplot-2.4.1}/images/logo.png +0 -0
- {seraplot-2.4.0 → seraplot-2.4.1}/kmeans_test.html +0 -0
- {seraplot-2.4.0 → seraplot-2.4.1}/publish_2378.log +0 -0
- {seraplot-2.4.0 → seraplot-2.4.1}/publish_log.txt +0 -0
- {seraplot-2.4.0 → seraplot-2.4.1}/python/seraplot/__init__.py +0 -0
- {seraplot-2.4.0 → seraplot-2.4.1}/python/seraplot/matplotlib.py +0 -0
- {seraplot-2.4.0 → seraplot-2.4.1}/python/seraplot/seraplot.cp311-win_amd64.pyd.old +0 -0
- {seraplot-2.4.0 → seraplot-2.4.1}/results_seraplot.json +0 -0
- {seraplot-2.4.0 → seraplot-2.4.1}/results_sklearn.json +0 -0
- {seraplot-2.4.0 → seraplot-2.4.1}/src/.github/workflows/mdbook.yml +0 -0
- {seraplot-2.4.0 → seraplot-2.4.1}/src/.gitignore +0 -0
- {seraplot-2.4.0 → seraplot-2.4.1}/src/README.md +0 -0
- {seraplot-2.4.0 → seraplot-2.4.1}/src/asset/SVG World Map with labels.svg +0 -0
- {seraplot-2.4.0 → seraplot-2.4.1}/src/asset/logo.png +0 -0
- {seraplot-2.4.0 → seraplot-2.4.1}/src/asset/world.svg +0 -0
- {seraplot-2.4.0 → seraplot-2.4.1}/src/bindings/builder_template.rs +0 -0
- {seraplot-2.4.0 → seraplot-2.4.1}/src/bindings/chart_types.rs +0 -0
- {seraplot-2.4.0 → seraplot-2.4.1}/src/bindings/commands/charts.rs +0 -0
- {seraplot-2.4.0 → seraplot-2.4.1}/src/bindings/commands/docs.rs +0 -0
- {seraplot-2.4.0 → seraplot-2.4.1}/src/bindings/commands/ml.rs +0 -0
- {seraplot-2.4.0 → seraplot-2.4.1}/src/bindings/commands/mod.rs +0 -0
- {seraplot-2.4.0 → seraplot-2.4.1}/src/bindings/commands/native.rs +0 -0
- {seraplot-2.4.0 → seraplot-2.4.1}/src/bindings/commands/registry.rs +0 -0
- {seraplot-2.4.0 → seraplot-2.4.1}/src/bindings/export_builder.rs +0 -0
- {seraplot-2.4.0 → seraplot-2.4.1}/src/bindings/fast_export_c.rs +0 -0
- {seraplot-2.4.0 → seraplot-2.4.1}/src/bindings/fast_render.rs +0 -0
- {seraplot-2.4.0 → seraplot-2.4.1}/src/bindings/memory_pool.rs +0 -0
- {seraplot-2.4.0 → seraplot-2.4.1}/src/bindings/mod.rs +0 -0
- {seraplot-2.4.0 → seraplot-2.4.1}/src/bindings/registry_macro.rs +0 -0
- {seraplot-2.4.0 → seraplot-2.4.1}/src/bindings/unified_builder.rs +0 -0
- {seraplot-2.4.0 → seraplot-2.4.1}/src/bindings/unified_config.rs +0 -0
- {seraplot-2.4.0 → seraplot-2.4.1}/src/bindings/utils/arena_alloc.rs +0 -0
- {seraplot-2.4.0 → seraplot-2.4.1}/src/bindings/utils/bitset.rs +0 -0
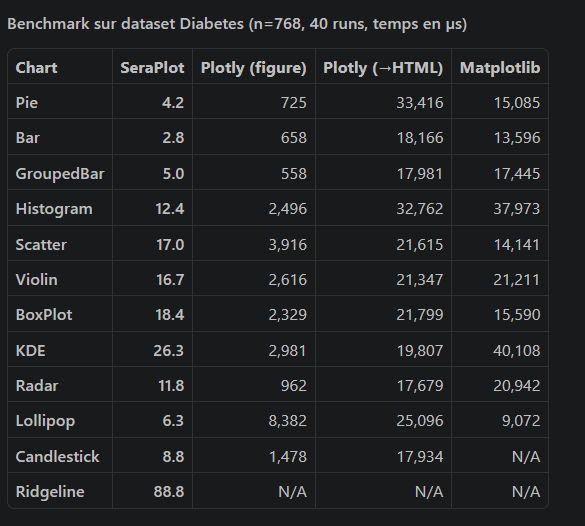
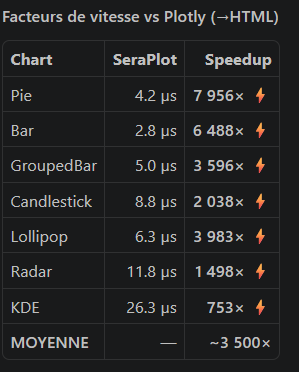
- {seraplot-2.4.0 → seraplot-2.4.1}/src/bindings/utils/compact_state.rs +0 -0
- {seraplot-2.4.0 → seraplot-2.4.1}/src/bindings/utils/data_processor.rs +0 -0
- {seraplot-2.4.0 → seraplot-2.4.1}/src/bindings/utils/image_processor.rs +0 -0
- {seraplot-2.4.0 → seraplot-2.4.1}/src/bindings/utils/lazy_builders.rs +0 -0
- {seraplot-2.4.0 → seraplot-2.4.1}/src/bindings/utils/memory_pool.rs +0 -0
- {seraplot-2.4.0 → seraplot-2.4.1}/src/bindings/utils/mod.rs +0 -0
- {seraplot-2.4.0 → seraplot-2.4.1}/src/bindings/utils/simd_ops.rs +0 -0
- {seraplot-2.4.0 → seraplot-2.4.1}/src/bindings/utils/state_export.rs +0 -0
- {seraplot-2.4.0 → seraplot-2.4.1}/src/book.toml +0 -0
- {seraplot-2.4.0 → seraplot-2.4.1}/src/core/builders.rs +0 -0
- {seraplot-2.4.0 → seraplot-2.4.1}/src/core/math.rs +0 -0
- {seraplot-2.4.0 → seraplot-2.4.1}/src/core/mod.rs +0 -0
- {seraplot-2.4.0 → seraplot-2.4.1}/src/data/conversion.rs +0 -0
- {seraplot-2.4.0 → seraplot-2.4.1}/src/data/index.rs +0 -0
- {seraplot-2.4.0 → seraplot-2.4.1}/src/data/loader.rs +0 -0
- {seraplot-2.4.0 → seraplot-2.4.1}/src/data/mod.rs +0 -0
- {seraplot-2.4.0 → seraplot-2.4.1}/src/data/processor.rs +0 -0
- {seraplot-2.4.0 → seraplot-2.4.1}/src/docs/SUMMARY.md +0 -0
- {seraplot-2.4.0 → seraplot-2.4.1}/src/docs/about/index.md +0 -0
- {seraplot-2.4.0 → seraplot-2.4.1}/src/docs/about/support.md +0 -0
- {seraplot-2.4.0 → seraplot-2.4.1}/src/docs/api/index.md +0 -0
- {seraplot-2.4.0 → seraplot-2.4.1}/src/docs/charts/2d/area.md +0 -0
- {seraplot-2.4.0 → seraplot-2.4.1}/src/docs/charts/2d/bar.md +0 -0
- {seraplot-2.4.0 → seraplot-2.4.1}/src/docs/charts/2d/boxplot.md +0 -0
- {seraplot-2.4.0 → seraplot-2.4.1}/src/docs/charts/2d/bubble.md +0 -0
- {seraplot-2.4.0 → seraplot-2.4.1}/src/docs/charts/2d/bullet.md +0 -0
- {seraplot-2.4.0 → seraplot-2.4.1}/src/docs/charts/2d/candlestick.md +0 -0
- {seraplot-2.4.0 → seraplot-2.4.1}/src/docs/charts/2d/donut.md +0 -0
- {seraplot-2.4.0 → seraplot-2.4.1}/src/docs/charts/2d/dumbbell.md +0 -0
- {seraplot-2.4.0 → seraplot-2.4.1}/src/docs/charts/2d/funnel.md +0 -0
- {seraplot-2.4.0 → seraplot-2.4.1}/src/docs/charts/2d/gauge.md +0 -0
- {seraplot-2.4.0 → seraplot-2.4.1}/src/docs/charts/2d/grid.md +0 -0
- {seraplot-2.4.0 → seraplot-2.4.1}/src/docs/charts/2d/grouped-bar.md +0 -0
- {seraplot-2.4.0 → seraplot-2.4.1}/src/docs/charts/2d/hbar.md +0 -0
- {seraplot-2.4.0 → seraplot-2.4.1}/src/docs/charts/2d/heatmap.md +0 -0
- {seraplot-2.4.0 → seraplot-2.4.1}/src/docs/charts/2d/histogram-overlay.md +0 -0
- {seraplot-2.4.0 → seraplot-2.4.1}/src/docs/charts/2d/histogram.md +0 -0
- {seraplot-2.4.0 → seraplot-2.4.1}/src/docs/charts/2d/index.md +0 -0
- {seraplot-2.4.0 → seraplot-2.4.1}/src/docs/charts/2d/kde.md +0 -0
- {seraplot-2.4.0 → seraplot-2.4.1}/src/docs/charts/2d/line.md +0 -0
- {seraplot-2.4.0 → seraplot-2.4.1}/src/docs/charts/2d/lollipop.md +0 -0
- {seraplot-2.4.0 → seraplot-2.4.1}/src/docs/charts/2d/multiline.md +0 -0
- {seraplot-2.4.0 → seraplot-2.4.1}/src/docs/charts/2d/parallel.md +0 -0
- {seraplot-2.4.0 → seraplot-2.4.1}/src/docs/charts/2d/pie.md +0 -0
- {seraplot-2.4.0 → seraplot-2.4.1}/src/docs/charts/2d/radar.md +0 -0
- {seraplot-2.4.0 → seraplot-2.4.1}/src/docs/charts/2d/ridgeline.md +0 -0
- {seraplot-2.4.0 → seraplot-2.4.1}/src/docs/charts/2d/scatter.md +0 -0
- {seraplot-2.4.0 → seraplot-2.4.1}/src/docs/charts/2d/slideshow.md +0 -0
- {seraplot-2.4.0 → seraplot-2.4.1}/src/docs/charts/2d/slope.md +0 -0
- {seraplot-2.4.0 → seraplot-2.4.1}/src/docs/charts/2d/stacked-bar.md +0 -0
- {seraplot-2.4.0 → seraplot-2.4.1}/src/docs/charts/2d/sunburst.md +0 -0
- {seraplot-2.4.0 → seraplot-2.4.1}/src/docs/charts/2d/treemap.md +0 -0
- {seraplot-2.4.0 → seraplot-2.4.1}/src/docs/charts/2d/violin.md +0 -0
- {seraplot-2.4.0 → seraplot-2.4.1}/src/docs/charts/2d/waterfall.md +0 -0
- {seraplot-2.4.0 → seraplot-2.4.1}/src/docs/charts/2d/wordcloud.md +0 -0
- {seraplot-2.4.0 → seraplot-2.4.1}/src/docs/charts/3d/bar3d.md +0 -0
- {seraplot-2.4.0 → seraplot-2.4.1}/src/docs/charts/3d/bubble3d.md +0 -0
- {seraplot-2.4.0 → seraplot-2.4.1}/src/docs/charts/3d/candlestick3d.md +0 -0
- {seraplot-2.4.0 → seraplot-2.4.1}/src/docs/charts/3d/dumbbell3d.md +0 -0
- {seraplot-2.4.0 → seraplot-2.4.1}/src/docs/charts/3d/funnel3d.md +0 -0
- {seraplot-2.4.0 → seraplot-2.4.1}/src/docs/charts/3d/globe3d.md +0 -0
- {seraplot-2.4.0 → seraplot-2.4.1}/src/docs/charts/3d/heatmap3d.md +0 -0
- {seraplot-2.4.0 → seraplot-2.4.1}/src/docs/charts/3d/index.md +0 -0
- {seraplot-2.4.0 → seraplot-2.4.1}/src/docs/charts/3d/kde3d.md +0 -0
- {seraplot-2.4.0 → seraplot-2.4.1}/src/docs/charts/3d/line3d.md +0 -0
- {seraplot-2.4.0 → seraplot-2.4.1}/src/docs/charts/3d/lollipop3d.md +0 -0
- {seraplot-2.4.0 → seraplot-2.4.1}/src/docs/charts/3d/pie3d.md +0 -0
- {seraplot-2.4.0 → seraplot-2.4.1}/src/docs/charts/3d/radar3d.md +0 -0
- {seraplot-2.4.0 → seraplot-2.4.1}/src/docs/charts/3d/ridgeline3d.md +0 -0
- {seraplot-2.4.0 → seraplot-2.4.1}/src/docs/charts/3d/scatter3d.md +0 -0
- {seraplot-2.4.0 → seraplot-2.4.1}/src/docs/charts/3d/stacked-bar3d.md +0 -0
- {seraplot-2.4.0 → seraplot-2.4.1}/src/docs/charts/3d/sunburst3d.md +0 -0
- {seraplot-2.4.0 → seraplot-2.4.1}/src/docs/charts/3d/violin3d.md +0 -0
- {seraplot-2.4.0 → seraplot-2.4.1}/src/docs/charts/index.md +0 -0
- {seraplot-2.4.0 → seraplot-2.4.1}/src/docs/charts/map/bubble-map.md +0 -0
- {seraplot-2.4.0 → seraplot-2.4.1}/src/docs/charts/map/choropleth.md +0 -0
- {seraplot-2.4.0 → seraplot-2.4.1}/src/docs/charts/map/index.md +0 -0
- {seraplot-2.4.0 → seraplot-2.4.1}/src/docs/config/a11y.md +0 -0
- {seraplot-2.4.0 → seraplot-2.4.1}/src/docs/config/auto-display.md +0 -0
- {seraplot-2.4.0 → seraplot-2.4.1}/src/docs/config/automl.md +0 -0
- {seraplot-2.4.0 → seraplot-2.4.1}/src/docs/config/background.md +0 -0
- {seraplot-2.4.0 → seraplot-2.4.1}/src/docs/config/csp.md +0 -0
- {seraplot-2.4.0 → seraplot-2.4.1}/src/docs/config/diff.md +0 -0
- {seraplot-2.4.0 → seraplot-2.4.1}/src/docs/config/downsample.md +0 -0
- {seraplot-2.4.0 → seraplot-2.4.1}/src/docs/config/drift.md +0 -0
- {seraplot-2.4.0 → seraplot-2.4.1}/src/docs/config/export.md +0 -0
- {seraplot-2.4.0 → seraplot-2.4.1}/src/docs/config/facet.md +0 -0
- {seraplot-2.4.0 → seraplot-2.4.1}/src/docs/config/hover.md +0 -0
- {seraplot-2.4.0 → seraplot-2.4.1}/src/docs/config/index.md +0 -0
- {seraplot-2.4.0 → seraplot-2.4.1}/src/docs/config/ml-persistence.md +0 -0
- {seraplot-2.4.0 → seraplot-2.4.1}/src/docs/config/palette.md +0 -0
- {seraplot-2.4.0 → seraplot-2.4.1}/src/docs/config/pickle.md +0 -0
- {seraplot-2.4.0 → seraplot-2.4.1}/src/docs/config/streaming.md +0 -0
- {seraplot-2.4.0 → seraplot-2.4.1}/src/docs/config/themes.md +0 -0
- {seraplot-2.4.0 → seraplot-2.4.1}/src/docs/getting-started/chart-methods.md +0 -0
- {seraplot-2.4.0 → seraplot-2.4.1}/src/docs/getting-started/chart-object.md +0 -0
- {seraplot-2.4.0 → seraplot-2.4.1}/src/docs/getting-started/index.md +0 -0
- {seraplot-2.4.0 → seraplot-2.4.1}/src/docs/getting-started/installation.md +0 -0
- {seraplot-2.4.0 → seraplot-2.4.1}/src/docs/getting-started/quickstart.md +0 -0
- {seraplot-2.4.0 → seraplot-2.4.1}/src/docs/introduction.md +0 -0
- {seraplot-2.4.0 → seraplot-2.4.1}/src/docs/ml/bayes-index.md +0 -0
- {seraplot-2.4.0 → seraplot-2.4.1}/src/docs/ml/clustering-index.md +0 -0
- {seraplot-2.4.0 → seraplot-2.4.1}/src/docs/ml/cv-splitters.md +0 -0
- {seraplot-2.4.0 → seraplot-2.4.1}/src/docs/ml/dbscan.md +0 -0
- {seraplot-2.4.0 → seraplot-2.4.1}/src/docs/ml/dbscan3d.md +0 -0
- {seraplot-2.4.0 → seraplot-2.4.1}/src/docs/ml/decision-tree.md +0 -0
- {seraplot-2.4.0 → seraplot-2.4.1}/src/docs/ml/decomposition-index.md +0 -0
- {seraplot-2.4.0 → seraplot-2.4.1}/src/docs/ml/decomposition.md +0 -0
- {seraplot-2.4.0 → seraplot-2.4.1}/src/docs/ml/elastic-net.md +0 -0
- {seraplot-2.4.0 → seraplot-2.4.1}/src/docs/ml/evaluation-index.md +0 -0
- {seraplot-2.4.0 → seraplot-2.4.1}/src/docs/ml/gradient-boosting.md +0 -0
- {seraplot-2.4.0 → seraplot-2.4.1}/src/docs/ml/grid-search.md +0 -0
- {seraplot-2.4.0 → seraplot-2.4.1}/src/docs/ml/index.md +0 -0
- {seraplot-2.4.0 → seraplot-2.4.1}/src/docs/ml/isolation-forest.md +0 -0
- {seraplot-2.4.0 → seraplot-2.4.1}/src/docs/ml/kmeans-class.md +0 -0
- {seraplot-2.4.0 → seraplot-2.4.1}/src/docs/ml/kmeans.md +0 -0
- {seraplot-2.4.0 → seraplot-2.4.1}/src/docs/ml/knn.md +0 -0
- {seraplot-2.4.0 → seraplot-2.4.1}/src/docs/ml/lasso.md +0 -0
- {seraplot-2.4.0 → seraplot-2.4.1}/src/docs/ml/linear-index.md +0 -0
- {seraplot-2.4.0 → seraplot-2.4.1}/src/docs/ml/linear-regression.md +0 -0
- {seraplot-2.4.0 → seraplot-2.4.1}/src/docs/ml/logistic-regression.md +0 -0
- {seraplot-2.4.0 → seraplot-2.4.1}/src/docs/ml/metrics-classification.md +0 -0
- {seraplot-2.4.0 → seraplot-2.4.1}/src/docs/ml/metrics-clustering.md +0 -0
- {seraplot-2.4.0 → seraplot-2.4.1}/src/docs/ml/metrics-regression.md +0 -0
- {seraplot-2.4.0 → seraplot-2.4.1}/src/docs/ml/metrics.md +0 -0
- {seraplot-2.4.0 → seraplot-2.4.1}/src/docs/ml/naive-bayes.md +0 -0
- {seraplot-2.4.0 → seraplot-2.4.1}/src/docs/ml/neighbors-index.md +0 -0
- {seraplot-2.4.0 → seraplot-2.4.1}/src/docs/ml/permutation-importance.md +0 -0
- {seraplot-2.4.0 → seraplot-2.4.1}/src/docs/ml/preprocessing-advanced.md +0 -0
- {seraplot-2.4.0 → seraplot-2.4.1}/src/docs/ml/preprocessing-index.md +0 -0
- {seraplot-2.4.0 → seraplot-2.4.1}/src/docs/ml/preprocessing.md +0 -0
- {seraplot-2.4.0 → seraplot-2.4.1}/src/docs/ml/random-forest.md +0 -0
- {seraplot-2.4.0 → seraplot-2.4.1}/src/docs/ml/ridge.md +0 -0
- {seraplot-2.4.0 → seraplot-2.4.1}/src/docs/ml/selection-index.md +0 -0
- {seraplot-2.4.0 → seraplot-2.4.1}/src/docs/ml/sgd.md +0 -0
- {seraplot-2.4.0 → seraplot-2.4.1}/src/docs/ml/svm-index.md +0 -0
- {seraplot-2.4.0 → seraplot-2.4.1}/src/docs/ml/svm.md +0 -0
- {seraplot-2.4.0 → seraplot-2.4.1}/src/docs/ml/train-test-split.md +0 -0
- {seraplot-2.4.0 → seraplot-2.4.1}/src/docs/ml/tree-index.md +0 -0
- {seraplot-2.4.0 → seraplot-2.4.1}/src/docs/previews/area.html +0 -0
- {seraplot-2.4.0 → seraplot-2.4.1}/src/docs/previews/bar.html +0 -0
- {seraplot-2.4.0 → seraplot-2.4.1}/src/docs/previews/bar3d.html +0 -0
- {seraplot-2.4.0 → seraplot-2.4.1}/src/docs/previews/bench-matplotlib.html +0 -0
- {seraplot-2.4.0 → seraplot-2.4.1}/src/docs/previews/bench-plotly.html +0 -0
- {seraplot-2.4.0 → seraplot-2.4.1}/src/docs/previews/bench-seraplot.html +0 -0
- {seraplot-2.4.0 → seraplot-2.4.1}/src/docs/previews/boxplot.html +0 -0
- {seraplot-2.4.0 → seraplot-2.4.1}/src/docs/previews/bubble-map.html +0 -0
- {seraplot-2.4.0 → seraplot-2.4.1}/src/docs/previews/bubble.html +0 -0
- {seraplot-2.4.0 → seraplot-2.4.1}/src/docs/previews/bubble3d.html +0 -0
- {seraplot-2.4.0 → seraplot-2.4.1}/src/docs/previews/bullet.html +0 -0
- {seraplot-2.4.0 → seraplot-2.4.1}/src/docs/previews/candlestick.html +0 -0
- {seraplot-2.4.0 → seraplot-2.4.1}/src/docs/previews/candlestick3d.html +0 -0
- {seraplot-2.4.0 → seraplot-2.4.1}/src/docs/previews/choropleth.html +0 -0
- {seraplot-2.4.0 → seraplot-2.4.1}/src/docs/previews/dbscan-class.html +0 -0
- {seraplot-2.4.0 → seraplot-2.4.1}/src/docs/previews/dbscan.html +0 -0
- {seraplot-2.4.0 → seraplot-2.4.1}/src/docs/previews/dbscan3d.html +0 -0
- {seraplot-2.4.0 → seraplot-2.4.1}/src/docs/previews/donut.html +0 -0
- {seraplot-2.4.0 → seraplot-2.4.1}/src/docs/previews/dumbbell.html +0 -0
- {seraplot-2.4.0 → seraplot-2.4.1}/src/docs/previews/dumbbell3d.html +0 -0
- {seraplot-2.4.0 → seraplot-2.4.1}/src/docs/previews/funnel.html +0 -0
- {seraplot-2.4.0 → seraplot-2.4.1}/src/docs/previews/funnel3d.html +0 -0
- {seraplot-2.4.0 → seraplot-2.4.1}/src/docs/previews/gauge.html +0 -0
- {seraplot-2.4.0 → seraplot-2.4.1}/src/docs/previews/globe3d.html +0 -0
- {seraplot-2.4.0 → seraplot-2.4.1}/src/docs/previews/grid.html +0 -0
- {seraplot-2.4.0 → seraplot-2.4.1}/src/docs/previews/grouped-bar.html +0 -0
- {seraplot-2.4.0 → seraplot-2.4.1}/src/docs/previews/hbar.html +0 -0
- {seraplot-2.4.0 → seraplot-2.4.1}/src/docs/previews/heatmap.html +0 -0
- {seraplot-2.4.0 → seraplot-2.4.1}/src/docs/previews/heatmap3d.html +0 -0
- {seraplot-2.4.0 → seraplot-2.4.1}/src/docs/previews/histogram-overlay.html +0 -0
- {seraplot-2.4.0 → seraplot-2.4.1}/src/docs/previews/histogram.html +0 -0
- {seraplot-2.4.0 → seraplot-2.4.1}/src/docs/previews/kde.html +0 -0
- {seraplot-2.4.0 → seraplot-2.4.1}/src/docs/previews/kde3d.html +0 -0
- {seraplot-2.4.0 → seraplot-2.4.1}/src/docs/previews/line.html +0 -0
- {seraplot-2.4.0 → seraplot-2.4.1}/src/docs/previews/line3d.html +0 -0
- {seraplot-2.4.0 → seraplot-2.4.1}/src/docs/previews/lollipop.html +0 -0
- {seraplot-2.4.0 → seraplot-2.4.1}/src/docs/previews/lollipop3d.html +0 -0
- {seraplot-2.4.0 → seraplot-2.4.1}/src/docs/previews/multiline.html +0 -0
- {seraplot-2.4.0 → seraplot-2.4.1}/src/docs/previews/parallel.html +0 -0
- {seraplot-2.4.0 → seraplot-2.4.1}/src/docs/previews/pie.html +0 -0
- {seraplot-2.4.0 → seraplot-2.4.1}/src/docs/previews/pie3d.html +0 -0
- {seraplot-2.4.0 → seraplot-2.4.1}/src/docs/previews/radar.html +0 -0
- {seraplot-2.4.0 → seraplot-2.4.1}/src/docs/previews/radar3d.html +0 -0
- {seraplot-2.4.0 → seraplot-2.4.1}/src/docs/previews/ridgeline.html +0 -0
- {seraplot-2.4.0 → seraplot-2.4.1}/src/docs/previews/ridgeline3d.html +0 -0
- {seraplot-2.4.0 → seraplot-2.4.1}/src/docs/previews/scatter.html +0 -0
- {seraplot-2.4.0 → seraplot-2.4.1}/src/docs/previews/scatter3d.html +0 -0
- {seraplot-2.4.0 → seraplot-2.4.1}/src/docs/previews/slideshow.html +0 -0
- {seraplot-2.4.0 → seraplot-2.4.1}/src/docs/previews/slope.html +0 -0
- {seraplot-2.4.0 → seraplot-2.4.1}/src/docs/previews/stacked-bar.html +0 -0
- {seraplot-2.4.0 → seraplot-2.4.1}/src/docs/previews/stacked-bar3d.html +0 -0
- {seraplot-2.4.0 → seraplot-2.4.1}/src/docs/previews/sunburst.html +0 -0
- {seraplot-2.4.0 → seraplot-2.4.1}/src/docs/previews/sunburst3d.html +0 -0
- {seraplot-2.4.0 → seraplot-2.4.1}/src/docs/previews/treemap.html +0 -0
- {seraplot-2.4.0 → seraplot-2.4.1}/src/docs/previews/violin.html +0 -0
- {seraplot-2.4.0 → seraplot-2.4.1}/src/docs/previews/violin3d.html +0 -0
- {seraplot-2.4.0 → seraplot-2.4.1}/src/docs/previews/waterfall.html +0 -0
- {seraplot-2.4.0 → seraplot-2.4.1}/src/docs/previews/wordcloud.html +0 -0
- {seraplot-2.4.0 → seraplot-2.4.1}/src/docs/theme/custom.css +0 -0
- {seraplot-2.4.0 → seraplot-2.4.1}/src/docs/theme/donate-popup.js +0 -0
- {seraplot-2.4.0 → seraplot-2.4.1}/src/docs/theme/lang-switcher.js +0 -0
- {seraplot-2.4.0 → seraplot-2.4.1}/src/docs/tooling/index.md +0 -0
- {seraplot-2.4.0 → seraplot-2.4.1}/src/docs/tooling/vscode.md +0 -0
- {seraplot-2.4.0 → seraplot-2.4.1}/src/html/assets.rs +0 -0
- {seraplot-2.4.0 → seraplot-2.4.1}/src/html/fast_builders.rs +0 -0
- {seraplot-2.4.0 → seraplot-2.4.1}/src/html/fast_exporter.rs +0 -0
- {seraplot-2.4.0 → seraplot-2.4.1}/src/html/hover.rs +0 -0
- {seraplot-2.4.0 → seraplot-2.4.1}/src/html/html_export.rs +0 -0
- {seraplot-2.4.0 → seraplot-2.4.1}/src/html/html_template.rs +0 -0
- {seraplot-2.4.0 → seraplot-2.4.1}/src/html/js_3d.rs +0 -0
- {seraplot-2.4.0 → seraplot-2.4.1}/src/html/mod.rs +0 -0
- {seraplot-2.4.0 → seraplot-2.4.1}/src/lib.rs +0 -0
- {seraplot-2.4.0 → seraplot-2.4.1}/src/ml/anomaly/isolation_forest.rs +0 -0
- {seraplot-2.4.0 → seraplot-2.4.1}/src/ml/anomaly/mod.rs +0 -0
- {seraplot-2.4.0 → seraplot-2.4.1}/src/ml/cache.rs +0 -0
- {seraplot-2.4.0 → seraplot-2.4.1}/src/ml/decomposition/mod.rs +0 -0
- {seraplot-2.4.0 → seraplot-2.4.1}/src/ml/decomposition/pca.rs +0 -0
- {seraplot-2.4.0 → seraplot-2.4.1}/src/ml/linalg.rs +0 -0
- {seraplot-2.4.0 → seraplot-2.4.1}/src/ml/linear/elastic_net.rs +0 -0
- {seraplot-2.4.0 → seraplot-2.4.1}/src/ml/linear/lasso.rs +0 -0
- {seraplot-2.4.0 → seraplot-2.4.1}/src/ml/linear/logistic.rs +0 -0
- {seraplot-2.4.0 → seraplot-2.4.1}/src/ml/linear/mod.rs +0 -0
- {seraplot-2.4.0 → seraplot-2.4.1}/src/ml/linear/ols.rs +0 -0
- {seraplot-2.4.0 → seraplot-2.4.1}/src/ml/linear/ridge.rs +0 -0
- {seraplot-2.4.0 → seraplot-2.4.1}/src/ml/linear/sgd.rs +0 -0
- {seraplot-2.4.0 → seraplot-2.4.1}/src/ml/metrics/classification.rs +0 -0
- {seraplot-2.4.0 → seraplot-2.4.1}/src/ml/metrics/clustering.rs +0 -0
- {seraplot-2.4.0 → seraplot-2.4.1}/src/ml/metrics/mod.rs +0 -0
- {seraplot-2.4.0 → seraplot-2.4.1}/src/ml/metrics/regression.rs +0 -0
- {seraplot-2.4.0 → seraplot-2.4.1}/src/ml/mod.rs +0 -0
- {seraplot-2.4.0 → seraplot-2.4.1}/src/ml/model_selection/cross_val.rs +0 -0
- {seraplot-2.4.0 → seraplot-2.4.1}/src/ml/model_selection/grid_search.rs +0 -0
- {seraplot-2.4.0 → seraplot-2.4.1}/src/ml/model_selection/mod.rs +0 -0
- {seraplot-2.4.0 → seraplot-2.4.1}/src/ml/model_selection/permutation.rs +0 -0
- {seraplot-2.4.0 → seraplot-2.4.1}/src/ml/model_selection/split.rs +0 -0
- {seraplot-2.4.0 → seraplot-2.4.1}/src/ml/naive_bayes/bernoulli.rs +0 -0
- {seraplot-2.4.0 → seraplot-2.4.1}/src/ml/naive_bayes/gaussian.rs +0 -0
- {seraplot-2.4.0 → seraplot-2.4.1}/src/ml/naive_bayes/mod.rs +0 -0
- {seraplot-2.4.0 → seraplot-2.4.1}/src/ml/naive_bayes/multinomial.rs +0 -0
- {seraplot-2.4.0 → seraplot-2.4.1}/src/ml/neighbors/knn.rs +0 -0
- {seraplot-2.4.0 → seraplot-2.4.1}/src/ml/neighbors/mod.rs +0 -0
- {seraplot-2.4.0 → seraplot-2.4.1}/src/ml/preprocessing/encoders.rs +0 -0
- {seraplot-2.4.0 → seraplot-2.4.1}/src/ml/preprocessing/mod.rs +0 -0
- {seraplot-2.4.0 → seraplot-2.4.1}/src/ml/preprocessing/scalers.rs +0 -0
- {seraplot-2.4.0 → seraplot-2.4.1}/src/ml/preprocessing/transformers.rs +0 -0
- {seraplot-2.4.0 → seraplot-2.4.1}/src/ml/svm/mod.rs +0 -0
- {seraplot-2.4.0 → seraplot-2.4.1}/src/ml/svm/svm.rs +0 -0
- {seraplot-2.4.0 → seraplot-2.4.1}/src/ml/tree/adaboost.rs +0 -0
- {seraplot-2.4.0 → seraplot-2.4.1}/src/ml/tree/decision_tree.rs +0 -0
- {seraplot-2.4.0 → seraplot-2.4.1}/src/ml/tree/decision_tree_backup.rs +0 -0
- {seraplot-2.4.0 → seraplot-2.4.1}/src/ml/tree/gradient_boosting.rs +0 -0
- {seraplot-2.4.0 → seraplot-2.4.1}/src/ml/tree/mod.rs +0 -0
- {seraplot-2.4.0 → seraplot-2.4.1}/src/ml/tree/random_forest.rs +0 -0
- {seraplot-2.4.0 → seraplot-2.4.1}/src/plot/camera.rs +0 -0
- {seraplot-2.4.0 → seraplot-2.4.1}/src/plot/canvas.rs +0 -0
- {seraplot-2.4.0 → seraplot-2.4.1}/src/plot/containers_3d.rs +0 -0
- {seraplot-2.4.0 → seraplot-2.4.1}/src/plot/controller/chart_controller.rs +0 -0
- {seraplot-2.4.0 → seraplot-2.4.1}/src/plot/controller/mod.rs +0 -0
- {seraplot-2.4.0 → seraplot-2.4.1}/src/plot/controller/plot_3d_controller.rs +0 -0
- {seraplot-2.4.0 → seraplot-2.4.1}/src/plot/default/_3d/bar_3d.rs +0 -0
- {seraplot-2.4.0 → seraplot-2.4.1}/src/plot/default/_3d/line_3d.rs +0 -0
- {seraplot-2.4.0 → seraplot-2.4.1}/src/plot/default/_3d/mod.rs +0 -0
- {seraplot-2.4.0 → seraplot-2.4.1}/src/plot/default/_3d/plot_3d_types.rs +0 -0
- {seraplot-2.4.0 → seraplot-2.4.1}/src/plot/default/_3d/scatter_3d.rs +0 -0
- {seraplot-2.4.0 → seraplot-2.4.1}/src/plot/default/bar.rs +0 -0
- {seraplot-2.4.0 → seraplot-2.4.1}/src/plot/default/chart.rs +0 -0
- {seraplot-2.4.0 → seraplot-2.4.1}/src/plot/default/kmeans.rs +0 -0
- {seraplot-2.4.0 → seraplot-2.4.1}/src/plot/default/line.rs +0 -0
- {seraplot-2.4.0 → seraplot-2.4.1}/src/plot/default/mod.rs +0 -0
- {seraplot-2.4.0 → seraplot-2.4.1}/src/plot/default/scatter.rs +0 -0
- {seraplot-2.4.0 → seraplot-2.4.1}/src/plot/default/svg.rs +0 -0
- {seraplot-2.4.0 → seraplot-2.4.1}/src/plot/generic.rs +0 -0
- {seraplot-2.4.0 → seraplot-2.4.1}/src/plot/map/_3d/globe.rs +0 -0
- {seraplot-2.4.0 → seraplot-2.4.1}/src/plot/map/_3d/globe_html.rs +0 -0
- {seraplot-2.4.0 → seraplot-2.4.1}/src/plot/map/_3d/globe_types.rs +0 -0
- {seraplot-2.4.0 → seraplot-2.4.1}/src/plot/map/_3d/mod.rs +0 -0
- {seraplot-2.4.0 → seraplot-2.4.1}/src/plot/map/bubble_map.rs +0 -0
- {seraplot-2.4.0 → seraplot-2.4.1}/src/plot/map/chart.rs +0 -0
- {seraplot-2.4.0 → seraplot-2.4.1}/src/plot/map/choropleth.rs +0 -0
- {seraplot-2.4.0 → seraplot-2.4.1}/src/plot/map/mod.rs +0 -0
- {seraplot-2.4.0 → seraplot-2.4.1}/src/plot/map/svg_parser.rs +0 -0
- {seraplot-2.4.0 → seraplot-2.4.1}/src/plot/map/world_data.rs +0 -0
- {seraplot-2.4.0 → seraplot-2.4.1}/src/plot/mod.rs +0 -0
- {seraplot-2.4.0 → seraplot-2.4.1}/src/plot/projection.rs +0 -0
- {seraplot-2.4.0 → seraplot-2.4.1}/src/plot/renderers.rs +0 -0
- {seraplot-2.4.0 → seraplot-2.4.1}/src/plot/scale_renderer.rs +0 -0
- {seraplot-2.4.0 → seraplot-2.4.1}/src/plot/seaborn/_3d/mod.rs +0 -0
- {seraplot-2.4.0 → seraplot-2.4.1}/src/plot/seaborn/_3d/plot_3d_types.rs +0 -0
- {seraplot-2.4.0 → seraplot-2.4.1}/src/plot/seaborn/chart.rs +0 -0
- {seraplot-2.4.0 → seraplot-2.4.1}/src/plot/seaborn/mod.rs +0 -0
- {seraplot-2.4.0 → seraplot-2.4.1}/src/plot/statistical/_3d/candlestick3d.rs +0 -0
- {seraplot-2.4.0 → seraplot-2.4.1}/src/plot/statistical/_3d/dumbbell3d.rs +0 -0
- {seraplot-2.4.0 → seraplot-2.4.1}/src/plot/statistical/_3d/funnel3d.rs +0 -0
- {seraplot-2.4.0 → seraplot-2.4.1}/src/plot/statistical/_3d/heatmap3d.rs +0 -0
- {seraplot-2.4.0 → seraplot-2.4.1}/src/plot/statistical/_3d/kde3d.rs +0 -0
- {seraplot-2.4.0 → seraplot-2.4.1}/src/plot/statistical/_3d/lollipop3d.rs +0 -0
- {seraplot-2.4.0 → seraplot-2.4.1}/src/plot/statistical/_3d/mod.rs +0 -0
- {seraplot-2.4.0 → seraplot-2.4.1}/src/plot/statistical/_3d/pie3d.rs +0 -0
- {seraplot-2.4.0 → seraplot-2.4.1}/src/plot/statistical/_3d/plot_3d_types.rs +0 -0
- {seraplot-2.4.0 → seraplot-2.4.1}/src/plot/statistical/_3d/radar3d.rs +0 -0
- {seraplot-2.4.0 → seraplot-2.4.1}/src/plot/statistical/_3d/ridgeline3d.rs +0 -0
- {seraplot-2.4.0 → seraplot-2.4.1}/src/plot/statistical/_3d/stacked_bar3d.rs +0 -0
- {seraplot-2.4.0 → seraplot-2.4.1}/src/plot/statistical/_3d/sunburst3d.rs +0 -0
- {seraplot-2.4.0 → seraplot-2.4.1}/src/plot/statistical/_3d/violin3d.rs +0 -0
- {seraplot-2.4.0 → seraplot-2.4.1}/src/plot/statistical/area.rs +0 -0
- {seraplot-2.4.0 → seraplot-2.4.1}/src/plot/statistical/boxplot.rs +0 -0
- {seraplot-2.4.0 → seraplot-2.4.1}/src/plot/statistical/bubble.rs +0 -0
- {seraplot-2.4.0 → seraplot-2.4.1}/src/plot/statistical/bullet.rs +0 -0
- {seraplot-2.4.0 → seraplot-2.4.1}/src/plot/statistical/candlestick.rs +0 -0
- {seraplot-2.4.0 → seraplot-2.4.1}/src/plot/statistical/common.rs +0 -0
- {seraplot-2.4.0 → seraplot-2.4.1}/src/plot/statistical/dumbbell.rs +0 -0
- {seraplot-2.4.0 → seraplot-2.4.1}/src/plot/statistical/funnel.rs +0 -0
- {seraplot-2.4.0 → seraplot-2.4.1}/src/plot/statistical/gauge.rs +0 -0
- {seraplot-2.4.0 → seraplot-2.4.1}/src/plot/statistical/grouped_bar.rs +0 -0
- {seraplot-2.4.0 → seraplot-2.4.1}/src/plot/statistical/heatmap.rs +0 -0
- {seraplot-2.4.0 → seraplot-2.4.1}/src/plot/statistical/histogram.rs +0 -0
- {seraplot-2.4.0 → seraplot-2.4.1}/src/plot/statistical/kde.rs +0 -0
- {seraplot-2.4.0 → seraplot-2.4.1}/src/plot/statistical/lollipop.rs +0 -0
- {seraplot-2.4.0 → seraplot-2.4.1}/src/plot/statistical/mod.rs +0 -0
- {seraplot-2.4.0 → seraplot-2.4.1}/src/plot/statistical/multiline.rs +0 -0
- {seraplot-2.4.0 → seraplot-2.4.1}/src/plot/statistical/parallel.rs +0 -0
- {seraplot-2.4.0 → seraplot-2.4.1}/src/plot/statistical/pie.rs +0 -0
- {seraplot-2.4.0 → seraplot-2.4.1}/src/plot/statistical/radar.rs +0 -0
- {seraplot-2.4.0 → seraplot-2.4.1}/src/plot/statistical/ridgeline.rs +0 -0
- {seraplot-2.4.0 → seraplot-2.4.1}/src/plot/statistical/slope.rs +0 -0
- {seraplot-2.4.0 → seraplot-2.4.1}/src/plot/statistical/sunburst.rs +0 -0
- {seraplot-2.4.0 → seraplot-2.4.1}/src/plot/statistical/treemap.rs +0 -0
- {seraplot-2.4.0 → seraplot-2.4.1}/src/plot/statistical/violin.rs +0 -0
- {seraplot-2.4.0 → seraplot-2.4.1}/src/plot/statistical/waterfall.rs +0 -0
- {seraplot-2.4.0 → seraplot-2.4.1}/src/plot/statistical/wordcloud.rs +0 -0
- {seraplot-2.4.0 → seraplot-2.4.1}/src/viewer/cache.rs +0 -0
- {seraplot-2.4.0 → seraplot-2.4.1}/src/viewer/chart.rs +0 -0
- {seraplot-2.4.0 → seraplot-2.4.1}/src/viewer/gui.rs +0 -0
- {seraplot-2.4.0 → seraplot-2.4.1}/src/viewer/hybrid.rs +0 -0
- {seraplot-2.4.0 → seraplot-2.4.1}/src/viewer/manager/button_manager.rs +0 -0
- {seraplot-2.4.0 → seraplot-2.4.1}/src/viewer/manager/mod.rs +0 -0
- {seraplot-2.4.0 → seraplot-2.4.1}/src/viewer/mod.rs +0 -0
- {seraplot-2.4.0 → seraplot-2.4.1}/src/viewer/render/advanced_render.rs +0 -0
- {seraplot-2.4.0 → seraplot-2.4.1}/src/viewer/render/fast_render_gui.rs +0 -0
- {seraplot-2.4.0 → seraplot-2.4.1}/src/viewer/render/mod.rs +0 -0
- {seraplot-2.4.0 → seraplot-2.4.1}/src/viewer/render/pipeline.rs +0 -0
- {seraplot-2.4.0 → seraplot-2.4.1}/src/viewer/render/viewer_3d.rs +0 -0
- {seraplot-2.4.0 → seraplot-2.4.1}/src/viewer/render/wiki_viewer.rs +0 -0
- {seraplot-2.4.0 → seraplot-2.4.1}/src/viewer/utils/image_loader.rs +0 -0
- {seraplot-2.4.0 → seraplot-2.4.1}/src/viewer/utils/mod.rs +0 -0
- {seraplot-2.4.0 → seraplot-2.4.1}/src/wiki/api.rs +0 -0
- {seraplot-2.4.0 → seraplot-2.4.1}/src/wiki/extractor.rs +0 -0
- {seraplot-2.4.0 → seraplot-2.4.1}/src/wiki/language.rs +0 -0
- {seraplot-2.4.0 → seraplot-2.4.1}/src/wiki/macros.rs +0 -0
- {seraplot-2.4.0 → seraplot-2.4.1}/src/wiki/metadata.rs +0 -0
- {seraplot-2.4.0 → seraplot-2.4.1}/src/wiki/mod.rs +0 -0
- {seraplot-2.4.0 → seraplot-2.4.1}/test_accuracy.py +0 -0
- {seraplot-2.4.0 → seraplot-2.4.1}/test_universal_ml.js +0 -0
|
@@ -1,6 +1,6 @@
|
|
|
1
1
|
[package]
|
|
2
2
|
name = "seraplot"
|
|
3
|
-
version = "2.4.
|
|
3
|
+
version = "2.4.1"
|
|
4
4
|
edition = "2021"
|
|
5
5
|
authors = ["feur25"]
|
|
6
6
|
description = "Rust data visualization framework - The modern Plotly alternative"
|
|
@@ -44,6 +44,14 @@ ffi = ["dep:egui"]
|
|
|
44
44
|
all = ["python"]
|
|
45
45
|
pyo3 = ["dep:pyo3"]
|
|
46
46
|
|
|
47
|
+
[[example]]
|
|
48
|
+
name = "csv_test"
|
|
49
|
+
path = "examples/csv_test.rs"
|
|
50
|
+
|
|
51
|
+
[[example]]
|
|
52
|
+
name = "csv_viewer"
|
|
53
|
+
path = "examples/csv_viewer.rs"
|
|
54
|
+
|
|
47
55
|
[profile.release]
|
|
48
56
|
lto = "thin"
|
|
49
57
|
codegen-units = 1
|
|
@@ -1,6 +1,6 @@
|
|
|
1
1
|
Metadata-Version: 2.4
|
|
2
2
|
Name: seraplot
|
|
3
|
-
Version: 2.4.
|
|
3
|
+
Version: 2.4.1
|
|
4
4
|
Classifier: Development Status :: 5 - Production/Stable
|
|
5
5
|
Classifier: Environment :: Win32 (MS Windows)
|
|
6
6
|
Classifier: Intended Audience :: Developers
|
|
@@ -30,42 +30,47 @@ License: MIT
|
|
|
30
30
|
Requires-Python: >=3.8
|
|
31
31
|
Description-Content-Type: text/markdown; charset=UTF-8; variant=GFM
|
|
32
32
|
|
|
33
|
-
SeraPlot
|
|
33
|
+
SeraPlot — High-Performance Data Visualization & ML Framework
|
|
34
34
|
|
|
35
|
-
SeraPlot is a framework
|
|
36
|
-
alternative to Plotly, designed specifically for data visualization. This library is distributed
|
|
37
|
-
across multiple programming languages (Python, C#, C++, JavaScript), regularly maintained and
|
|
38
|
-
updated, offering superior speed and significantly lower memory consumption compared to competitors.
|
|
35
|
+
**SeraPlot v2.4.0+** is a production-grade framework written in **Rust**, delivering blazing-fast interactive charts and built-in machine learning pipelines. Designed as a modern alternative to Plotly + scikit-learn, it combines visualization and ML preprocessing in a single Rust binary — no dependencies, no bloat.
|
|
39
36
|
|
|
40
|
-
|
|
37
|
+
📖 **Documentation:** https://feur25.github.io/seraplot/introduction.html
|
|
41
38
|
|
|
42
39
|
---
|
|
43
40
|
|
|
44
|
-
|
|
41
|
+
## Why Choose SeraPlot?
|
|
45
42
|
|
|
46
|
-
|
|
47
|
-
|
|
48
|
-
|
|
49
|
-
|
|
50
|
-
|
|
51
|
-
|
|
43
|
+
**100–8000× faster** than Plotly & Matplotlib on chart generation
|
|
44
|
+
**Minimal memory footprint** — runs on edge devices, embedded systems, low-power servers
|
|
45
|
+
**Production-ready** — enterprise-grade stability, zero fluff, maximum efficiency
|
|
46
|
+
**Multi-language** — Python, JavaScript/WebAssembly, C/C++, C#
|
|
47
|
+
**60+ chart types** — 2D, 3D, maps, statistical plots, all GPU-accelerated
|
|
48
|
+
**ML preprocessing & metrics** — StandardScaler with Welford `partial_fit` (online learning), Pipeline with `score`/`predict_proba`/`decision_function`, OneHotEncoder/OrdinalEncoder with incremental category union
|
|
49
|
+
**WebAssembly** — npm package `@seraplot/wasm` for browser visualization & ML inference
|
|
50
|
+
**Streaming data** — online scalers and encoders for incremental model training
|
|
52
51
|
|
|
53
52
|
---
|
|
54
|
-
|
|
55
|
-
|
|
53
|
+
|
|
54
|
+
## Installation
|
|
55
|
+
|
|
56
|
+
**Python** (PyPI — wheel for CPython 3.11+)
|
|
56
57
|
|
|
57
58
|
```bash
|
|
58
59
|
pip install seraplot
|
|
59
60
|
```
|
|
60
61
|
|
|
61
|
-
|
|
62
|
-
|
|
62
|
+
Alternative package managers:
|
|
63
63
|
```bash
|
|
64
64
|
conda install -c conda-forge seraplot
|
|
65
|
+
uv pip install seraplot
|
|
65
66
|
```
|
|
67
|
+
|
|
68
|
+
**JavaScript/WebAssembly** (npm)
|
|
69
|
+
|
|
66
70
|
```bash
|
|
67
|
-
|
|
71
|
+
npm install seraplot
|
|
68
72
|
```
|
|
73
|
+
|
|
69
74
|
---
|
|
70
75
|
|
|
71
76
|
### Gallery — Chart Types
|
|
@@ -91,20 +96,4 @@ uv pip install seraplot
|
|
|
91
96
|
|  |  |  |
|
|
92
97
|
|
|
93
98
|
**SeraPlot outperforms Plotly and Matplotlib by 100–8000× on chart generation speed.**
|
|
94
|
-
|
|
95
|
-
---
|
|
96
|
-
|
|
97
|
-
### Quick Start
|
|
98
|
-
|
|
99
|
-
```python
|
|
100
|
-
from seraplot import build_bar_chart
|
|
101
|
-
|
|
102
|
-
# Create a simple bar chart
|
|
103
|
-
build_bar_chart(
|
|
104
|
-
'Sales by Region',
|
|
105
|
-
['North', 'South', 'East', 'West'],
|
|
106
|
-
[120, 95, 150, 110],
|
|
107
|
-
width=900, height=500
|
|
108
|
-
)
|
|
109
|
-
```
|
|
110
99
|
|
|
@@ -1,39 +1,44 @@
|
|
|
1
|
-
SeraPlot
|
|
1
|
+
SeraPlot — High-Performance Data Visualization & ML Framework
|
|
2
2
|
|
|
3
|
-
SeraPlot is a framework
|
|
4
|
-
alternative to Plotly, designed specifically for data visualization. This library is distributed
|
|
5
|
-
across multiple programming languages (Python, C#, C++, JavaScript), regularly maintained and
|
|
6
|
-
updated, offering superior speed and significantly lower memory consumption compared to competitors.
|
|
3
|
+
**SeraPlot v2.4.0+** is a production-grade framework written in **Rust**, delivering blazing-fast interactive charts and built-in machine learning pipelines. Designed as a modern alternative to Plotly + scikit-learn, it combines visualization and ML preprocessing in a single Rust binary — no dependencies, no bloat.
|
|
7
4
|
|
|
8
|
-
|
|
5
|
+
📖 **Documentation:** https://feur25.github.io/seraplot/introduction.html
|
|
9
6
|
|
|
10
7
|
---
|
|
11
8
|
|
|
12
|
-
|
|
9
|
+
## Why Choose SeraPlot?
|
|
13
10
|
|
|
14
|
-
|
|
15
|
-
|
|
16
|
-
|
|
17
|
-
|
|
18
|
-
|
|
19
|
-
|
|
11
|
+
**100–8000× faster** than Plotly & Matplotlib on chart generation
|
|
12
|
+
**Minimal memory footprint** — runs on edge devices, embedded systems, low-power servers
|
|
13
|
+
**Production-ready** — enterprise-grade stability, zero fluff, maximum efficiency
|
|
14
|
+
**Multi-language** — Python, JavaScript/WebAssembly, C/C++, C#
|
|
15
|
+
**60+ chart types** — 2D, 3D, maps, statistical plots, all GPU-accelerated
|
|
16
|
+
**ML preprocessing & metrics** — StandardScaler with Welford `partial_fit` (online learning), Pipeline with `score`/`predict_proba`/`decision_function`, OneHotEncoder/OrdinalEncoder with incremental category union
|
|
17
|
+
**WebAssembly** — npm package `@seraplot/wasm` for browser visualization & ML inference
|
|
18
|
+
**Streaming data** — online scalers and encoders for incremental model training
|
|
20
19
|
|
|
21
20
|
---
|
|
22
|
-
|
|
23
|
-
|
|
21
|
+
|
|
22
|
+
## Installation
|
|
23
|
+
|
|
24
|
+
**Python** (PyPI — wheel for CPython 3.11+)
|
|
24
25
|
|
|
25
26
|
```bash
|
|
26
27
|
pip install seraplot
|
|
27
28
|
```
|
|
28
29
|
|
|
29
|
-
|
|
30
|
-
|
|
30
|
+
Alternative package managers:
|
|
31
31
|
```bash
|
|
32
32
|
conda install -c conda-forge seraplot
|
|
33
|
+
uv pip install seraplot
|
|
33
34
|
```
|
|
35
|
+
|
|
36
|
+
**JavaScript/WebAssembly** (npm)
|
|
37
|
+
|
|
34
38
|
```bash
|
|
35
|
-
|
|
39
|
+
npm install seraplot
|
|
36
40
|
```
|
|
41
|
+
|
|
37
42
|
---
|
|
38
43
|
|
|
39
44
|
### Gallery — Chart Types
|
|
@@ -59,19 +64,3 @@ uv pip install seraplot
|
|
|
59
64
|
|  |  |  |
|
|
60
65
|
|
|
61
66
|
**SeraPlot outperforms Plotly and Matplotlib by 100–8000× on chart generation speed.**
|
|
62
|
-
|
|
63
|
-
---
|
|
64
|
-
|
|
65
|
-
### Quick Start
|
|
66
|
-
|
|
67
|
-
```python
|
|
68
|
-
from seraplot import build_bar_chart
|
|
69
|
-
|
|
70
|
-
# Create a simple bar chart
|
|
71
|
-
build_bar_chart(
|
|
72
|
-
'Sales by Region',
|
|
73
|
-
['North', 'South', 'East', 'West'],
|
|
74
|
-
[120, 95, 150, 110],
|
|
75
|
-
width=900, height=500
|
|
76
|
-
)
|
|
77
|
-
```
|
|
Binary file
|
|
Binary file
|
|
@@ -0,0 +1,203 @@
|
|
|
1
|
+
# AdaBoost — Adaptive Boosting
|
|
2
|
+
|
|
3
|
+
<div class="lang-en">
|
|
4
|
+
|
|
5
|
+
## API Reference
|
|
6
|
+
|
|
7
|
+
```python
|
|
8
|
+
clf = sp.AdaBoostClassifier(n_estimators=50, learning_rate=1.0, max_depth=1)
|
|
9
|
+
reg = sp.AdaBoostRegressor(n_estimators=50, learning_rate=1.0, max_depth=1)
|
|
10
|
+
|
|
11
|
+
clf.fit(X, y)
|
|
12
|
+
clf.predict(X) -> list[int]
|
|
13
|
+
clf.predict_proba(X) -> ndarray (n, K)
|
|
14
|
+
clf.score(X, y) -> float
|
|
15
|
+
clf.get_params() -> dict
|
|
16
|
+
clf.set_params(n_estimators=100, learning_rate=0.5, max_depth=3)
|
|
17
|
+
|
|
18
|
+
reg.fit(X, y)
|
|
19
|
+
reg.predict(X) -> list[float]
|
|
20
|
+
reg.score(X, y) -> float
|
|
21
|
+
```
|
|
22
|
+
|
|
23
|
+
## Constructor Parameters
|
|
24
|
+
|
|
25
|
+
| Parameter | Type | Default | Description |
|
|
26
|
+
|-----------|------|---------|-------------|
|
|
27
|
+
| `n_estimators` | `int` | `50` | Maximum number of weak learners |
|
|
28
|
+
| `learning_rate` | `float` | `1.0` | Shrinkage parameter $\nu$ for learner contribution |
|
|
29
|
+
| `max_depth` | `int` | `1` | Max tree depth; `1` = stumps, `>1` = full trees |
|
|
30
|
+
|
|
31
|
+
## Attributes
|
|
32
|
+
|
|
33
|
+
| Attribute | Type | Description |
|
|
34
|
+
|-----------|------|-------------|
|
|
35
|
+
| `classes_` | `list[int]` | Unique class labels (classifier only) |
|
|
36
|
+
| `n_estimators_` | `int` | Number of estimators used |
|
|
37
|
+
| `learning_rate_` | `float` | Shrinkage parameter |
|
|
38
|
+
| `max_depth_` | `int` | Tree depth setting |
|
|
39
|
+
|
|
40
|
+
## Example
|
|
41
|
+
|
|
42
|
+
```python
|
|
43
|
+
import seraplot as sp
|
|
44
|
+
import numpy as np
|
|
45
|
+
|
|
46
|
+
X = np.random.randn(500, 5)
|
|
47
|
+
y = np.random.randint(0, 3, 500)
|
|
48
|
+
|
|
49
|
+
clf = sp.AdaBoostClassifier(n_estimators=100, learning_rate=0.8, max_depth=3)
|
|
50
|
+
clf.fit(X, y)
|
|
51
|
+
|
|
52
|
+
proba = clf.predict_proba(X)
|
|
53
|
+
score = clf.score(X, y)
|
|
54
|
+
print(f"Accuracy: {score:.4f}, Class probs shape: {np.array(proba).shape}")
|
|
55
|
+
```
|
|
56
|
+
|
|
57
|
+
---
|
|
58
|
+
|
|
59
|
+
## Algorithmic Functioning
|
|
60
|
+
|
|
61
|
+
**AdaBoost.M1** (multi-class Adaptive Boosting) combines weak learners by iteratively re-weighting misclassified samples.
|
|
62
|
+
|
|
63
|
+
**Initialization** — uniform sample weights:
|
|
64
|
+
|
|
65
|
+
$$w_i^{(1)} = \frac{1}{n}, \quad i = 1, \ldots, n$$
|
|
66
|
+
|
|
67
|
+
**Iteration** $m = 1, \ldots, M$:
|
|
68
|
+
|
|
69
|
+
**1.** Fit weak learner $h_m$ (stump or tree) on weighted dataset.
|
|
70
|
+
|
|
71
|
+
**2.** Compute weighted error:
|
|
72
|
+
|
|
73
|
+
$$\varepsilon_m = \sum_{i=1}^n w_i^{(m)} \cdot \mathbb{1}\bigl[h_m(x_i) \neq y_i\bigr]$$
|
|
74
|
+
|
|
75
|
+
**3.** If $\varepsilon_m \geq 1 - \frac{1}{K}$ (worse than random for $K$ classes), stop.
|
|
76
|
+
|
|
77
|
+
**4.** Compute learner weight:
|
|
78
|
+
|
|
79
|
+
$$\alpha_m = \nu \left[\frac{1}{2}\ln\left(\frac{1 - \varepsilon_m}{\varepsilon_m}\right) + \ln(K - 1)\right]$$
|
|
80
|
+
|
|
81
|
+
where $\nu$ is `learning_rate` and $K = |\text{classes}|$.
|
|
82
|
+
|
|
83
|
+
**5.** Update weights (down-weight correct predictions):
|
|
84
|
+
|
|
85
|
+
$$w_i^{(m+1)} \propto w_i^{(m)} \exp\left(-\alpha_m \mathbb{1}\bigl[h_m(x_i) = y_i\bigr]\right)$$
|
|
86
|
+
|
|
87
|
+
Renormalize: $\sum_i w_i^{(m+1)} = 1$.
|
|
88
|
+
|
|
89
|
+
**Final classifier** — weighted majority:
|
|
90
|
+
|
|
91
|
+
$$F(x) = \arg\max_c \sum_{m: h_m(x) = c} \alpha_m$$
|
|
92
|
+
|
|
93
|
+
**Regressor (AdaBoost.R2)** — weak learners fit to residuals with exponential loss reweighting; final prediction is weighted median.
|
|
94
|
+
|
|
95
|
+
### Weak Learners
|
|
96
|
+
|
|
97
|
+
- `max_depth=1`: **Decision stumps** (1-level trees) — fast, O(n log p) per iteration
|
|
98
|
+
- `max_depth>1`: **Full decision trees** — more expressive, captures non-linear splits
|
|
99
|
+
|
|
100
|
+
---
|
|
101
|
+
|
|
102
|
+
</div>
|
|
103
|
+
|
|
104
|
+
<div class="lang-fr">
|
|
105
|
+
|
|
106
|
+
## Référence API
|
|
107
|
+
|
|
108
|
+
```python
|
|
109
|
+
clf = sp.AdaBoostClassifier(n_estimators=50, learning_rate=1.0, max_depth=1)
|
|
110
|
+
reg = sp.AdaBoostRegressor(n_estimators=50, learning_rate=1.0, max_depth=1)
|
|
111
|
+
|
|
112
|
+
clf.fit(X, y)
|
|
113
|
+
clf.predict(X) -> list[int]
|
|
114
|
+
clf.predict_proba(X) -> ndarray (n, K)
|
|
115
|
+
clf.score(X, y) -> float
|
|
116
|
+
clf.get_params() -> dict
|
|
117
|
+
clf.set_params(n_estimators=100, learning_rate=0.5, max_depth=3)
|
|
118
|
+
|
|
119
|
+
reg.fit(X, y)
|
|
120
|
+
reg.predict(X) -> list[float]
|
|
121
|
+
reg.score(X, y) -> float
|
|
122
|
+
```
|
|
123
|
+
|
|
124
|
+
## Paramètres du constructeur
|
|
125
|
+
|
|
126
|
+
| Paramètre | Type | Défaut | Description |
|
|
127
|
+
|-----------|------|--------|-------------|
|
|
128
|
+
| `n_estimators` | `int` | `50` | Nombre maximum d'apprenants faibles |
|
|
129
|
+
| `learning_rate` | `float` | `1.0` | Paramètre de rétrécissement $\nu$ |
|
|
130
|
+
| `max_depth` | `int` | `1` | Profondeur max; `1` = stumps, `>1` = arbres |
|
|
131
|
+
|
|
132
|
+
## Attributs
|
|
133
|
+
|
|
134
|
+
| Attribut | Type | Description |
|
|
135
|
+
|----------|------|-------------|
|
|
136
|
+
| `classes_` | `list[int]` | Labels de classes uniques |
|
|
137
|
+
| `n_estimators_` | `int` | Nombre d'estimateurs utilisés |
|
|
138
|
+
| `learning_rate_` | `float` | Paramètre de rétrécissement |
|
|
139
|
+
| `max_depth_` | `int` | Profondeur d'arbre |
|
|
140
|
+
|
|
141
|
+
## Exemple
|
|
142
|
+
|
|
143
|
+
```python
|
|
144
|
+
import seraplot as sp
|
|
145
|
+
import numpy as np
|
|
146
|
+
|
|
147
|
+
X = np.random.randn(500, 5)
|
|
148
|
+
y = np.random.randint(0, 3, 500)
|
|
149
|
+
|
|
150
|
+
clf = sp.AdaBoostClassifier(n_estimators=100, learning_rate=0.8, max_depth=3)
|
|
151
|
+
clf.fit(X, y)
|
|
152
|
+
|
|
153
|
+
proba = clf.predict_proba(X)
|
|
154
|
+
score = clf.score(X, y)
|
|
155
|
+
print(f"Précision: {score:.4f}, Shape proba: {np.array(proba).shape}")
|
|
156
|
+
```
|
|
157
|
+
|
|
158
|
+
---
|
|
159
|
+
|
|
160
|
+
## Fonctionnement algorithmique
|
|
161
|
+
|
|
162
|
+
**AdaBoost.M1** (Adaptive Boosting multi-classe) combine des apprenants faibles par re-pondération itérative des échantillons mal classés.
|
|
163
|
+
|
|
164
|
+
**Initialisation** — poids uniformes:
|
|
165
|
+
|
|
166
|
+
$$w_i^{(1)} = \frac{1}{n}, \quad i = 1, \ldots, n$$
|
|
167
|
+
|
|
168
|
+
**Itération** $m = 1, \ldots, M$:
|
|
169
|
+
|
|
170
|
+
**1.** Ajuster l'apprenant faible $h_m$ sur l'ensemble pondéré.
|
|
171
|
+
|
|
172
|
+
**2.** Calculer l'erreur pondérée:
|
|
173
|
+
|
|
174
|
+
$$\varepsilon_m = \sum_{i=1}^n w_i^{(m)} \cdot \mathbb{1}\bigl[h_m(x_i) \neq y_i\bigr]$$
|
|
175
|
+
|
|
176
|
+
**3.** Si $\varepsilon_m \geq 1 - \frac{1}{K}$ (pire qu'aléatoire), arrêter.
|
|
177
|
+
|
|
178
|
+
**4.** Calculer le poids de l'apprenant:
|
|
179
|
+
|
|
180
|
+
$$\alpha_m = \nu \left[\frac{1}{2}\ln\left(\frac{1 - \varepsilon_m}{\varepsilon_m}\right) + \ln(K - 1)\right]$$
|
|
181
|
+
|
|
182
|
+
où $\nu$ est `learning_rate` et $K = |\text{classes}|$.
|
|
183
|
+
|
|
184
|
+
**5.** Mettre à jour les poids (diminuer les bonnes prédictions):
|
|
185
|
+
|
|
186
|
+
$$w_i^{(m+1)} \propto w_i^{(m)} \exp\left(-\alpha_m \mathbb{1}\bigl[h_m(x_i) = y_i\bigr]\right)$$
|
|
187
|
+
|
|
188
|
+
Renormaliser: $\sum_i w_i^{(m+1)} = 1$.
|
|
189
|
+
|
|
190
|
+
**Classificateur final** — vote pondéré:
|
|
191
|
+
|
|
192
|
+
$$F(x) = \arg\max_c \sum_{m: h_m(x) = c} \alpha_m$$
|
|
193
|
+
|
|
194
|
+
**Régresseur (AdaBoost.R2)** — apprenants faibles ajustés aux résidus; prédiction finale = médiane pondérée.
|
|
195
|
+
|
|
196
|
+
### Apprenants faibles
|
|
197
|
+
|
|
198
|
+
- `max_depth=1`: **Decision stumps** (arbres 1-niveau) — rapide, O(n log p) par itération
|
|
199
|
+
- `max_depth>1`: **Arbres complets** — plus expressif, capture les splits non-linéaires
|
|
200
|
+
|
|
201
|
+
---
|
|
202
|
+
|
|
203
|
+
</div>
|
|
@@ -0,0 +1,203 @@
|
|
|
1
|
+
# DBSCAN Class
|
|
2
|
+
|
|
3
|
+
<div class="lang-en">
|
|
4
|
+
|
|
5
|
+
## API Reference
|
|
6
|
+
|
|
7
|
+
```python
|
|
8
|
+
model = sp.DBSCAN(eps=0.5, min_samples=5)
|
|
9
|
+
|
|
10
|
+
model.fit(X) -> None
|
|
11
|
+
model.fit_predict(X) -> list[int]
|
|
12
|
+
|
|
13
|
+
model.labels_ -> list[int]
|
|
14
|
+
model.n_clusters_ -> int
|
|
15
|
+
model.n_noise_ -> int
|
|
16
|
+
```
|
|
17
|
+
|
|
18
|
+
## Constructor Parameters
|
|
19
|
+
|
|
20
|
+
| Parameter | Type | Default | Description |
|
|
21
|
+
|-----------|------|---------|-------------|
|
|
22
|
+
| `eps` | `float` | `0.5` | Neighborhood radius threshold $\epsilon$ |
|
|
23
|
+
| `min_samples` | `int` | `5` | Minimum points to form a dense core |
|
|
24
|
+
|
|
25
|
+
## Methods
|
|
26
|
+
|
|
27
|
+
| Method | Signature | Returns | Description |
|
|
28
|
+
|--------|-----------|---------|-------------|
|
|
29
|
+
| `fit(X)` | `fit(X: list[list[float]])` | `None` | Fit DBSCAN on N-dimensional data, populates `labels_`, `n_clusters_`, `n_noise_` |
|
|
30
|
+
| `fit_predict(X)` | `fit_predict(X: list[list[float]])` | `list[int]` | Fit and return cluster labels (convenience wrapper) |
|
|
31
|
+
|
|
32
|
+
## Attributes
|
|
33
|
+
|
|
34
|
+
| Attribute | Type | Description |
|
|
35
|
+
|-----------|------|-------------|
|
|
36
|
+
| `labels_` | `list[int]` | Cluster label per point (`-1` = noise) |
|
|
37
|
+
| `n_clusters_` | `int` | Number of identified clusters (noise not counted) |
|
|
38
|
+
| `n_noise_` | `int` | Count of noise points (label $-1$) |
|
|
39
|
+
|
|
40
|
+
## Example
|
|
41
|
+
|
|
42
|
+
```python
|
|
43
|
+
import seraplot as sp
|
|
44
|
+
import numpy as np
|
|
45
|
+
|
|
46
|
+
data = np.random.randn(100, 3)
|
|
47
|
+
|
|
48
|
+
model = sp.DBSCAN(eps=0.8, min_samples=5)
|
|
49
|
+
labels = model.fit_predict(data.tolist())
|
|
50
|
+
|
|
51
|
+
print(f"Clusters: {model.n_clusters_}, Noise: {model.n_noise_}")
|
|
52
|
+
print(f"Labels shape: {len(labels)}")
|
|
53
|
+
|
|
54
|
+
x, y, z = data[:, 0].tolist(), data[:, 1].tolist(), data[:, 2].tolist()
|
|
55
|
+
color_groups = [str(lbl) for lbl in labels]
|
|
56
|
+
|
|
57
|
+
chart = sp.build_dbscan_chart_3d(
|
|
58
|
+
f"DBSCAN ({model.n_clusters_} clusters)",
|
|
59
|
+
x, y, z,
|
|
60
|
+
eps=0.8, min_samples=5,
|
|
61
|
+
color_groups=color_groups
|
|
62
|
+
)
|
|
63
|
+
```
|
|
64
|
+
|
|
65
|
+
---
|
|
66
|
+
|
|
67
|
+
## Algorithmic Functioning
|
|
68
|
+
|
|
69
|
+
DBSCAN (**Density-Based Spatial Clustering of Applications with Noise**) groups points in dense regions and marks isolated points as noise.
|
|
70
|
+
|
|
71
|
+
**Core concepts** — for point $p$:
|
|
72
|
+
|
|
73
|
+
- **$\epsilon$-neighborhood:** $N_\epsilon(p) = \{q \in D : \|p - q\|_2 \leq \epsilon\}$
|
|
74
|
+
- **Core point:** $|N_\epsilon(p)| \geq \text{min\_samples}$
|
|
75
|
+
- **Border point:** not core, but within $\epsilon$ of a core point
|
|
76
|
+
- **Noise point:** not reachable from any core point → label $-1$
|
|
77
|
+
|
|
78
|
+
**Algorithm:**
|
|
79
|
+
|
|
80
|
+
1. For each unvisited point $p$:
|
|
81
|
+
- If $p$ is core, start a new cluster via **BFS** (expand through density-connected neighbors)
|
|
82
|
+
- Otherwise, mark as noise (or leave unvisited)
|
|
83
|
+
|
|
84
|
+
2. Clusters are maximal sets of density-connected points.
|
|
85
|
+
|
|
86
|
+
**Implementation:**
|
|
87
|
+
|
|
88
|
+
SeraPlot uses **KD-tree** for $O(\log n)$ radius queries and **parallel BFS** with SIMD distance acceleration. `n_clusters_` counts only true clusters; noise points are excluded.
|
|
89
|
+
|
|
90
|
+
**Complexity:** $O(n \log n)$ average time; $O(n^2)$ worst case.
|
|
91
|
+
|
|
92
|
+
---
|
|
93
|
+
|
|
94
|
+
## See also
|
|
95
|
+
|
|
96
|
+
- [DBSCAN Chart (2D)](dbscan.md)
|
|
97
|
+
- [DBSCAN 3D Chart](dbscan3d.md)
|
|
98
|
+
|
|
99
|
+
---
|
|
100
|
+
|
|
101
|
+
</div>
|
|
102
|
+
|
|
103
|
+
<div class="lang-fr">
|
|
104
|
+
|
|
105
|
+
## Référence API
|
|
106
|
+
|
|
107
|
+
```python
|
|
108
|
+
model = sp.DBSCAN(eps=0.5, min_samples=5)
|
|
109
|
+
|
|
110
|
+
model.fit(X) -> None
|
|
111
|
+
model.fit_predict(X) -> list[int]
|
|
112
|
+
|
|
113
|
+
model.labels_ -> list[int]
|
|
114
|
+
model.n_clusters_ -> int
|
|
115
|
+
model.n_noise_ -> int
|
|
116
|
+
```
|
|
117
|
+
|
|
118
|
+
## Paramètres du constructeur
|
|
119
|
+
|
|
120
|
+
| Paramètre | Type | Défaut | Description |
|
|
121
|
+
|-----------|------|--------|-------------|
|
|
122
|
+
| `eps` | `float` | `0.5` | Rayon de voisinage $\epsilon$ |
|
|
123
|
+
| `min_samples` | `int` | `5` | Points min pour former un cœur |
|
|
124
|
+
|
|
125
|
+
## Méthodes
|
|
126
|
+
|
|
127
|
+
| Méthode | Signature | Retourne | Description |
|
|
128
|
+
|---------|-----------|----------|-------------|
|
|
129
|
+
| `fit(X)` | `fit(X: list[list[float]])` | `None` | Ajuste DBSCAN, remplit `labels_`, `n_clusters_`, `n_noise_` |
|
|
130
|
+
| `fit_predict(X)` | `fit_predict(X: list[list[float]])` | `list[int]` | Ajuste et retourne labels |
|
|
131
|
+
|
|
132
|
+
## Attributs
|
|
133
|
+
|
|
134
|
+
| Attribut | Type | Description |
|
|
135
|
+
|----------|------|-------------|
|
|
136
|
+
| `labels_` | `list[int]` | Label de cluster par point (`-1` = bruit) |
|
|
137
|
+
| `n_clusters_` | `int` | Nombre de clusters (bruit non compté) |
|
|
138
|
+
| `n_noise_` | `int` | Nombre de points bruit (label $-1$) |
|
|
139
|
+
|
|
140
|
+
## Exemple
|
|
141
|
+
|
|
142
|
+
```python
|
|
143
|
+
import seraplot as sp
|
|
144
|
+
import numpy as np
|
|
145
|
+
|
|
146
|
+
data = np.random.randn(100, 3)
|
|
147
|
+
|
|
148
|
+
model = sp.DBSCAN(eps=0.8, min_samples=5)
|
|
149
|
+
labels = model.fit_predict(data.tolist())
|
|
150
|
+
|
|
151
|
+
print(f"Clusters: {model.n_clusters_}, Bruit: {model.n_noise_}")
|
|
152
|
+
|
|
153
|
+
x, y, z = data[:, 0].tolist(), data[:, 1].tolist(), data[:, 2].tolist()
|
|
154
|
+
color_groups = [str(lbl) for lbl in labels]
|
|
155
|
+
|
|
156
|
+
chart = sp.build_dbscan_chart_3d(
|
|
157
|
+
f"DBSCAN ({model.n_clusters_} clusters)",
|
|
158
|
+
x, y, z,
|
|
159
|
+
eps=0.8, min_samples=5,
|
|
160
|
+
color_groups=color_groups
|
|
161
|
+
)
|
|
162
|
+
```
|
|
163
|
+
|
|
164
|
+
---
|
|
165
|
+
|
|
166
|
+
## Fonctionnement algorithmique
|
|
167
|
+
|
|
168
|
+
DBSCAN groupe les points dans les **régions denses** et marque les points isolés comme bruit.
|
|
169
|
+
|
|
170
|
+
**Concepts clés** — pour un point $p$:
|
|
171
|
+
|
|
172
|
+
- **$\epsilon$-voisinage:** $N_\epsilon(p) = \{q \in D : \|p - q\|_2 \leq \epsilon\}$
|
|
173
|
+
- **Point cœur:** $|N_\epsilon(p)| \geq \text{min\_samples}$
|
|
174
|
+
- **Point frontière:** non cœur, mais dans $\epsilon$ d'un point cœur
|
|
175
|
+
- **Point bruit:** non accessible depuis aucun point cœur → label $-1$
|
|
176
|
+
|
|
177
|
+
**Algorithme:**
|
|
178
|
+
|
|
179
|
+
1. Pour chaque point $p$ non visité:
|
|
180
|
+
- Si $p$ est cœur, démarrer cluster via **BFS**
|
|
181
|
+
- Sinon, marquer comme bruit
|
|
182
|
+
|
|
183
|
+
2. Les clusters sont ensembles maximaux de points densément connexes.
|
|
184
|
+
|
|
185
|
+
**Implémentation:**
|
|
186
|
+
|
|
187
|
+
SeraPlot utilise **KD-tree** pour $O(\log n)$ requêtes de rayon et **BFS parallèle** avec accélération SIMD. `n_clusters_` ne compte que vrais clusters; bruit exclu.
|
|
188
|
+
|
|
189
|
+
**Complexité:** $O(n \log n)$ en moyenne; $O(n^2)$ pire cas.
|
|
190
|
+
|
|
191
|
+
---
|
|
192
|
+
|
|
193
|
+
## Voir aussi
|
|
194
|
+
|
|
195
|
+
- [Graphique DBSCAN (2D)](dbscan.md)
|
|
196
|
+
- [Graphique DBSCAN 3D](dbscan3d.md)
|
|
197
|
+
|
|
198
|
+
---
|
|
199
|
+
|
|
200
|
+
</div>
|
|
201
|
+
|
|
202
|
+
|
|
203
|
+
|