seolpyo-mplchart 0.1.3.4__tar.gz → 1.0.1__tar.gz
This diff represents the content of publicly available package versions that have been released to one of the supported registries. The information contained in this diff is provided for informational purposes only and reflects changes between package versions as they appear in their respective public registries.
Potentially problematic release.
This version of seolpyo-mplchart might be problematic. Click here for more details.
- {seolpyo_mplchart-0.1.3.4/seolpyo_mplchart.egg-info → seolpyo_mplchart-1.0.1}/PKG-INFO +5 -9
- seolpyo_mplchart-1.0.1/README.md +22 -0
- {seolpyo_mplchart-0.1.3.4 → seolpyo_mplchart-1.0.1}/pyproject.toml +2 -2
- seolpyo_mplchart-1.0.1/seolpyo_mplchart/__init__.py +271 -0
- seolpyo_mplchart-1.0.1/seolpyo_mplchart/base.py +114 -0
- seolpyo_mplchart-1.0.1/seolpyo_mplchart/cursor.py +422 -0
- seolpyo_mplchart-1.0.1/seolpyo_mplchart/draw.py +522 -0
- seolpyo_mplchart-1.0.1/seolpyo_mplchart/slider.py +559 -0
- seolpyo_mplchart-1.0.1/seolpyo_mplchart/test.py +11 -0
- {seolpyo_mplchart-0.1.3.4 → seolpyo_mplchart-1.0.1}/seolpyo_mplchart/utils.py +15 -4
- {seolpyo_mplchart-0.1.3.4 → seolpyo_mplchart-1.0.1/seolpyo_mplchart.egg-info}/PKG-INFO +5 -9
- {seolpyo_mplchart-0.1.3.4 → seolpyo_mplchart-1.0.1}/seolpyo_mplchart.egg-info/SOURCES.txt +1 -3
- seolpyo_mplchart-0.1.3.4/README.md +0 -26
- seolpyo_mplchart-0.1.3.4/seolpyo_mplchart/__init__.py +0 -120
- seolpyo_mplchart-0.1.3.4/seolpyo_mplchart/base.py +0 -111
- seolpyo_mplchart-0.1.3.4/seolpyo_mplchart/cursor.py +0 -448
- seolpyo_mplchart-0.1.3.4/seolpyo_mplchart/data/apple.txt +0 -64187
- seolpyo_mplchart-0.1.3.4/seolpyo_mplchart/data/samsung.txt +0 -120002
- seolpyo_mplchart-0.1.3.4/seolpyo_mplchart/draw.py +0 -371
- seolpyo_mplchart-0.1.3.4/seolpyo_mplchart/slider.py +0 -550
- seolpyo_mplchart-0.1.3.4/seolpyo_mplchart/test.py +0 -38
- {seolpyo_mplchart-0.1.3.4 → seolpyo_mplchart-1.0.1}/MANIFEST.in +0 -0
- {seolpyo_mplchart-0.1.3.4 → seolpyo_mplchart-1.0.1}/seolpyo_mplchart.egg-info/dependency_links.txt +0 -0
- {seolpyo_mplchart-0.1.3.4 → seolpyo_mplchart-1.0.1}/seolpyo_mplchart.egg-info/requires.txt +0 -0
- {seolpyo_mplchart-0.1.3.4 → seolpyo_mplchart-1.0.1}/seolpyo_mplchart.egg-info/top_level.txt +0 -0
- {seolpyo_mplchart-0.1.3.4 → seolpyo_mplchart-1.0.1}/setup.cfg +0 -0
|
@@ -1,6 +1,6 @@
|
|
|
1
1
|
Metadata-Version: 2.2
|
|
2
2
|
Name: seolpyo-mplchart
|
|
3
|
-
Version: 0.1
|
|
3
|
+
Version: 1.0.1
|
|
4
4
|
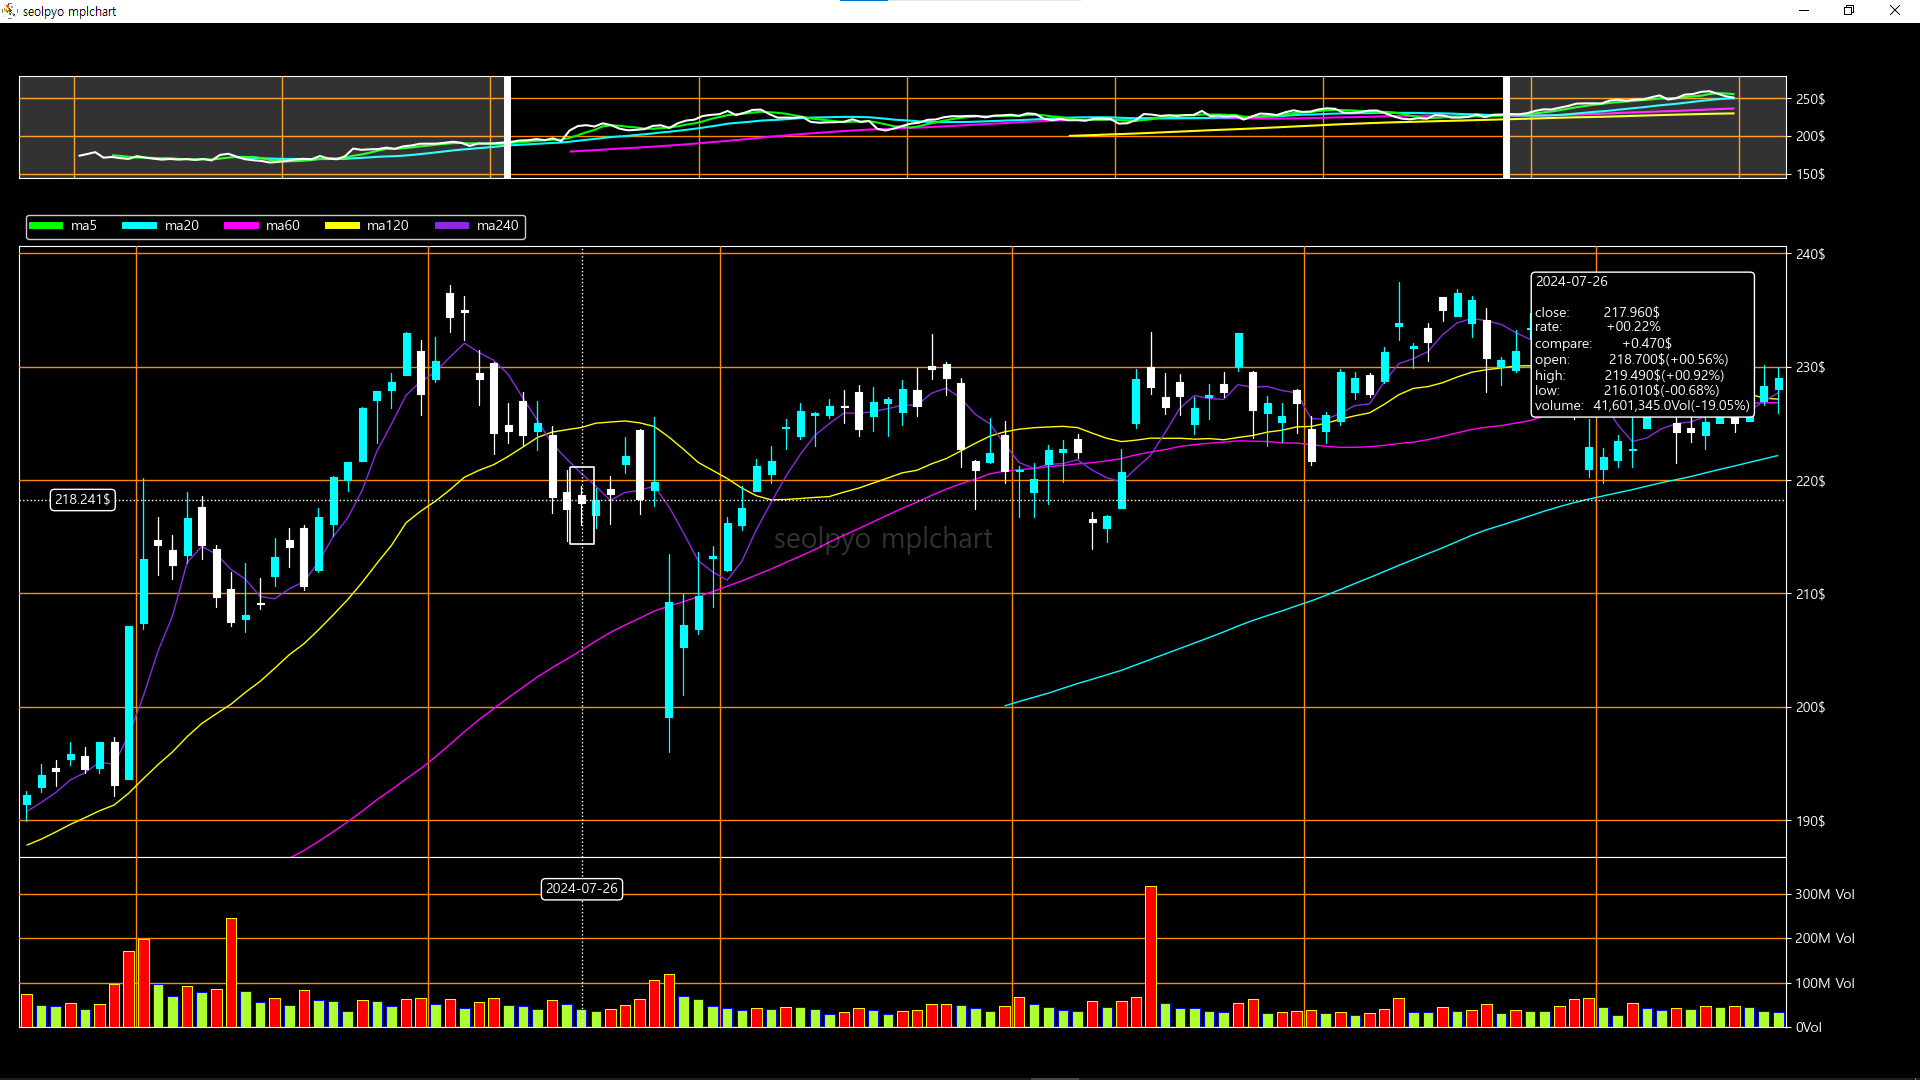
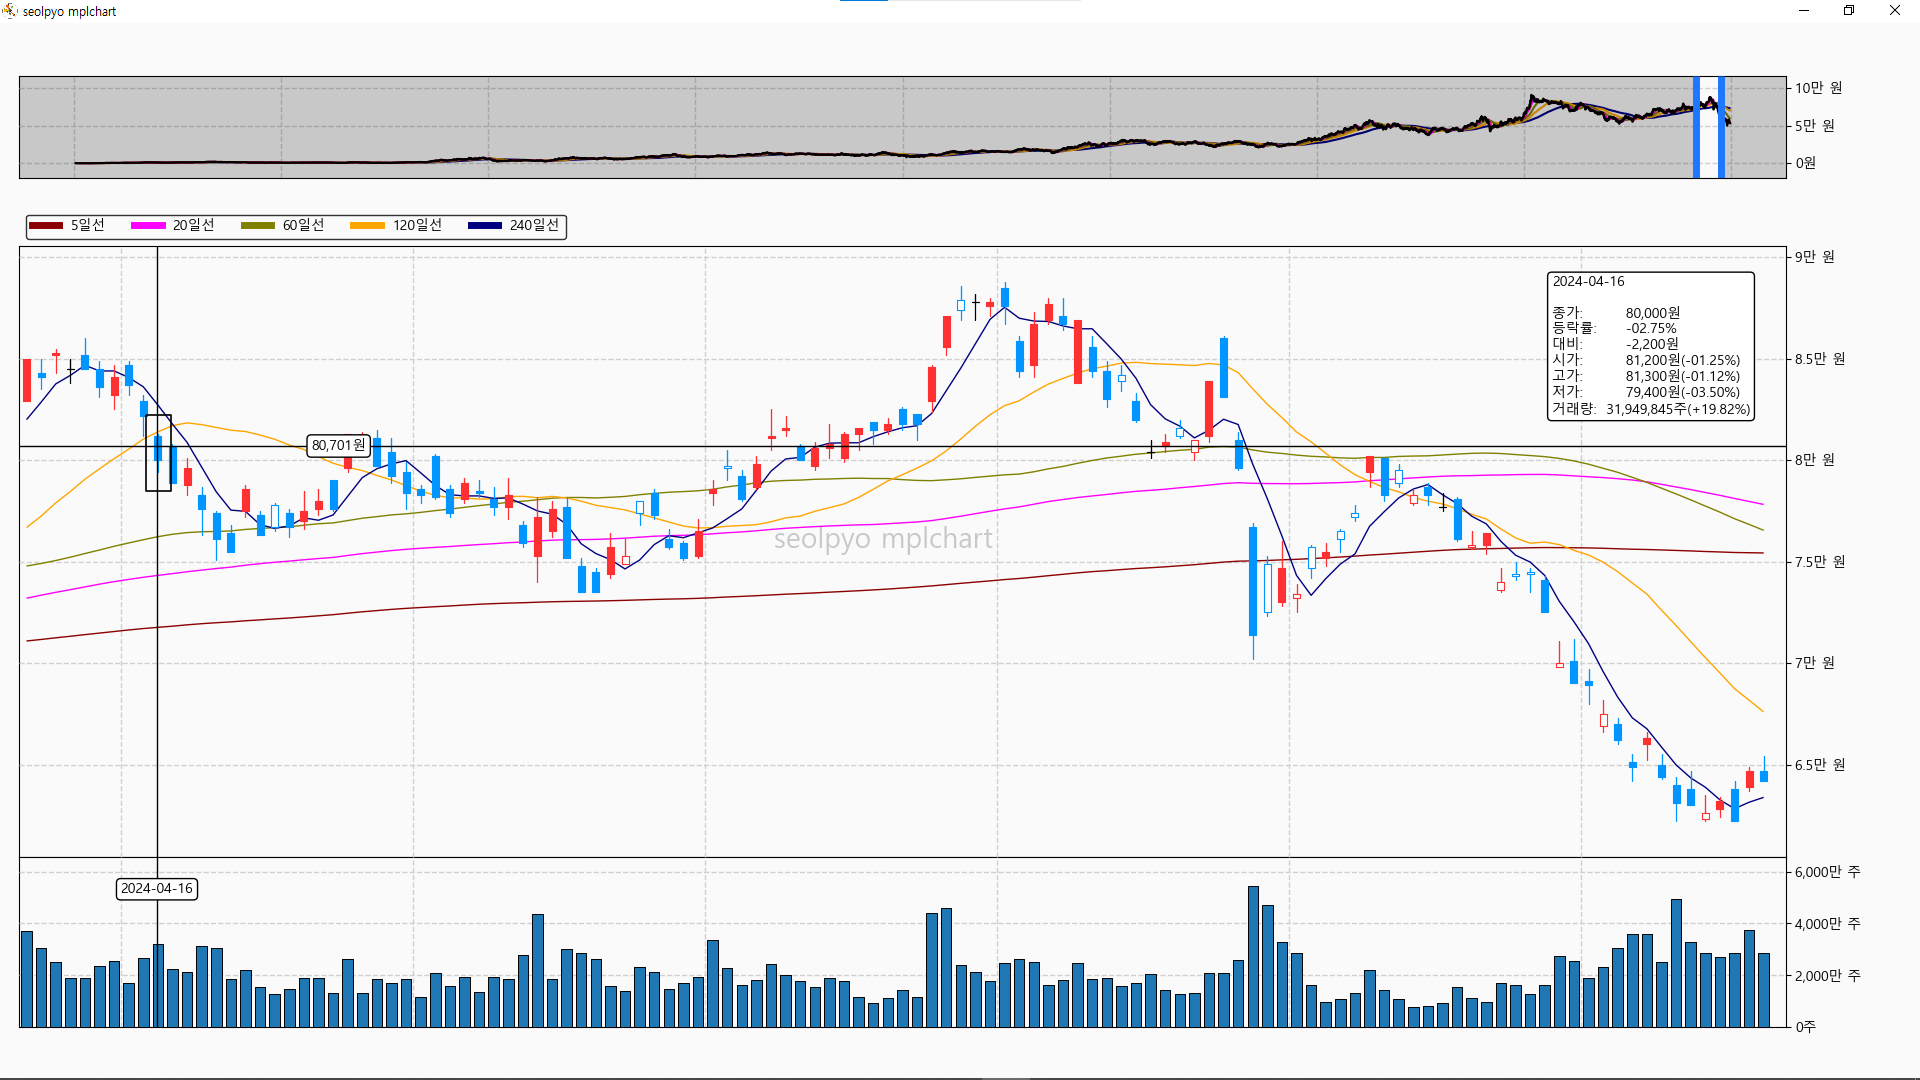
Summary: Fast candlestick chart using Python. Includes navigator, slider, navigation, and text information display functions
|
|
5
5
|
Author-email: white-seolpyo <white-seolpyo@naver.com>
|
|
6
6
|
License: MIT License
|
|
@@ -38,16 +38,12 @@ Ethereum: 0x1c5fb8a5e0b1153cd4116c91736bd16fabf83520
|
|
|
38
38
|
|
|
39
39
|
|
|
40
40
|
# Sample
|
|
41
|
-
|
|
42
41
|
|
|
43
42
|
|
|
44
|
-

|
|
43
|
+
|
|
46
44
|
|
|
47
|
-
|
|
45
|
+
|
|
48
46
|
|
|
49
|
-
|
|
50
48
|
|
|
51
|
-
|
|
@@ -0,0 +1,22 @@
|
|
|
1
|
+
# Donation
|
|
2
|
+
Bitcoin: 1MKCHW8smDZv5DFMiVkA5G3DeXcMn871ZX
|
|
3
|
+
|
|
4
|
+
Ethereum: 0x1c5fb8a5e0b1153cd4116c91736bd16fabf83520
|
|
5
|
+
|
|
6
|
+
|
|
7
|
+
# Document
|
|
8
|
+
[English](https://white.seolpyo.com/entry/148/)
|
|
9
|
+
|
|
10
|
+
[한글](https://white.seolpyo.com/entry/147/)
|
|
11
|
+
|
|
12
|
+
|
|
13
|
+
# Sample
|
|
14
|
+

|
|
15
|
+
|
|
16
|
+

|
|
17
|
+
|
|
18
|
+

|
|
19
|
+
|
|
20
|
+

|
|
21
|
+
|
|
22
|
+

|
|
@@ -8,7 +8,7 @@ build-backend = "setuptools.build_meta"
|
|
|
8
8
|
|
|
9
9
|
[project]
|
|
10
10
|
name = "seolpyo-mplchart"
|
|
11
|
-
version = "0.1
|
|
11
|
+
version = "1.0.1"
|
|
12
12
|
dependencies = [
|
|
13
13
|
"matplotlib >= 3.7.0",
|
|
14
14
|
"pandas >= 2.0.0",
|
|
@@ -49,6 +49,6 @@ Issues = "https://github.com/white-seolpyo/seolpyo-mplchart/issues"
|
|
|
49
49
|
[tool.setuptools]
|
|
50
50
|
packages = [
|
|
51
51
|
"seolpyo_mplchart",
|
|
52
|
-
"seolpyo_mplchart.
|
|
52
|
+
"seolpyo_mplchart.sample",
|
|
53
53
|
]
|
|
54
54
|
|
|
@@ -0,0 +1,271 @@
|
|
|
1
|
+
import json
|
|
2
|
+
from typing import Literal
|
|
3
|
+
from pathlib import Path
|
|
4
|
+
|
|
5
|
+
import matplotlib.pyplot as plt
|
|
6
|
+
import pandas as pd
|
|
7
|
+
|
|
8
|
+
from .draw import Chart as BaseChart
|
|
9
|
+
from .cursor import Chart as BaseCursorChart, format_candleinfo_ko, format_volumeinfo_ko, format_candleinfo_en, format_volumeinfo_en
|
|
10
|
+
from .slider import Chart as BaseSliderChart
|
|
11
|
+
|
|
12
|
+
|
|
13
|
+
__all__ = [
|
|
14
|
+
'path_samsung', 'path_apple',
|
|
15
|
+
'format_candleinfo_ko', 'format_volumeinfo_ko',
|
|
16
|
+
'format_candleinfo_en', 'format_volumeinfo_en',
|
|
17
|
+
'sample', 'switch_backend', 'show', 'close',
|
|
18
|
+
'Chart', 'CursorChart', 'SliderChart',
|
|
19
|
+
]
|
|
20
|
+
|
|
21
|
+
|
|
22
|
+
path_samsung = Path(__file__).parent / 'sample/samsung.txt'
|
|
23
|
+
path_apple = Path(__file__).parent / 'sample/apple.txt'
|
|
24
|
+
|
|
25
|
+
def sample(stock: Literal['samsung', 'apple']='samsung', chart: Literal['Chart', 'CursorChart', 'SliderChart']='SliderChart'):
|
|
26
|
+
C: BaseSliderChart = {'Chart': BaseChart, 'CursorChart': BaseCursorChart, 'SliderChart': BaseSliderChart}[chart]()
|
|
27
|
+
path_file = path_samsung if stock == 'samsung' else path_apple
|
|
28
|
+
if stock == 'samsung':
|
|
29
|
+
C.format_candleinfo = format_candleinfo_ko
|
|
30
|
+
C.format_volumeinfo = format_volumeinfo_ko
|
|
31
|
+
else:
|
|
32
|
+
C.format_candleinfo = format_candleinfo_en
|
|
33
|
+
C.format_volumeinfo = format_volumeinfo_en
|
|
34
|
+
C.unit_price = '$'
|
|
35
|
+
C.unit_volume = 'Vol'
|
|
36
|
+
C.digit_price = 3
|
|
37
|
+
C.format_ma = 'ma{}'
|
|
38
|
+
|
|
39
|
+
with open(path_file, 'r', encoding='utf-8') as txt:
|
|
40
|
+
data = json.load(txt)
|
|
41
|
+
df = pd.DataFrame(data)
|
|
42
|
+
|
|
43
|
+
C.set_data(df)
|
|
44
|
+
|
|
45
|
+
show()
|
|
46
|
+
close()
|
|
47
|
+
return
|
|
48
|
+
|
|
49
|
+
|
|
50
|
+
def switch_backend(newbackend='TkAgg'):
|
|
51
|
+
"call matplotlib.pyplot.switch_backend(newbackend)"
|
|
52
|
+
return plt.switch_backend(newbackend)
|
|
53
|
+
|
|
54
|
+
|
|
55
|
+
def show(Close=False):
|
|
56
|
+
"""
|
|
57
|
+
call matplotlib.pyplot.show()
|
|
58
|
+
```if Close``` if True, run matplotlib.pyplot.close('all') after window closee.
|
|
59
|
+
"""
|
|
60
|
+
plt.show()
|
|
61
|
+
if Close: close()
|
|
62
|
+
return
|
|
63
|
+
|
|
64
|
+
|
|
65
|
+
def close(fig='all'):
|
|
66
|
+
"call matplotlib.pyplot.close(fig)"
|
|
67
|
+
return plt.close(fig)
|
|
68
|
+
|
|
69
|
+
|
|
70
|
+
class Chart(BaseChart):
|
|
71
|
+
r"""
|
|
72
|
+
You can see the guidance document:
|
|
73
|
+
Korean: https://white.seolpyo.com/entry/147/
|
|
74
|
+
English: https://white.seolpyo.com/entry/148/
|
|
75
|
+
|
|
76
|
+
Quick Start:
|
|
77
|
+
```
|
|
78
|
+
import seolpyo_mplchart as mc
|
|
79
|
+
chart = mc.SliderChart() # Create instance
|
|
80
|
+
chart.set_data(df) # set stock price data
|
|
81
|
+
mc.show() # show chart(run ```matplotlib.pyplot.show()```)
|
|
82
|
+
mc.close() # run ```matplotlib.pyplot.close('close')```
|
|
83
|
+
```
|
|
84
|
+
|
|
85
|
+
Class Variables:
|
|
86
|
+
watermark: watermark text.
|
|
87
|
+
|
|
88
|
+
figsize: Default size when creating a matplotlib window
|
|
89
|
+
ratio_ax_legend, ratio_ax_price, ratio_ax_volume: Axes ratio
|
|
90
|
+
adjust: figure adjust. default ```dict(top=0.95, bottom=0.05, left=0.01, right=0.93, wspace=0, hspace=0)```.
|
|
91
|
+
color_background: color of background. default '#fafafa'.
|
|
92
|
+
gridKwargs: kwargs applied to the grid
|
|
93
|
+
color_tick, color_tick_label: Tick and tick label colors. default ('k', 'k').
|
|
94
|
+
|
|
95
|
+
df: stock data DataFrame.
|
|
96
|
+
date: date column key. default 'date'
|
|
97
|
+
Open, high, low, close: price column key. default ('open', 'high', 'low', 'close')
|
|
98
|
+
volume: volume column key. default 'volume'. If ```if self.volume``` is ```False```, the volume chart is not drawn.
|
|
99
|
+
|
|
100
|
+
format_ma: moving average legend label format. default '{}일선'
|
|
101
|
+
list_ma: Decide how many days to draw the moving average line. default (5, 20, 60, 120, 240)
|
|
102
|
+
list_macolor: Color the moving average line. If the number of colors is greater than the moving average line, black is applied
|
|
103
|
+
|
|
104
|
+
candle_on_ma: Decide whether to draw candles on the moving average line. default ```True```
|
|
105
|
+
|
|
106
|
+
color_up: The color of the candle. When the closing price is greater than the opening price. default '#fe3032'
|
|
107
|
+
color_down: The color of the candle. When the opening price is greater than the opening price. default '#0095ff'
|
|
108
|
+
color_flat: The color of the candle. WWhen the closing price is the same as the opening price. default 'k'
|
|
109
|
+
color_up_down: The color of the candle. If the closing price is greater than the opening price, but is lower than the previous day's closing price. default 'w'
|
|
110
|
+
color_down_up: The color of the candle. If the opening price is greater than the closing price, but is higher than the closing price of the previous day. default 'w'
|
|
111
|
+
colors_volume: The color of the volume bar. default '#1f77b4'
|
|
112
|
+
|
|
113
|
+
color_priceline: The color of the price line. default 'k'
|
|
114
|
+
|
|
115
|
+
facecolor_volume, edgecolor_volume = The color of the volume. default ('#1f77b4', 'k')
|
|
116
|
+
|
|
117
|
+
candle_width_half, volume_width_half: half of the thickness of the candle and volume
|
|
118
|
+
|
|
119
|
+
color_box: The color of the candlebox and volumebox. Used when the mouse is over a candle or volume bar. default 'k'
|
|
120
|
+
|
|
121
|
+
limit_candle: Maximum number of candles to draw. default 800
|
|
122
|
+
limit_wick: Maximum number of candle wicks to draw. default 4,000
|
|
123
|
+
"""
|
|
124
|
+
pass
|
|
125
|
+
|
|
126
|
+
|
|
127
|
+
class CursorChart(BaseCursorChart):
|
|
128
|
+
r"""
|
|
129
|
+
You can see the guidance document:
|
|
130
|
+
Korean: https://white.seolpyo.com/entry/147/
|
|
131
|
+
English: https://white.seolpyo.com/entry/148/
|
|
132
|
+
|
|
133
|
+
Quick Start:
|
|
134
|
+
```
|
|
135
|
+
import seolpyo_mplchart as mc
|
|
136
|
+
chart = mc.SliderChart() # Create instance
|
|
137
|
+
chart.set_data(df) # set stock price data
|
|
138
|
+
mc.show() # show chart(run ```matplotlib.pyplot.show()```)
|
|
139
|
+
mc.close() # run ```matplotlib.pyplot.close('close')```
|
|
140
|
+
```
|
|
141
|
+
|
|
142
|
+
Class Variables:
|
|
143
|
+
watermark: watermark text.
|
|
144
|
+
|
|
145
|
+
unit_price, unit_volume: price and volume unit. default ('원', '주').
|
|
146
|
+
digit_price, digit_volume: display decimal places when displaying price and volume. default (0, 0),
|
|
147
|
+
|
|
148
|
+
figsize: Default size when creating a matplotlib window
|
|
149
|
+
ratio_ax_legend, ratio_ax_price, ratio_ax_volume: Axes ratio
|
|
150
|
+
adjust: figure adjust. default ```dict(top=0.95, bottom=0.05, left=0.01, right=0.93, wspace=0, hspace=0)```.
|
|
151
|
+
color_background: color of background. default '#fafafa'.
|
|
152
|
+
gridKwargs: kwargs applied to the grid
|
|
153
|
+
color_tick, color_tick_label: Tick and tick label colors. default ('k', 'k').
|
|
154
|
+
|
|
155
|
+
df: stock data DataFrame.
|
|
156
|
+
date: date column key. default 'date'
|
|
157
|
+
Open, high, low, close: price column key. default ('open', 'high', 'low', 'close')
|
|
158
|
+
volume: volume column key. default 'volume'. If ```if self.volume``` is ```False```, the volume chart is not drawn.
|
|
159
|
+
|
|
160
|
+
format_ma: moving average legend label format. default '{}일선'
|
|
161
|
+
list_ma: Decide how many days to draw the moving average line. default (5, 20, 60, 120, 240)
|
|
162
|
+
list_macolor: Color the moving average line. If the number of colors is greater than the moving average line, black is applied
|
|
163
|
+
|
|
164
|
+
candle_on_ma: Decide whether to draw candles on the moving average line. default ```True```
|
|
165
|
+
|
|
166
|
+
color_up: The color of the candle. When the closing price is greater than the opening price. default '#fe3032'
|
|
167
|
+
color_down: The color of the candle. When the opening price is greater than the opening price. default '#0095ff'
|
|
168
|
+
color_flat: The color of the candle. WWhen the closing price is the same as the opening price. default 'k'
|
|
169
|
+
color_up_down: The color of the candle. If the closing price is greater than the opening price, but is lower than the previous day's closing price. default 'w'
|
|
170
|
+
color_down_up: The color of the candle. If the opening price is greater than the closing price, but is higher than the closing price of the previous day. default 'w'
|
|
171
|
+
colors_volume: The color of the volume bar. default '#1f77b4'
|
|
172
|
+
|
|
173
|
+
color_priceline: The color of the price line. default 'k'
|
|
174
|
+
|
|
175
|
+
facecolor_volume, edgecolor_volume = The color of the volume. default ('#1f77b4', 'k')
|
|
176
|
+
|
|
177
|
+
candle_width_half, volume_width_half: half of the thickness of the candle and volume
|
|
178
|
+
|
|
179
|
+
color_box: The color of the candlebox and volumebox. Used when the mouse is over a candle or volume bar. default 'k'
|
|
180
|
+
|
|
181
|
+
lineKwargs: kwarg applied to lines drawn based on mouse cursor position
|
|
182
|
+
textboxKwargs: kwarg applied to the info text bbox drawn on the chart. When this is applied, the following occurs: ```textKwargs['bbox'] = textboxKwargs```
|
|
183
|
+
textKwargs: A kwarg that applies to the informational text drawn on the chart. When this is applied, the following occurs: ```textKwargs['bbox'] = textboxKwargs```
|
|
184
|
+
|
|
185
|
+
fraction: Decide whether to express information as a fraction. default False
|
|
186
|
+
format_candleinfo: Candle information text format. default '{dt}\n\n종가: {close}\n등락률: {rate}\n대비: {compare}\n시가: {open}({rate_open})\n고가: {high}({rate_high})\n저가: {low}({rate_low})\n거래량: {volume}({rate_volume})'
|
|
187
|
+
format_volumeinfo: Volume information text format. default '{dt}\n\n거래량 : {volume}\n거래량증가율: {rate_volume}'
|
|
188
|
+
|
|
189
|
+
limit_candle: Maximum number of candles to draw. default 800
|
|
190
|
+
limit_wick: Maximum number of candle wicks to draw. default 4,000
|
|
191
|
+
"""
|
|
192
|
+
pass
|
|
193
|
+
|
|
194
|
+
|
|
195
|
+
class SliderChart(BaseSliderChart):
|
|
196
|
+
r"""
|
|
197
|
+
You can see the guidance document:
|
|
198
|
+
Korean: https://white.seolpyo.com/entry/147/
|
|
199
|
+
English: https://white.seolpyo.com/entry/148/
|
|
200
|
+
|
|
201
|
+
Quick Start:
|
|
202
|
+
```
|
|
203
|
+
import seolpyo_mplchart as mc
|
|
204
|
+
chart = mc.SliderChart() # Create instance
|
|
205
|
+
chart.set_data(df) # set stock price data
|
|
206
|
+
mc.show() # show chart(run ```matplotlib.pyplot.show()```)
|
|
207
|
+
mc.close() # run ```matplotlib.pyplot.close('close')```
|
|
208
|
+
```
|
|
209
|
+
|
|
210
|
+
Class Variables:
|
|
211
|
+
watermark: watermark text.
|
|
212
|
+
|
|
213
|
+
unit_price, unit_volume: price and volume unit. default ('원', '주').
|
|
214
|
+
digit_price, digit_volume: display decimal places when displaying price and volume. default (0, 0),
|
|
215
|
+
|
|
216
|
+
figsize: Default size when creating a matplotlib window
|
|
217
|
+
slider_top: ax_slider is located at the top or bottom. default ```True```.
|
|
218
|
+
ratio_ax_slider, ratio_ax_legend, ratio_ax_price, ratio_ax_volume: Axes ratio
|
|
219
|
+
ratio_ax_none: Ratio between volume chart and slider. Used only when slider_top is ```False```
|
|
220
|
+
adjust: figure adjust. default ```dict(top=0.95, bottom=0.05, left=0.01, right=0.93, wspace=0, hspace=0)```.
|
|
221
|
+
color_background: color of background. default '#fafafa'.
|
|
222
|
+
gridKwargs: kwargs applied to the grid
|
|
223
|
+
color_tick, color_tick_label: Tick and tick label colors. default ('k', 'k').
|
|
224
|
+
|
|
225
|
+
df: stock data DataFrame.
|
|
226
|
+
date: date column key. default 'date'
|
|
227
|
+
Open, high, low, close: price column key. default ('open', 'high', 'low', 'close')
|
|
228
|
+
volume: volume column key. default 'volume'. If ```if self.volume``` is ```False```, the volume chart is not drawn.
|
|
229
|
+
|
|
230
|
+
format_ma: moving average legend label format. default '{}일선'
|
|
231
|
+
list_ma: Decide how many days to draw the moving average line. default (5, 20, 60, 120, 240)
|
|
232
|
+
list_macolor: Color the moving average line. If the number of colors is greater than the moving average line, black is applied
|
|
233
|
+
|
|
234
|
+
candle_on_ma: Decide whether to draw candles on the moving average line. default ```True```
|
|
235
|
+
color_sliderline: Color of closing price line in ax_slider. default 'k'
|
|
236
|
+
color_navigatorline: Color of left and right dividing lines in selected area. default '#1e78ff'
|
|
237
|
+
color_navigator: Color of unselected area. default 'k'
|
|
238
|
+
|
|
239
|
+
color_up: The color of the candle. When the closing price is greater than the opening price. default '#fe3032'
|
|
240
|
+
color_down: The color of the candle. When the opening price is greater than the opening price. default '#0095ff'
|
|
241
|
+
color_flat: The color of the candle. WWhen the closing price is the same as the opening price. default 'k'
|
|
242
|
+
color_up_down: The color of the candle. If the closing price is greater than the opening price, but is lower than the previous day's closing price. default 'w'
|
|
243
|
+
color_down_up: The color of the candle. If the opening price is greater than the closing price, but is higher than the closing price of the previous day. default 'w'
|
|
244
|
+
colors_volume: The color of the volume bar. default '#1f77b4'
|
|
245
|
+
|
|
246
|
+
color_priceline: The color of the price line. default 'k'
|
|
247
|
+
|
|
248
|
+
facecolor_volume, edgecolor_volume = The color of the volume. default ('#1f77b4', 'k')
|
|
249
|
+
|
|
250
|
+
candle_width_half, volume_width_half: half of the thickness of the candle and volume
|
|
251
|
+
|
|
252
|
+
color_box: The color of the candlebox and volumebox. Used when the mouse is over a candle or volume bar. default 'k'
|
|
253
|
+
|
|
254
|
+
lineKwargs: kwarg applied to lines drawn based on mouse cursor position
|
|
255
|
+
textboxKwargs: kwarg applied to the info text bbox drawn on the chart. When this is applied, the following occurs: ```textKwargs['bbox'] = textboxKwargs```
|
|
256
|
+
textKwargs: A kwarg that applies to the informational text drawn on the chart. When this is applied, the following occurs: ```textKwargs['bbox'] = textboxKwargs```
|
|
257
|
+
|
|
258
|
+
fraction: Decide whether to express information as a fraction. default False
|
|
259
|
+
format_candleinfo: Candle information text format. default '{dt}\n\n종가: {close}\n등락률: {rate}\n대비: {compare}\n시가: {open}({rate_open})\n고가: {high}({rate_high})\n저가: {low}({rate_low})\n거래량: {volume}({rate_volume})'
|
|
260
|
+
format_volumeinfo: Volume information text format. default '{dt}\n\n거래량 : {volume}\n거래량증가율: {rate_volume}'
|
|
261
|
+
|
|
262
|
+
min_distance: Minimum number of candles that can be selected with the slider. default 30
|
|
263
|
+
limit_candle: Maximum number of candles to draw. default 800
|
|
264
|
+
limit_wick: Maximum number of candle wicks to draw. default 4,000
|
|
265
|
+
limit_volume: Maximum number of volume bars to draw. default 800. Applies only to drawing candle wicks or price line.
|
|
266
|
+
limit_ma: If the number of displayed data is more than this, the price moving average line is not drawn. default 8,000
|
|
267
|
+
|
|
268
|
+
color_navigator_line: Navigator divider color. default '#1e78ff'
|
|
269
|
+
color_navigator_cover: Unselected slider area color. default = 'k'
|
|
270
|
+
"""
|
|
271
|
+
pass
|
|
@@ -0,0 +1,114 @@
|
|
|
1
|
+
from re import search
|
|
2
|
+
|
|
3
|
+
import matplotlib.pyplot as plt
|
|
4
|
+
import matplotlib.style as mplstyle
|
|
5
|
+
from matplotlib.axes import Axes
|
|
6
|
+
from matplotlib.backends.backend_agg import FigureCanvasAgg
|
|
7
|
+
from matplotlib.figure import Figure as Fig
|
|
8
|
+
|
|
9
|
+
|
|
10
|
+
from .utils import dict_unit, dict_unit_en
|
|
11
|
+
|
|
12
|
+
|
|
13
|
+
try: plt.switch_backend('TkAgg')
|
|
14
|
+
except: pass
|
|
15
|
+
|
|
16
|
+
# 한글 깨짐 문제 방지
|
|
17
|
+
try: plt.rcParams['font.family'] ='Malgun Gothic'
|
|
18
|
+
except: pass
|
|
19
|
+
|
|
20
|
+
mplstyle.use('fast')
|
|
21
|
+
|
|
22
|
+
|
|
23
|
+
def convert_unit(value: float, digit=0, word='원'):
|
|
24
|
+
v = value.__abs__()
|
|
25
|
+
du = dict_unit if search('[가-힣]', word) else dict_unit_en
|
|
26
|
+
for unit, n in du.items():
|
|
27
|
+
if n <= v:
|
|
28
|
+
num = (value / n).__round__(digit)
|
|
29
|
+
if not num % 1: num = int(num)
|
|
30
|
+
return f'{num:,}{unit} {word}'
|
|
31
|
+
value = value.__round__(digit)
|
|
32
|
+
if not value % 1: value = int(value)
|
|
33
|
+
elif value < 10: digit = 2
|
|
34
|
+
text = f'{value:,}{word}'
|
|
35
|
+
return text
|
|
36
|
+
|
|
37
|
+
|
|
38
|
+
class Figure(Fig):
|
|
39
|
+
canvas: FigureCanvasAgg
|
|
40
|
+
|
|
41
|
+
|
|
42
|
+
class Base:
|
|
43
|
+
figure: Figure
|
|
44
|
+
|
|
45
|
+
figsize = (14, 7)
|
|
46
|
+
ratio_ax_legend, ratio_ax_price, ratio_ax_volume = (2, 18, 5)
|
|
47
|
+
adjust = dict(
|
|
48
|
+
top=0.95, bottom=0.05, left=0.01, right=0.93, # 여백
|
|
49
|
+
wspace=0, hspace=0 # 플롯간 간격
|
|
50
|
+
)
|
|
51
|
+
|
|
52
|
+
title = 'seolpyo mplchart'
|
|
53
|
+
color_background = '#fafafa'
|
|
54
|
+
gridKwargs = {}
|
|
55
|
+
color_tick, color_tick_label = ('k', 'k')
|
|
56
|
+
|
|
57
|
+
unit_price, unit_volume = ('원', '주')
|
|
58
|
+
|
|
59
|
+
def __init__(self, *args, **kwargs):
|
|
60
|
+
# 기본 툴바 비활성화
|
|
61
|
+
plt.rcParams['toolbar'] = 'None'
|
|
62
|
+
# plt.rcParams['figure.dpi'] = 600
|
|
63
|
+
|
|
64
|
+
self._get_plot()
|
|
65
|
+
return
|
|
66
|
+
|
|
67
|
+
def _get_plot(self):
|
|
68
|
+
self.figure, axes = plt.subplots(
|
|
69
|
+
3, # row 수
|
|
70
|
+
figsize=self.figsize, # 기본 크기
|
|
71
|
+
height_ratios=(self.ratio_ax_legend, self.ratio_ax_price, self.ratio_ax_volume) # row 크기 비율
|
|
72
|
+
)
|
|
73
|
+
axes: list[Axes]
|
|
74
|
+
self.ax_legend, self.ax_price, self.ax_volume = axes
|
|
75
|
+
self.ax_legend.set_label('legend ax')
|
|
76
|
+
self.ax_price.set_label('price ax')
|
|
77
|
+
self.ax_volume.set_label('volume ax')
|
|
78
|
+
|
|
79
|
+
self.figure.canvas.manager.set_window_title(f'{self.title}')
|
|
80
|
+
self.figure.set_facecolor(self.color_background)
|
|
81
|
+
|
|
82
|
+
# 플롯간 간격 제거(Configure subplots)
|
|
83
|
+
self.figure.subplots_adjust(**self.adjust)
|
|
84
|
+
|
|
85
|
+
self.ax_legend.set_axis_off()
|
|
86
|
+
|
|
87
|
+
# y ticklabel foramt 설정
|
|
88
|
+
self.ax_price.yaxis.set_major_formatter(lambda x, _: convert_unit(x, word=self.unit_price, digit=2))
|
|
89
|
+
self.ax_volume.yaxis.set_major_formatter(lambda x, _: convert_unit(x, word=self.unit_volume, digit=2))
|
|
90
|
+
|
|
91
|
+
gridKwargs = {'visible': True, 'linewidth': 1, 'color': '#d0d0d0', 'linestyle': '--'}
|
|
92
|
+
gridKwargs.update(self.gridKwargs)
|
|
93
|
+
# 공통 설정
|
|
94
|
+
for ax in (self.ax_price, self.ax_volume):
|
|
95
|
+
ax.xaxis.set_animated(True)
|
|
96
|
+
ax.yaxis.set_animated(True)
|
|
97
|
+
|
|
98
|
+
# x tick 외부 눈금 표시하지 않기
|
|
99
|
+
ax.xaxis.set_ticks_position('none')
|
|
100
|
+
# x tick label 제거
|
|
101
|
+
ax.set_xticklabels([])
|
|
102
|
+
# y tick 우측으로 이동
|
|
103
|
+
ax.tick_params(left=False, right=True, labelleft=False, labelright=True, colors=self.color_tick_label)
|
|
104
|
+
# Axes 외곽선 색 변경
|
|
105
|
+
for i in ['top', 'bottom', 'left', 'right']: ax.spines[i].set_color(self.color_tick)
|
|
106
|
+
|
|
107
|
+
# 차트 영역 배경 색상
|
|
108
|
+
ax.set_facecolor(self.color_background)
|
|
109
|
+
|
|
110
|
+
# grid(구분선, 격자) 그리기
|
|
111
|
+
# 어째서인지 grid의 zorder 값을 선언해도 1.6을 값으로 한다.
|
|
112
|
+
ax.grid(**gridKwargs)
|
|
113
|
+
return
|
|
114
|
+
|