sdvplot 0.1.0__tar.gz → 0.1.1__tar.gz
This diff represents the content of publicly available package versions that have been released to one of the supported registries. The information contained in this diff is provided for informational purposes only and reflects changes between package versions as they appear in their respective public registries.
- sdvplot-0.1.1/.claude/settings.json +31 -0
- {sdvplot-0.1.0 → sdvplot-0.1.1}/.gitignore +1 -1
- {sdvplot-0.1.0 → sdvplot-0.1.1}/CHANGELOG.md +143 -4
- {sdvplot-0.1.0 → sdvplot-0.1.1}/CITATION.cff +2 -2
- {sdvplot-0.1.0 → sdvplot-0.1.1}/CONTRIBUTING.md +16 -5
- sdvplot-0.1.1/PKG-INFO +319 -0
- sdvplot-0.1.1/README.md +228 -0
- {sdvplot-0.1.0 → sdvplot-0.1.1}/pyproject.toml +11 -5
- {sdvplot-0.1.0 → sdvplot-0.1.1}/src/sdvplot/__init__.py +5 -0
- {sdvplot-0.1.0 → sdvplot-0.1.1}/src/sdvplot/_cache.py +25 -4
- sdvplot-0.1.1/src/sdvplot/_court.py +154 -0
- {sdvplot-0.1.0 → sdvplot-0.1.1}/src/sdvplot/_dispatch.py +6 -3
- {sdvplot-0.1.0 → sdvplot-0.1.1}/src/sdvplot/_headshots.py +47 -10
- {sdvplot-0.1.0 → sdvplot-0.1.1}/src/sdvplot/_images.py +2 -2
- {sdvplot-0.1.0 → sdvplot-0.1.1}/src/sdvplot/_index.py +42 -10
- {sdvplot-0.1.0 → sdvplot-0.1.1}/src/sdvplot/_marks.py +22 -12
- sdvplot-0.1.1/src/sdvplot/_pitch.py +238 -0
- {sdvplot-0.1.0 → sdvplot-0.1.1}/src/sdvplot/_placement.py +20 -12
- sdvplot-0.1.1/src/sdvplot/_reactable_charts.py +812 -0
- sdvplot-0.1.1/src/sdvplot/_reactable_formatters.py +1610 -0
- sdvplot-0.1.1/src/sdvplot/_reactable_frame.py +277 -0
- sdvplot-0.1.1/src/sdvplot/_reactable_themes.py +356 -0
- {sdvplot-0.1.0 → sdvplot-0.1.1}/src/sdvplot/_resolve.py +44 -7
- {sdvplot-0.1.0 → sdvplot-0.1.1}/src/sdvplot/_surface.py +9 -1
- sdvplot-0.1.1/src/sdvplot/_table_themes.py +202 -0
- sdvplot-0.1.1/src/sdvplot/_team_palette.py +186 -0
- {sdvplot-0.1.0 → sdvplot-0.1.1}/src/sdvplot/_tiers.py +6 -0
- {sdvplot-0.1.0 → sdvplot-0.1.1}/src/sdvplot/_types.py +5 -2
- {sdvplot-0.1.0 → sdvplot-0.1.1}/src/sdvplot/_versions.py +1 -1
- {sdvplot-0.1.0 → sdvplot-0.1.1}/src/sdvplot/altair.py +8 -4
- {sdvplot-0.1.0 → sdvplot-0.1.1}/src/sdvplot/bokeh.py +2 -1
- sdvplot-0.1.1/src/sdvplot/data/INDEX_VERSION +1 -0
- sdvplot-0.1.1/src/sdvplot/data/aliases.parquet +0 -0
- sdvplot-0.1.1/src/sdvplot/data/pitch_landmarks.csv +94 -0
- sdvplot-0.1.1/src/sdvplot/data/reactablefmtr_themes.json +2161 -0
- sdvplot-0.1.1/src/sdvplot/data/table_themes.json +12136 -0
- sdvplot-0.1.1/src/sdvplot/data/table_themes.json.sha256 +1 -0
- sdvplot-0.1.1/src/sdvplot/data/teams.parquet +0 -0
- {sdvplot-0.1.0 → sdvplot-0.1.1}/src/sdvplot/folium.py +2 -1
- {sdvplot-0.1.0 → sdvplot-0.1.1}/src/sdvplot/great_tables/__init__.py +44 -0
- {sdvplot-0.1.0 → sdvplot-0.1.1}/src/sdvplot/great_tables/_cells.py +15 -10
- sdvplot-0.1.1/src/sdvplot/great_tables/_gt_shortcuts.py +690 -0
- {sdvplot-0.1.0 → sdvplot-0.1.1}/src/sdvplot/great_tables/_layout.py +93 -21
- {sdvplot-0.1.0 → sdvplot-0.1.1}/src/sdvplot/great_tables/_marks.py +39 -8
- sdvplot-0.1.1/src/sdvplot/great_tables/_source_themes.py +162 -0
- {sdvplot-0.1.0 → sdvplot-0.1.1}/src/sdvplot/great_tables/_themes.py +5 -1
- {sdvplot-0.1.0 → sdvplot-0.1.1}/src/sdvplot/holoviews.py +2 -1
- sdvplot-0.1.1/src/sdvplot/itables.py +115 -0
- {sdvplot-0.1.0 → sdvplot-0.1.1}/src/sdvplot/matplotlib.py +42 -20
- sdvplot-0.1.1/src/sdvplot/perspective.py +312 -0
- {sdvplot-0.1.0 → sdvplot-0.1.1}/src/sdvplot/plotly.py +10 -5
- {sdvplot-0.1.0 → sdvplot-0.1.1}/src/sdvplot/plotnine.py +61 -30
- {sdvplot-0.1.0 → sdvplot-0.1.1}/src/sdvplot/plottable.py +106 -2
- sdvplot-0.1.1/src/sdvplot/pydeck.py +683 -0
- {sdvplot-0.1.0 → sdvplot-0.1.1}/src/sdvplot/pygal.py +2 -1
- {sdvplot-0.1.0 → sdvplot-0.1.1}/src/sdvplot/reactable.py +38 -2
- {sdvplot-0.1.0 → sdvplot-0.1.1}/src/sdvplot/testing.py +25 -1
- {sdvplot-0.1.0 → sdvplot-0.1.1}/src/sdvplot/typing.py +2 -2
- sdvplot-0.1.1/tests/baseline/test_baseline_plotnine_axis_headshots.png +0 -0
- sdvplot-0.1.1/tests/baseline/test_baseline_plotnine_team_tiers.png +0 -0
- sdvplot-0.1.1/tests/baseline/test_baseline_team_tiers.png +0 -0
- sdvplot-0.1.1/tests/baseline/test_baseline_x_axis_headshots.png +0 -0
- {sdvplot-0.1.0 → sdvplot-0.1.1}/tests/conftest.py +23 -0
- sdvplot-0.1.1/tests/fixtures/README.md +25 -0
- sdvplot-0.1.1/tests/fixtures/deckgl_shared.json +8706 -0
- sdvplot-0.1.1/tests/fixtures/espn_soccer_events.csv +281 -0
- sdvplot-0.1.1/tests/fixtures/euroleague_points_E2025_1.csv +159 -0
- sdvplot-0.1.1/tests/fixtures/nfl_2024_team_epa.csv +33 -0
- sdvplot-0.1.1/tests/fixtures/sdvplotr_court_coords_euroleague.csv +159 -0
- sdvplot-0.1.1/tests/fixtures/sdvplotr_pitch_coords.csv +3516 -0
- sdvplot-0.1.1/tests/fixtures/sdvplotr_team_colors.csv +3768 -0
- {sdvplot-0.1.0 → sdvplot-0.1.1}/tests/gt_html.py +18 -1
- {sdvplot-0.1.0 → sdvplot-0.1.1}/tests/test_altair.py +14 -0
- {sdvplot-0.1.0 → sdvplot-0.1.1}/tests/test_api.py +12 -3
- {sdvplot-0.1.0 → sdvplot-0.1.1}/tests/test_bokeh.py +3 -0
- {sdvplot-0.1.0 → sdvplot-0.1.1}/tests/test_build_index.py +145 -9
- {sdvplot-0.1.0 → sdvplot-0.1.1}/tests/test_cache.py +11 -3
- {sdvplot-0.1.0 → sdvplot-0.1.1}/tests/test_court.py +96 -0
- {sdvplot-0.1.0 → sdvplot-0.1.1}/tests/test_dispatch.py +9 -3
- {sdvplot-0.1.0 → sdvplot-0.1.1}/tests/test_fetch_sources.py +111 -0
- {sdvplot-0.1.0 → sdvplot-0.1.1}/tests/test_folium.py +3 -0
- {sdvplot-0.1.0 → sdvplot-0.1.1}/tests/test_gen_docs.py +4 -0
- {sdvplot-0.1.0 → sdvplot-0.1.1}/tests/test_great_tables.py +40 -5
- {sdvplot-0.1.0 → sdvplot-0.1.1}/tests/test_gt_cells_borders.py +1 -1
- {sdvplot-0.1.0 → sdvplot-0.1.1}/tests/test_gt_cells_colors.py +23 -13
- {sdvplot-0.1.0 → sdvplot-0.1.1}/tests/test_gt_cells_format.py +3 -0
- {sdvplot-0.1.0 → sdvplot-0.1.1}/tests/test_gt_export_render.py +22 -0
- {sdvplot-0.1.0 → sdvplot-0.1.1}/tests/test_gt_layout_notes.py +4 -3
- {sdvplot-0.1.0 → sdvplot-0.1.1}/tests/test_gt_layout_reshape.py +2 -1
- {sdvplot-0.1.0 → sdvplot-0.1.1}/tests/test_gt_layout_rows.py +46 -7
- {sdvplot-0.1.0 → sdvplot-0.1.1}/tests/test_gt_layout_scales.py +81 -6
- {sdvplot-0.1.0 → sdvplot-0.1.1}/tests/test_gt_layout_titles.py +2 -1
- {sdvplot-0.1.0 → sdvplot-0.1.1}/tests/test_gt_repr_important.py +7 -4
- sdvplot-0.1.1/tests/test_gt_source_themes.py +120 -0
- {sdvplot-0.1.0 → sdvplot-0.1.1}/tests/test_gt_themes.py +4 -2
- sdvplot-0.1.1/tests/test_headshots_league.py +223 -0
- {sdvplot-0.1.0 → sdvplot-0.1.1}/tests/test_holoviews.py +3 -1
- {sdvplot-0.1.0 → sdvplot-0.1.1}/tests/test_images_baseline.py +25 -0
- {sdvplot-0.1.0 → sdvplot-0.1.1}/tests/test_index.py +14 -0
- {sdvplot-0.1.0 → sdvplot-0.1.1}/tests/test_input_validation.py +2 -1
- sdvplot-0.1.1/tests/test_itables_themes.py +70 -0
- {sdvplot-0.1.0 → sdvplot-0.1.1}/tests/test_marks.py +34 -0
- {sdvplot-0.1.0 → sdvplot-0.1.1}/tests/test_matplotlib.py +49 -0
- sdvplot-0.1.1/tests/test_perspective.py +334 -0
- sdvplot-0.1.1/tests/test_pitch.py +274 -0
- {sdvplot-0.1.0 → sdvplot-0.1.1}/tests/test_placement.py +21 -0
- {sdvplot-0.1.0 → sdvplot-0.1.1}/tests/test_plotly.py +21 -1
- {sdvplot-0.1.0 → sdvplot-0.1.1}/tests/test_plotnine.py +30 -1
- sdvplot-0.1.1/tests/test_plottable_themes.py +100 -0
- sdvplot-0.1.1/tests/test_pydeck.py +402 -0
- sdvplot-0.1.1/tests/test_pydeck_shared.py +100 -0
- {sdvplot-0.1.0 → sdvplot-0.1.1}/tests/test_pygal.py +7 -1
- sdvplot-0.1.1/tests/test_reactable_charts.py +329 -0
- sdvplot-0.1.1/tests/test_reactable_formatters.py +460 -0
- sdvplot-0.1.1/tests/test_reactable_frame_themes.py +263 -0
- sdvplot-0.1.1/tests/test_reactable_registry_themes.py +78 -0
- {sdvplot-0.1.0 → sdvplot-0.1.1}/tests/test_readme.py +0 -8
- {sdvplot-0.1.0 → sdvplot-0.1.1}/tests/test_real_index.py +188 -1
- {sdvplot-0.1.0 → sdvplot-0.1.1}/tests/test_repo_files.py +9 -1
- {sdvplot-0.1.0 → sdvplot-0.1.1}/tests/test_sdvplotr_parity.py +42 -7
- {sdvplot-0.1.0 → sdvplot-0.1.1}/tests/test_surface.py +31 -2
- sdvplot-0.1.1/tests/test_table_theme_docs.py +12 -0
- sdvplot-0.1.1/tests/test_table_themes.py +107 -0
- sdvplot-0.1.1/tests/test_table_themes_vendored.py +22 -0
- sdvplot-0.1.1/tests/test_team_palette.py +43 -0
- {sdvplot-0.1.0 → sdvplot-0.1.1}/tests/test_team_tiers.py +41 -4
- {sdvplot-0.1.0 → sdvplot-0.1.1}/tests/test_types.py +4 -1
- {sdvplot-0.1.0 → sdvplot-0.1.1}/tests/test_web_live.py +14 -0
- sdvplot-0.1.0/PKG-INFO +0 -188
- sdvplot-0.1.0/README.md +0 -107
- sdvplot-0.1.0/src/sdvplot/_court.py +0 -110
- sdvplot-0.1.0/src/sdvplot/data/INDEX_VERSION +0 -1
- sdvplot-0.1.0/src/sdvplot/data/aliases.parquet +0 -0
- sdvplot-0.1.0/src/sdvplot/data/teams.parquet +0 -0
- sdvplot-0.1.0/tests/baseline/test_baseline_plotnine_team_tiers.png +0 -0
- sdvplot-0.1.0/tests/baseline/test_baseline_team_tiers.png +0 -0
- sdvplot-0.1.0/tests/fixtures/README.md +0 -19
- {sdvplot-0.1.0 → sdvplot-0.1.1}/.gitattributes +0 -0
- {sdvplot-0.1.0 → sdvplot-0.1.1}/CODE_OF_CONDUCT.md +0 -0
- {sdvplot-0.1.0 → sdvplot-0.1.1}/LICENSE +0 -0
- {sdvplot-0.1.0 → sdvplot-0.1.1}/SECURITY.md +0 -0
- {sdvplot-0.1.0 → sdvplot-0.1.1}/src/sdvplot/_colors.py +0 -0
- {sdvplot-0.1.0 → sdvplot-0.1.1}/src/sdvplot/_contrast.py +0 -0
- {sdvplot-0.1.0 → sdvplot-0.1.1}/src/sdvplot/_deprecate.py +0 -0
- {sdvplot-0.1.0 → sdvplot-0.1.1}/src/sdvplot/_errors.py +0 -0
- {sdvplot-0.1.0 → sdvplot-0.1.1}/src/sdvplot/_lazy.py +0 -0
- {sdvplot-0.1.0 → sdvplot-0.1.1}/src/sdvplot/_manifest.py +0 -0
- {sdvplot-0.1.0 → sdvplot-0.1.1}/src/sdvplot/_normalize.py +0 -0
- {sdvplot-0.1.0 → sdvplot-0.1.1}/src/sdvplot/_tables.py +0 -0
- {sdvplot-0.1.0 → sdvplot-0.1.1}/src/sdvplot/_web.py +0 -0
- {sdvplot-0.1.0 → sdvplot-0.1.1}/src/sdvplot/great_tables/_export.py +0 -0
- {sdvplot-0.1.0 → sdvplot-0.1.1}/src/sdvplot/py.typed +0 -0
- {sdvplot-0.1.0 → sdvplot-0.1.1}/tests/__init__.py +0 -0
- {sdvplot-0.1.0 → sdvplot-0.1.1}/tests/baseline/test_baseline_add_images.png +0 -0
- {sdvplot-0.1.0 → sdvplot-0.1.1}/tests/baseline/test_baseline_court_coords_half_court.png +0 -0
- {sdvplot-0.1.0 → sdvplot-0.1.1}/tests/baseline/test_baseline_plotnine_facets.png +0 -0
- {sdvplot-0.1.0 → sdvplot-0.1.1}/tests/baseline/test_baseline_plotnine_mean_and_median_lines.png +0 -0
- {sdvplot-0.1.0 → sdvplot-0.1.1}/tests/baseline/test_baseline_plotnine_team_tiers_light.png +0 -0
- {sdvplot-0.1.0 → sdvplot-0.1.1}/tests/baseline/test_baseline_plotnine_title_image.png +0 -0
- {sdvplot-0.1.0 → sdvplot-0.1.1}/tests/baseline/test_baseline_scatter_with_logos.png +0 -0
- {sdvplot-0.1.0 → sdvplot-0.1.1}/tests/baseline/test_baseline_team_tiers_light.png +0 -0
- {sdvplot-0.1.0 → sdvplot-0.1.1}/tests/baseline/test_baseline_title_image.png +0 -0
- {sdvplot-0.1.0 → sdvplot-0.1.1}/tests/baseline/test_baseline_x_axis_logos.png +0 -0
- {sdvplot-0.1.0 → sdvplot-0.1.1}/tests/baseline/test_baseline_y_axis_logos.png +0 -0
- {sdvplot-0.1.0 → sdvplot-0.1.1}/tests/fixtures/ggpath_ref_lines.csv +0 -0
- {sdvplot-0.1.0 → sdvplot-0.1.1}/tests/fixtures/marks.csv +0 -0
- {sdvplot-0.1.0 → sdvplot-0.1.1}/tests/fixtures/nba_shotchartdetail_2023.csv +0 -0
- {sdvplot-0.1.0 → sdvplot-0.1.1}/tests/fixtures/sdvplotr_court_coords.csv +0 -0
- {sdvplot-0.1.0 → sdvplot-0.1.1}/tests/fixtures/sdvplotr_logo_history.csv +0 -0
- {sdvplot-0.1.0 → sdvplot-0.1.1}/tests/gt_export_fakes.py +0 -0
- {sdvplot-0.1.0 → sdvplot-0.1.1}/tests/gt_frames.py +0 -0
- {sdvplot-0.1.0 → sdvplot-0.1.1}/tests/test_adapters_live.py +0 -0
- {sdvplot-0.1.0 → sdvplot-0.1.1}/tests/test_automation_example.py +0 -0
- {sdvplot-0.1.0 → sdvplot-0.1.1}/tests/test_colors.py +0 -0
- {sdvplot-0.1.0 → sdvplot-0.1.1}/tests/test_commit_msg_hook.py +0 -0
- {sdvplot-0.1.0 → sdvplot-0.1.1}/tests/test_compat_cartopy.py +0 -0
- {sdvplot-0.1.0 → sdvplot-0.1.1}/tests/test_compat_charts.py +0 -0
- {sdvplot-0.1.0 → sdvplot-0.1.1}/tests/test_compat_geo.py +0 -0
- {sdvplot-0.1.0 → sdvplot-0.1.1}/tests/test_compat_matrix.py +0 -0
- {sdvplot-0.1.0 → sdvplot-0.1.1}/tests/test_compat_style.py +0 -0
- {sdvplot-0.1.0 → sdvplot-0.1.1}/tests/test_compat_text.py +0 -0
- {sdvplot-0.1.0 → sdvplot-0.1.1}/tests/test_contrast.py +0 -0
- {sdvplot-0.1.0 → sdvplot-0.1.1}/tests/test_deprecate.py +0 -0
- {sdvplot-0.1.0 → sdvplot-0.1.1}/tests/test_gt_cells_rows.py +0 -0
- {sdvplot-0.1.0 → sdvplot-0.1.1}/tests/test_gt_export_batch.py +0 -0
- {sdvplot-0.1.0 → sdvplot-0.1.1}/tests/test_gt_export_compose.py +0 -0
- {sdvplot-0.1.0 → sdvplot-0.1.1}/tests/test_gt_export_pixels.py +0 -0
- {sdvplot-0.1.0 → sdvplot-0.1.1}/tests/test_gt_export_save.py +0 -0
- {sdvplot-0.1.0 → sdvplot-0.1.1}/tests/test_gt_layout_exports.py +0 -0
- {sdvplot-0.1.0 → sdvplot-0.1.1}/tests/test_harness.py +0 -0
- {sdvplot-0.1.0 → sdvplot-0.1.1}/tests/test_headshots.py +0 -0
- {sdvplot-0.1.0 → sdvplot-0.1.1}/tests/test_home_figures.py +0 -0
- {sdvplot-0.1.0 → sdvplot-0.1.1}/tests/test_image_loaders.py +0 -0
- {sdvplot-0.1.0 → sdvplot-0.1.1}/tests/test_images.py +0 -0
- {sdvplot-0.1.0 → sdvplot-0.1.1}/tests/test_import_time.py +0 -0
- {sdvplot-0.1.0 → sdvplot-0.1.1}/tests/test_manifest.py +0 -0
- {sdvplot-0.1.0 → sdvplot-0.1.1}/tests/test_normalize.py +0 -0
- {sdvplot-0.1.0 → sdvplot-0.1.1}/tests/test_notebooks.py +0 -0
- {sdvplot-0.1.0 → sdvplot-0.1.1}/tests/test_package.py +0 -0
- {sdvplot-0.1.0 → sdvplot-0.1.1}/tests/test_plottable.py +0 -0
- {sdvplot-0.1.0 → sdvplot-0.1.1}/tests/test_reactable.py +0 -0
- {sdvplot-0.1.0 → sdvplot-0.1.1}/tests/test_resolve.py +0 -0
- {sdvplot-0.1.0 → sdvplot-0.1.1}/tests/test_resolve_series.py +0 -0
- {sdvplot-0.1.0 → sdvplot-0.1.1}/tests/test_submodule_examples.py +0 -0
- {sdvplot-0.1.0 → sdvplot-0.1.1}/tests/test_suggest.py +0 -0
- {sdvplot-0.1.0 → sdvplot-0.1.1}/tests/test_table_contract.py +0 -0
- {sdvplot-0.1.0 → sdvplot-0.1.1}/tests/test_tables.py +0 -0
- {sdvplot-0.1.0 → sdvplot-0.1.1}/tests/test_title_image.py +0 -0
- {sdvplot-0.1.0 → sdvplot-0.1.1}/tests/test_url_safety.py +0 -0
- {sdvplot-0.1.0 → sdvplot-0.1.1}/tests/test_warning_order.py +0 -0
- {sdvplot-0.1.0 → sdvplot-0.1.1}/tests/test_web.py +0 -0
- {sdvplot-0.1.0 → sdvplot-0.1.1}/tests/test_web_render.py +0 -0
|
@@ -0,0 +1,31 @@
|
|
|
1
|
+
{
|
|
2
|
+
"attribution": {
|
|
3
|
+
"commit": "",
|
|
4
|
+
"pr": "",
|
|
5
|
+
"sessionUrl": false
|
|
6
|
+
},
|
|
7
|
+
"extraKnownMarketplaces": {
|
|
8
|
+
"sportsdataverse": {
|
|
9
|
+
"source": {
|
|
10
|
+
"source": "github",
|
|
11
|
+
"repo": "sportsdataverse/sportsdataverse"
|
|
12
|
+
}
|
|
13
|
+
}
|
|
14
|
+
},
|
|
15
|
+
"enabledPlugins": {
|
|
16
|
+
"sdv-toolkit@sportsdataverse": true
|
|
17
|
+
},
|
|
18
|
+
"hooks": {
|
|
19
|
+
"PreToolUse": [
|
|
20
|
+
{
|
|
21
|
+
"matcher": "Bash",
|
|
22
|
+
"hooks": [
|
|
23
|
+
{
|
|
24
|
+
"type": "command",
|
|
25
|
+
"command": "i=$(cat); printf '%s' \"$i\" | grep -qE 'git commit|git notes|gh pr (create|edit|merge)|gh api' || exit 0; printf '%s' \"$i\" | grep -qiE 'co-?authored[-[:space:]]?(by|with)[[:space:]]*:[^\"]*(claude|copilot|cursor|gpt|openai|anthropic|gemini)|generated with[^\"]*claude|claude-session:' && { echo 'BLOCKED: AI attribution (Co-Authored-By / Generated with / Claude-Session) is not permitted. See .claude/CLAUDE.md.' >&2; exit 2; }; exit 0"
|
|
26
|
+
}
|
|
27
|
+
]
|
|
28
|
+
}
|
|
29
|
+
]
|
|
30
|
+
}
|
|
31
|
+
}
|
|
@@ -3,9 +3,13 @@
|
|
|
3
3
|
|
|
4
4
|
- [Changelog](#changelog)
|
|
5
5
|
- [[Unreleased]](#unreleased)
|
|
6
|
+
- [[0.1.1] - 2026-10-26](#011---2026-10-26)
|
|
7
|
+
- [Added](#added)
|
|
8
|
+
- [Changed](#changed)
|
|
9
|
+
- [Fixed](#fixed)
|
|
6
10
|
- [[0.1.0] - 2026-10-05](#010---2026-10-05)
|
|
7
11
|
- [Migrating from the git pre-release](#migrating-from-the-git-pre-release)
|
|
8
|
-
- [Added](#added)
|
|
12
|
+
- [Added](#added-1)
|
|
9
13
|
- [Core (team identity, colors, logos, cache, adapter contract)](#core-team-identity-colors-logos-cache-adapter-contract)
|
|
10
14
|
- [Repository standards](#repository-standards)
|
|
11
15
|
- [Matplotlib family](#matplotlib-family)
|
|
@@ -19,11 +23,11 @@
|
|
|
19
23
|
- [Parity extras (court coordinates, images by path, reference lines)](#parity-extras-court-coordinates-images-by-path-reference-lines)
|
|
20
24
|
- [Parity extras (title images, team tiers)](#parity-extras-title-images-team-tiers)
|
|
21
25
|
- [Release hardening](#release-hardening)
|
|
22
|
-
- [Changed](#changed)
|
|
26
|
+
- [Changed](#changed-1)
|
|
23
27
|
- [Documentation](#documentation)
|
|
24
28
|
- [Documentation — example notebooks by section, interactive outputs and the gallery](#documentation--example-notebooks-by-section-interactive-outputs-and-the-gallery)
|
|
25
29
|
- [Release hardening](#release-hardening-1)
|
|
26
|
-
- [Fixed](#fixed)
|
|
30
|
+
- [Fixed](#fixed-1)
|
|
27
31
|
- [Adapter contract follow-ups](#adapter-contract-follow-ups)
|
|
28
32
|
- [Tables follow-ups](#tables-follow-ups)
|
|
29
33
|
- [Content findings (team index, team tiers, surface)](#content-findings-team-index-team-tiers-surface)
|
|
@@ -38,6 +42,140 @@ All notable changes to sdvplot are documented here. The format follows [Keep a C
|
|
|
38
42
|
|
|
39
43
|
## [Unreleased]
|
|
40
44
|
|
|
45
|
+
## [0.1.1] - 2026-10-26
|
|
46
|
+
|
|
47
|
+
### Added
|
|
48
|
+
|
|
49
|
+
- `sdvplot.pydeck` (new `[pydeck]` extra): deck.gl layer props for pydeck, the same as sdvplot-js's `./deckgl` builds
|
|
50
|
+
(held to one shared fixture). `logo_icon_layer` draws team logos at points (an `IconLayer` of auto-packed logo
|
|
51
|
+
icons), `pass_arc_layer` draws arcs in team colors (primary at the source, secondary at the target; with
|
|
52
|
+
`background`, 3:1 contrast and ΔE 20 apart through sdvplot-js's team palette, ported), and `surface_layer` draws a
|
|
53
|
+
sportypy rink, pitch, court or field as a `PolygonLayer` in the surface's own coordinates. The props are plain dicts
|
|
54
|
+
(`pydeck.Layer(**props)`); `deck()` builds a `pydeck.Deck` fitted to a surface or a map.
|
|
55
|
+
- `sdvplot.perspective` (new `[perspective]` extra, Python 3.11+): `perspective_sdv_config(frame, team_col=, league=,
|
|
56
|
+
plugin=, theme=, mode=)` returns a Perspective viewer config (`PerspectiveWidget(data, **config)` or the JavaScript
|
|
57
|
+
`restore()`) that colors each team with the shared team palette: the Datagrid fills the team column's cells, and a
|
|
58
|
+
chart splits by team and colors each team's series. A registry table theme sets the grid's fonts and sign colors.
|
|
59
|
+
Number columns get formats (3 decimals, 1 for a percentage, integers plain; `formats=` overrides).
|
|
60
|
+
`perspective_logo_column(frame, team_col, league=)` adds each team's logo URL, shown as a link.
|
|
61
|
+
- `sdvplot.itables.itables_sdv_theme(name, mode=, table_id=)` returns `classes`, `style` and a scoped `css` string
|
|
62
|
+
(with a Google Fonts import) that styles an `itables.show` table like any of the 122 surveyed themes.
|
|
63
|
+
- `sdvplot.plottable.plottable_sdv_theme(name, mode=)` returns the `plottable.Table` keywords (text, dividers, stripes) for
|
|
64
|
+
any of the 122 surveyed themes, plus a `facecolor` to pop and apply to the figure; a font matplotlib cannot find falls
|
|
65
|
+
back to its generic family with one warning per family.
|
|
66
|
+
- `table_theme_spec()` and `sdv_table_themes()`: resolve and list the 122 surveyed table themes (light and dark).
|
|
67
|
+
- `sdvplot.great_tables.gt_theme_source(gt, name, mode=, density=)` styles a table like any of the 122 surveyed
|
|
68
|
+
themes, plus 20 named shortcuts (`gt_theme_datagolf`, `gt_theme_economist`, `gt_theme_basketball_reference`, ...)
|
|
69
|
+
generated by `tools/gen_gt_shortcuts.py`.
|
|
70
|
+
- `reactable_sdv_theme(name, mode=)` accepts every registry theme, and the new `reactable_sdv_args(name, mode=)` returns
|
|
71
|
+
the `Reactable` keywords (`theme`, `striped`, `highlight`, `bordered`, `compact`) that match it. reactablefmtr names
|
|
72
|
+
are unchanged; `mode="dark"` on a reactablefmtr theme raises unless the theme is dark already.
|
|
73
|
+
- `teams(league, include_conferences=True)` lists sdvplotR's conference and league rows (its `include_conferences`):
|
|
74
|
+
the 89 college conferences of cfb, mbb and wbb and the AFC, NFC and NFL, with `program` `"conference"` or `"league"`,
|
|
75
|
+
the conference's short name as `team_id` and `abbr`, cbbplotR's colors (`color_source` `"cbbplotR"`) and the
|
|
76
|
+
`conference_id` the league's teams carry. The default lists teams only, and `resolve()` and `palette()` never
|
|
77
|
+
answer a conference key, so no existing call changes.
|
|
78
|
+
- Conference and league logos from the archive (sdvplotR's `logo_marks` for those rows): `logo_url("SEC", "cfb")`,
|
|
79
|
+
`logo_url("AFC", "nfl")`, `logo_url("NFL", "nfl")` and every mark helper (`marks`, `logo_image`, `add_logos`,
|
|
80
|
+
`axis_logos`, `geom_sdv_logos`, the table marks, the web adapters) take a conference or league row's key, with
|
|
81
|
+
`variant="dark"` where the archive has one (16 CFB conferences, the AFC, NFC and NFL) and the usual fallbacks. The
|
|
82
|
+
key is read after every team alias, so CFB's `MAC` is still Macalester, and `resolve()` still answers no conference:
|
|
83
|
+
the rows' only aliases are "mark" aliases, which name the manifest's own conference rows
|
|
84
|
+
(`level:league:source:entity_id`; `tools/build_index.py` `conference_mark_aliases`, from the new
|
|
85
|
+
`data-raw/manifest_conferences.csv` snapshot). All 92 rows have a primary mark, as sdvplotR's 92 do.
|
|
86
|
+
- Headshots by the league's own player id: `id_system="league"` (sdvplotR's `id_type = "league"`) on `headshot_url`
|
|
87
|
+
and every headshot helper (`add_headshots` on every adapter, `geom_sdv_headshots`, `gt_sdv_headshots`,
|
|
88
|
+
`gt_sdv_cols_label(mark_type="headshot")`, `reactable_sdv_headshots`, `plottable.headshot_column`) draws an NBA or
|
|
89
|
+
WNBA Stats `PERSON_ID` (what nba_api, hoopR and wehoop return), an MLBAM id or an NHL API id from the league's CDN,
|
|
90
|
+
with sdvplotR's URL templates; for the NFL it is the gsis id. `"espn"` stays the default. A league without them is
|
|
91
|
+
an `InputError` naming the ones that have them, and a `DownloadError` from cdn.nba.com or cdn.wnba.com with a 403
|
|
92
|
+
says that those CDNs block datacenter and cloud IPs.
|
|
93
|
+
- `surface("fiba")` draws a FIBA court (no team yet).
|
|
94
|
+
- `sdvplot.plotnine.scale_color_sdv` and `scale_fill_sdv` take `alpha=`, an opacity applied to the team colors
|
|
95
|
+
(sdvplotR's `alpha`); `na_value` is drawn as given. `scale_colour_sdv` is the British alias sdvplotR and plotnine
|
|
96
|
+
both ship.
|
|
97
|
+
- `gt_merge_stack_team_color` takes `background=`, the cell background the bottom line's color is checked against;
|
|
98
|
+
the default reads the table's background, so a theme applied first is taken into account.
|
|
99
|
+
- `gt_tiers` takes `alt=`, a function from the image paths or URLs to their alt text. By default a logo the archive
|
|
100
|
+
knows (any `logo_url`) is named by its team and any other image by its file name; the images had no alt text at
|
|
101
|
+
all. The alt comes from the cell's value, so a local file (embedded as a data URI) gets a real name.
|
|
102
|
+
- `pitch_coords()` converts soccer event coordinates from Opta / Stats Perform, Wyscout, StatsBomb, UEFA, Impect,
|
|
103
|
+
ESPN and the tracking providers (Tracab, SkillCorner, Second Spectrum, Metrica) to one regulation 105 x 68 m
|
|
104
|
+
frame, piecewise-linearly between pitch landmarks, with `flip` for teams attacking opposite ends. The port of
|
|
105
|
+
sdvplotR's `sdv_pitch_coords()`, matched to 1e-12 on every provider.
|
|
106
|
+
- `court_coords(provider="euroleague")` converts the Euroleague shot frame of sportsdataverse-py's
|
|
107
|
+
`euroleague_game_points()` (`coord_x`/`coord_y`: integer centimeters, hoop at the origin, both teams on one basket,
|
|
108
|
+
free throws as `-1,-1`) onto the FIBA court `surface("fiba")` draws, in meters, with the `-1,-1` free throws as
|
|
109
|
+
null. The default `"nba"` is unchanged, byte for byte. Matched to sdvplotR's `sdv_court_coords(provider =
|
|
110
|
+
"euroleague")` bit for bit on a real Euroleague game (`tests/fixtures/euroleague_points_E2025_1.csv`).
|
|
111
|
+
- `tools/espn_soccer_y_gate.py`, the measurement behind the ESPN frame's y direction.
|
|
112
|
+
- `axis_logos(..., mark_type="headshot")` draws player headshots as axis labels on matplotlib, plotnine, Plotly and
|
|
113
|
+
Altair (the port of sdvplotR's `scale_x_sdv_headshots()` / `scale_y_sdv_headshots()` and `element_sdv_headshot()`):
|
|
114
|
+
the tick labels are read as player ids (`id_system` `"espn"`, which `"auto"` means, `"gsis"` or `"league"`), each headshot
|
|
115
|
+
keeps its own aspect, an unknown id stays as text with one warning, and the adapters without axis logos raise
|
|
116
|
+
`UnsupportedTargetError` as before. `sdvplot.typing.AxisMarkType` is the `Literal` of the three mark types. The
|
|
117
|
+
matplotlib y-axis label pad now grows by the widest image's width, so wordmarks and headshots no longer overlap
|
|
118
|
+
their tick labels' room. The adapter contract (`check_adapter_contract`, rule 7) checks the headshot axis too.
|
|
119
|
+
|
|
120
|
+
### Changed
|
|
121
|
+
|
|
122
|
+
- The README links the JavaScript / TypeScript port, sdvplot-js, now on npm: an npm badge and an Installation note
|
|
123
|
+
for `@sportsdataverse/sdvplot`, `@sportsdataverse/sporty` and `@sportsdataverse/sdvtables`, with their docs at
|
|
124
|
+
plot.sportsdataverse.org.
|
|
125
|
+
- The docs site's SDV menu adds cfbseedR and sdvplot-js, and the README's SportsDataverse table adds sdvplot-js, so
|
|
126
|
+
the package lists match the other SportsDataverse sites.
|
|
127
|
+
- polars 2.x is supported: the dependency is `polars>=1.24` (was `<2`). With every optional extra installed,
|
|
128
|
+
the full suite (2,343 tests) passes on polars 2.0.0, the same as on 1.44.
|
|
129
|
+
- numpy is now a core dependency (it was optional, needed only by `pitch_coords()`).
|
|
130
|
+
- `surface("soccer")` draws a regulation 105 x 68 m pitch by default (it drew sportypy's 120 x 90 m maximum), the
|
|
131
|
+
frame `pitch_coords()` returns; `pitch_updates` still overrides it key by key.
|
|
132
|
+
- `gt_merge_stack_team_color` keeps the bottom line readable (sdvplotR #55): the team's primary color when it clears
|
|
133
|
+
4.5:1 contrast (WCAG AA) on the cell background, else the secondary, else the primary darkened (or lightened, on a
|
|
134
|
+
dark table) until it does, so Missouri's gold (1.8:1 on white) reads on a white table and stays gold on a dark one.
|
|
135
|
+
An unknown team's grey goes through the same rule.
|
|
136
|
+
- `gt_spotlight(dim_color=)` defaults to `"auto"` (sdvplotR #61): the other rows are dimmed to the table's text
|
|
137
|
+
blended toward its background until it clears 4.5:1 (`#737373` on white), instead of the fixed `#BBBBBB`, which is
|
|
138
|
+
1.9:1 on white and barely dimmer than the text on a dark theme. Pass a color to choose it, or `None` not to dim.
|
|
139
|
+
- `team_tiers` (matplotlib and plotnine) takes `variant=`, default `"auto"`: the dark theme now draws the archive's
|
|
140
|
+
dark-background logos (the `"dark"` variant), so dark marks such as the Capitals', the Giants', Penn State's or
|
|
141
|
+
Iowa's no longer fade into the near-black background. A team with no dark mark draws its default one, with no
|
|
142
|
+
warning; the light theme still draws the default logos. Pass `variant="default"` for the old look (sdvplotR's), or
|
|
143
|
+
any variant `add_logos` takes.
|
|
144
|
+
- great_tables 1.1 is supported. Its `data_color` now interpolates in CIELAB, as R gt and `scales::col_numeric` do,
|
|
145
|
+
so `gt_color_ranks` fills match sdvplotR's exactly under it; `gt_color_pills`, `gt_percentile_bar` and the
|
|
146
|
+
`gt_legend_continuous` steps now draw great_tables' own gradient, so they stay equal to `data_color` cells on every
|
|
147
|
+
version (CIELAB from 1.1, sRGB before) and match sdvplotR's colors from 1.1 (they were sRGB approximations).
|
|
148
|
+
|
|
149
|
+
### Fixed
|
|
150
|
+
|
|
151
|
+
- The surfaces cookbook's soccer shot map (§9) placed ESPN shots at twice their distance from goal (ESPN's
|
|
152
|
+
`field_position_x` is a fraction of half the pitch, not of the whole), mirrored the home team's wings, and kept
|
|
153
|
+
ESPN's `(0, 0)` "no location" events. It now scales by 52.5 m, turns the away team half a turn, and drops them.
|
|
154
|
+
- Coordinates, teams and seasons accept a `range`: `add_logos(ax, range(1, 8), ...)` raised a `TypeError` that named
|
|
155
|
+
`resolve()` though the bad value was `x`. A container sdvplot cannot read now raises a `TypeError` that names no one
|
|
156
|
+
function: `expected a scalar, list, tuple, range, numpy array or a pandas/polars Series, got dict`.
|
|
157
|
+
- NHL `WIN` is season-aware: `resolve("WIN", "nhl", season=1990)` (and NHL team id 33, and the archive's logos of
|
|
158
|
+
those seasons) gives the original Jets' line, today's Utah Mammoth, for the seasons ending 1980-1996, as sdvplotR's
|
|
159
|
+
`resolve_historical_abbr()` does; any other season, or none, gives today's Winnipeg Jets, the relocated Thrashers.
|
|
160
|
+
Every season used to give today's Jets, because the NHL stats API files the 1979-96 team under their franchise.
|
|
161
|
+
- `UTRGV`, `TEXAS-RIO GRANDE VALLEY` and `RGV` resolve in college football (ESPN's teams list omits UT Rio Grande
|
|
162
|
+
Valley, 292; its per-team endpoint's `RGV` is now in `data-raw/espn_abbrs.csv`).
|
|
163
|
+
- Six college basketball teams ESPN's teams lists omit resolve by their ESPN abbreviation: `LIN` (Lindenwood, 2815),
|
|
164
|
+
`QUC` (Queens, 2511), `SFPA` (Saint Francis, 2598) and `USI` (Southern Indiana, 88) in mbb, `MERC` (Mercyhurst,
|
|
165
|
+
2385) and `SFPA` in wbb, and with them sdvplotR's keys for those teams. `tools/fetch_sources.py` reads them from
|
|
166
|
+
ESPN's Core API per season (`ESPN_CORE_TEAMS`) into `data-raw/espn_abbrs.csv`.
|
|
167
|
+
`teams()` shows that code as `abbr` where ESPN's teams lists give none, as for UTRGV (`RGV`) and college
|
|
168
|
+
baseball's Loras (`LOR`): eight teams had a null `abbr`.
|
|
169
|
+
- sdvplotR's conference names draw the conference's logo again: `logo_url("Southeastern Conference", "cfb")` is
|
|
170
|
+
`logo_url("SEC", "cfb")`, `logo_url("B10", "mbb")` is `logo_url("Big Ten", "mbb")`, and so for the other keys
|
|
171
|
+
sdvplotR's `clean_team_abbrs()` maps to a conference or league row ("B1G", "Pac-10", "American Football
|
|
172
|
+
Conference"): 275 keys in cfb, mbb, wbb and the NFL, a new internal id system `"conference"` that only the mark
|
|
173
|
+
functions read, after every team alias. `resolve()` still answers no conference, and CFB's `MAC` is still
|
|
174
|
+
Macalester; `resolve("Mid-American Conference", "cfb")` no longer gives Macalester (it went through sdvplotR's
|
|
175
|
+
`MAC` canon): it is `None`, and its logo is the conference's.
|
|
176
|
+
- `gt_tiers` no longer writes two `alt` attributes on an image under great_tables 1.1, whose `fmt_image` adds an
|
|
177
|
+
empty `alt=""`: the image's alt text replaces it.
|
|
178
|
+
|
|
41
179
|
## [0.1.0] - 2026-10-05
|
|
42
180
|
|
|
43
181
|
First release.
|
|
@@ -557,5 +695,6 @@ fails loudly, with the message shown:
|
|
|
557
695
|
had a 60 s timeout of its own, so a server sending a header byte every 59 s held the call open almost indefinitely.
|
|
558
696
|
Through a proxy, the watchdog covers the body only.
|
|
559
697
|
|
|
560
|
-
[Unreleased]: https://github.com/sportsdataverse/sdvplot/compare/v0.1.
|
|
698
|
+
[Unreleased]: https://github.com/sportsdataverse/sdvplot/compare/v0.1.1...HEAD
|
|
699
|
+
[0.1.1]: https://github.com/sportsdataverse/sdvplot/compare/v0.1.0...v0.1.1
|
|
561
700
|
[0.1.0]: https://github.com/sportsdataverse/sdvplot/releases/tag/v0.1.0
|
|
@@ -6,8 +6,8 @@ authors:
|
|
|
6
6
|
- family-names: Gilani
|
|
7
7
|
given-names: Saiem
|
|
8
8
|
orcid: "https://orcid.org/0000-0002-7194-9067"
|
|
9
|
-
version: 0.1.
|
|
10
|
-
date-released: "2026-10-
|
|
9
|
+
version: 0.1.1
|
|
10
|
+
date-released: "2026-10-26"
|
|
11
11
|
url: "https://sdvplot.sportsdataverse.org"
|
|
12
12
|
repository-code: "https://github.com/sportsdataverse/sdvplot"
|
|
13
13
|
license: MIT
|
|
@@ -218,16 +218,27 @@ npx yarn@1.22.22 build # what CI runs: it must finish with no new broken link
|
|
|
218
218
|
|
|
219
219
|
1. Re-check the watch list in `docs/COMPATIBILITY.md`: if a newer reflex-xy release documents an image mark or a
|
|
220
220
|
custom glyph, open an issue for a Reflex XY adapter; either way, update the version and date checked there.
|
|
221
|
-
2.
|
|
222
|
-
|
|
221
|
+
2. Install the hooks first (`uv run pre-commit install`; a fresh clone or worktree has none, and then nothing checks
|
|
222
|
+
your commits). Bump `version` in `pyproject.toml`, run `uv lock` with the uv that `release.yml` pins
|
|
223
|
+
(`uvx --from uv==<pin> uv lock`: an older uv rewrites environment markers all over the lock), and commit `uv.lock`
|
|
224
|
+
with it (the `drift` workflow fails on a stale lock); the lock diff should be the one `version` line.
|
|
225
|
+
Update every other place the version is written: `CITATION.cff` (`version` and a quoted `date-released`;
|
|
226
|
+
`tests/test_repo_files.py` checks the version), the `versions()` docstring example in `src/sdvplot/_versions.py`,
|
|
227
|
+
and the hand-written example in `docs/docs/concepts/cache.md`. `docs/docs/reference/**` is generated: change the
|
|
228
|
+
docstring, then run `uv run python tools/gen_docs.py`, never edit the page.
|
|
223
229
|
3. In `CHANGELOG.md`, move the `## [Unreleased]` entries under a new `## [X.Y.Z] - <date>` heading (and add its link reference) directly below
|
|
224
230
|
an emptied `## [Unreleased]`, which always stays at the top (a test asserts it).
|
|
225
|
-
4. Run `cd docs && npx yarn@1.22.22 version:docs X.Y.Z
|
|
226
|
-
|
|
231
|
+
4. Run `cd docs && npx yarn@1.22.22 version:docs X.Y.Z` after the docs are final: the snapshot copies
|
|
232
|
+
`docs/docs` as it stands, and later edits do not reach it. `docs/versioned_docs` is in ruff's `extend-exclude`, so
|
|
233
|
+
the snapshot of the generated pages is never reformatted.
|
|
234
|
+
5. Before pushing, run `uv run pre-commit run --all-files`, the drift checks (`uv run python tools/build_index.py
|
|
235
|
+
--check`, `uv run python tools/gen_docs.py --check`) and `SDVPLOT_RELEASE_VERSION=vX.Y.Z uv run pytest -q
|
|
236
|
+
tests/test_repo_files.py`, the gate `release.yml` runs on the tag.
|
|
237
|
+
6. First release only: merge the install-line PR (#50: README, intro and quickstart switch to `pip install sdvplot`)
|
|
227
238
|
just before tagging. The README is the PyPI page and cannot be changed for a version once it is uploaded. For 0.1.0,
|
|
228
239
|
step 3 means folding the `[Unreleased]` entries into the existing `## [0.1.0]` section and replacing its
|
|
229
240
|
`Unreleased` with the date; #50 carries that cut too.
|
|
230
|
-
|
|
241
|
+
7. Publish a GitHub Release `vX.Y.Z`. `release.yml` checks that the tag equals the project version, runs the tests
|
|
231
242
|
with `SDVPLOT_RELEASE_VERSION` set from the tag (so `tests/test_repo_files.py::test_the_tagged_release_is_ready`
|
|
232
243
|
refuses a README that still installs from GitHub, a CHANGELOG without a dated `## [X.Y.Z] - YYYY-MM-DD` heading, or
|
|
233
244
|
entries left under `[Unreleased]`) and the index drift check, builds the sdist and wheel from a fresh checkout, and
|
sdvplot-0.1.1/PKG-INFO
ADDED
|
@@ -0,0 +1,319 @@
|
|
|
1
|
+
Metadata-Version: 2.5
|
|
2
|
+
Name: sdvplot
|
|
3
|
+
Version: 0.1.1
|
|
4
|
+
Summary: Team logos, wordmarks, headshots and colors for Python plots and tables (SportsDataverse)
|
|
5
|
+
Project-URL: Homepage, https://sdvplot.sportsdataverse.org/
|
|
6
|
+
Project-URL: Documentation, https://sdvplot.sportsdataverse.org/
|
|
7
|
+
Project-URL: Repository, https://github.com/sportsdataverse/sdvplot
|
|
8
|
+
Project-URL: Bug Tracker, https://github.com/sportsdataverse/sdvplot/issues
|
|
9
|
+
Project-URL: Changelog, https://sdvplot.sportsdataverse.org/CHANGELOG
|
|
10
|
+
Author: Saiem Gilani
|
|
11
|
+
Maintainer: Saiem Gilani, SportsDataverse
|
|
12
|
+
License-Expression: MIT
|
|
13
|
+
License-File: LICENSE
|
|
14
|
+
Keywords: altair,logos,matplotlib,plotly,sports,sportsdataverse,team colors
|
|
15
|
+
Classifier: Development Status :: 3 - Alpha
|
|
16
|
+
Classifier: Intended Audience :: Science/Research
|
|
17
|
+
Classifier: Programming Language :: Python :: 3
|
|
18
|
+
Classifier: Programming Language :: Python :: 3 :: Only
|
|
19
|
+
Classifier: Programming Language :: Python :: 3.10
|
|
20
|
+
Classifier: Programming Language :: Python :: 3.11
|
|
21
|
+
Classifier: Programming Language :: Python :: 3.12
|
|
22
|
+
Classifier: Programming Language :: Python :: 3.13
|
|
23
|
+
Classifier: Programming Language :: Python :: 3.14
|
|
24
|
+
Classifier: Topic :: Scientific/Engineering :: Visualization
|
|
25
|
+
Classifier: Typing :: Typed
|
|
26
|
+
Requires-Python: >=3.10
|
|
27
|
+
Requires-Dist: narwhals>=2.0
|
|
28
|
+
Requires-Dist: numpy>=1.26
|
|
29
|
+
Requires-Dist: pillow>=12.3
|
|
30
|
+
Requires-Dist: platformdirs>=4
|
|
31
|
+
Requires-Dist: polars>=1.24
|
|
32
|
+
Requires-Dist: requests>=2.33
|
|
33
|
+
Requires-Dist: urllib3>=2.6
|
|
34
|
+
Provides-Extra: all
|
|
35
|
+
Requires-Dist: altair>=5.1; extra == 'all'
|
|
36
|
+
Requires-Dist: bokeh>=3.8.2; extra == 'all'
|
|
37
|
+
Requires-Dist: folium>=0.19; extra == 'all'
|
|
38
|
+
Requires-Dist: great-tables>=1.0; extra == 'all'
|
|
39
|
+
Requires-Dist: holoviews>=1.18; extra == 'all'
|
|
40
|
+
Requires-Dist: htmltools>=0.4.1; extra == 'all'
|
|
41
|
+
Requires-Dist: itables>=2.4; extra == 'all'
|
|
42
|
+
Requires-Dist: matplotlib>=3.7; extra == 'all'
|
|
43
|
+
Requires-Dist: mplsoccer>=1.2; extra == 'all'
|
|
44
|
+
Requires-Dist: nokap>=0.1; extra == 'all'
|
|
45
|
+
Requires-Dist: perspective-python[jupyter]>=5.5.1; (python_version >= '3.11') and extra == 'all'
|
|
46
|
+
Requires-Dist: plotly>=5.14; extra == 'all'
|
|
47
|
+
Requires-Dist: plotnine>=0.15; extra == 'all'
|
|
48
|
+
Requires-Dist: plottable>=0.1.5; extra == 'all'
|
|
49
|
+
Requires-Dist: pydeck>=0.9.3; extra == 'all'
|
|
50
|
+
Requires-Dist: pygal>=3.0.1; extra == 'all'
|
|
51
|
+
Requires-Dist: reactable>=0.1.6; extra == 'all'
|
|
52
|
+
Requires-Dist: resvg-py>=0.2.5; extra == 'all'
|
|
53
|
+
Requires-Dist: sportypy>=1.0; extra == 'all'
|
|
54
|
+
Provides-Extra: altair
|
|
55
|
+
Requires-Dist: altair>=5.1; extra == 'altair'
|
|
56
|
+
Provides-Extra: bokeh
|
|
57
|
+
Requires-Dist: bokeh>=3.8.2; extra == 'bokeh'
|
|
58
|
+
Provides-Extra: folium
|
|
59
|
+
Requires-Dist: folium>=0.19; extra == 'folium'
|
|
60
|
+
Provides-Extra: holoviews
|
|
61
|
+
Requires-Dist: bokeh>=3.8.2; extra == 'holoviews'
|
|
62
|
+
Requires-Dist: holoviews>=1.18; extra == 'holoviews'
|
|
63
|
+
Provides-Extra: itables
|
|
64
|
+
Requires-Dist: itables>=2.4; extra == 'itables'
|
|
65
|
+
Provides-Extra: mpl
|
|
66
|
+
Requires-Dist: matplotlib>=3.7; extra == 'mpl'
|
|
67
|
+
Provides-Extra: perspective
|
|
68
|
+
Requires-Dist: perspective-python[jupyter]>=5.5.1; (python_version >= '3.11') and extra == 'perspective'
|
|
69
|
+
Provides-Extra: plotly
|
|
70
|
+
Requires-Dist: plotly>=5.14; extra == 'plotly'
|
|
71
|
+
Provides-Extra: plotnine
|
|
72
|
+
Requires-Dist: plotnine>=0.15; extra == 'plotnine'
|
|
73
|
+
Provides-Extra: plottable
|
|
74
|
+
Requires-Dist: plottable>=0.1.5; extra == 'plottable'
|
|
75
|
+
Provides-Extra: pydeck
|
|
76
|
+
Requires-Dist: pydeck>=0.9.3; extra == 'pydeck'
|
|
77
|
+
Provides-Extra: pygal
|
|
78
|
+
Requires-Dist: pygal>=3.0.1; extra == 'pygal'
|
|
79
|
+
Provides-Extra: reactable
|
|
80
|
+
Requires-Dist: reactable>=0.1.6; extra == 'reactable'
|
|
81
|
+
Provides-Extra: surfaces
|
|
82
|
+
Requires-Dist: mplsoccer>=1.2; extra == 'surfaces'
|
|
83
|
+
Requires-Dist: sportypy>=1.0; extra == 'surfaces'
|
|
84
|
+
Provides-Extra: svg
|
|
85
|
+
Requires-Dist: resvg-py>=0.2.5; extra == 'svg'
|
|
86
|
+
Provides-Extra: tables
|
|
87
|
+
Requires-Dist: great-tables>=1.0; extra == 'tables'
|
|
88
|
+
Requires-Dist: htmltools>=0.4.1; extra == 'tables'
|
|
89
|
+
Requires-Dist: nokap>=0.1; extra == 'tables'
|
|
90
|
+
Description-Content-Type: text/markdown
|
|
91
|
+
|
|
92
|
+
# **sdvplot** <a href='https://sdvplot.sportsdataverse.org/'><img src='https://raw.githubusercontent.com/sportsdataverse/sdvplot/main/docs/static/img/sdvplot-logo.png' align="right" width="25%" min-width="120px" alt="sdvplot hex logo" /></a>
|
|
93
|
+
|
|
94
|
+
[](https://pypi.org/project/sdvplot/)
|
|
95
|
+
[](https://pypi.org/project/sdvplot/)
|
|
96
|
+
[](https://www.npmjs.com/package/@sportsdataverse/sdvplot)
|
|
97
|
+
[](https://pypistats.org/packages/sdvplot)
|
|
98
|
+
[](https://pepy.tech/projects/sdvplot)
|
|
99
|
+
[](https://github.com/sportsdataverse/sdvplot/actions/workflows/tests.yml)
|
|
100
|
+
[](https://github.com/sportsdataverse/sdvplot/actions/workflows/quality.yml)
|
|
101
|
+
[](https://sdvplot.sportsdataverse.org)
|
|
102
|
+
[](https://lifecycle.r-lib.org/articles/stages.html#experimental)
|
|
103
|
+
[](https://github.com/sportsdataverse/sdvplot/blob/main/LICENSE)
|
|
104
|
+
[](https://github.com/sportsdataverse/sdvplot/graphs/contributors)
|
|
105
|
+
[](https://x.com/SportsDataverse)
|
|
106
|
+
|
|
107
|
+
Team logos, wordmarks, headshots and colors for Python plots and tables, from the SportsDataverse logo archive. It
|
|
108
|
+
resolves team abbreviations, names and provider ids across 28 leagues and picks the right era's mark for a season. Colors
|
|
109
|
+
and logos work with any library through `palette()`, `team_colors()`, `logo_url()` and `logo_image()`, and the
|
|
110
|
+
`add_logos()`, `add_wordmarks()` and `add_headshots()` adapters draw them on matplotlib (and seaborn), plotnine, plotly,
|
|
111
|
+
altair, bokeh, holoviews, great_tables, folium and pygal plots, tables and maps. `sdvplot.great_tables` also ports
|
|
112
|
+
sdvplotR's table themes, cell styling, legends and image export, and `surface()` draws a league's field, court or rink
|
|
113
|
+
in a team's colors. The Python counterpart to [sdvplotR](https://sdvplotR.sportsdataverse.org/).
|
|
114
|
+
|
|
115
|
+
## **Installation**
|
|
116
|
+
|
|
117
|
+
```bash
|
|
118
|
+
pip install sdvplot
|
|
119
|
+
# or
|
|
120
|
+
uv add sdvplot
|
|
121
|
+
```
|
|
122
|
+
|
|
123
|
+
Plotting libraries are optional extras, for example
|
|
124
|
+
`pip install "sdvplot[mpl]"`. Each extra adds the libraries for one feature: `[svg]` lets `logo_image()`
|
|
125
|
+
rasterize SVG marks. With `[mpl]`, `[plotnine]`, `[plotly]`, `[altair]`, `[bokeh]`, `[holoviews]`, `[tables]`,
|
|
126
|
+
`[folium]` or `[pygal]`, `add_logos()`, `add_wordmarks()` and `add_headshots()` draw on that library's plots, tables and
|
|
127
|
+
maps; `axis_logos()` works on matplotlib, seaborn, plotnine, Plotly and Altair. `[surfaces]` is for `surface()`, and
|
|
128
|
+
`[reactable]` and `[plottable]` add column helpers (`sdvplot.reactable`, `sdvplot.plottable`). `sdvplot.pydeck`
|
|
129
|
+
builds deck.gl layers (team logos, team-colored arcs, sportypy surfaces) for pydeck, and `sdvplot.perspective`
|
|
130
|
+
Perspective viewer configs in team colors and a logo column (Python 3.11+).
|
|
131
|
+
|
|
132
|
+
| Extra | Adds |
|
|
133
|
+
| --- | --- |
|
|
134
|
+
| `[mpl]` | matplotlib |
|
|
135
|
+
| `[plotnine]` | plotnine |
|
|
136
|
+
| `[plotly]` | plotly |
|
|
137
|
+
| `[altair]` | altair |
|
|
138
|
+
| `[bokeh]` | bokeh |
|
|
139
|
+
| `[holoviews]` | holoviews |
|
|
140
|
+
| `[tables]` | great_tables |
|
|
141
|
+
| `[reactable]` | reactable (reactable-py) |
|
|
142
|
+
| `[folium]` | folium |
|
|
143
|
+
| `[svg]` | resvg-py, for SVG marks |
|
|
144
|
+
| `[surfaces]` | sportypy and mplsoccer |
|
|
145
|
+
| `[plottable]` | plottable |
|
|
146
|
+
| `[pygal]` | pygal |
|
|
147
|
+
| `[pydeck]` | pydeck, for `sdvplot.pydeck`'s layers and `deck()` |
|
|
148
|
+
| `[perspective]` | perspective-python (with its Jupyter widget), for `sdvplot.perspective`; Python 3.11+ |
|
|
149
|
+
| `[all]` | everything above |
|
|
150
|
+
|
|
151
|
+
### JavaScript / TypeScript
|
|
152
|
+
|
|
153
|
+
The same colors, logos, wordmarks and headshots are on npm as
|
|
154
|
+
[`@sportsdataverse/sdvplot`](https://www.npmjs.com/package/@sportsdataverse/sdvplot), with integrations for Observable
|
|
155
|
+
Plot, D3, React, Chart.js, Plotly, Vega-Lite and ECharts, plus shot charts and linked interactivity. Its siblings
|
|
156
|
+
[`@sportsdataverse/sporty`](https://www.npmjs.com/package/@sportsdataverse/sporty) (playing surfaces) and
|
|
157
|
+
[`@sportsdataverse/sdvtables`](https://www.npmjs.com/package/@sportsdataverse/sdvtables) (tables) ship from the same
|
|
158
|
+
[sdvplot-js repo](https://github.com/sportsdataverse/sdvplot-js). Docs for all three:
|
|
159
|
+
[plot.sportsdataverse.org](https://plot.sportsdataverse.org/).
|
|
160
|
+
|
|
161
|
+
```bash
|
|
162
|
+
npm install @sportsdataverse/sdvplot
|
|
163
|
+
```
|
|
164
|
+
|
|
165
|
+
## **Usage**
|
|
166
|
+
|
|
167
|
+
Team identity, colors and marks:
|
|
168
|
+
|
|
169
|
+
```python
|
|
170
|
+
import sdvplot
|
|
171
|
+
|
|
172
|
+
sdvplot.resolve(["LV", "OAK", "Las Vegas Raiders"], "nfl") # ['13', '13', '13']
|
|
173
|
+
sdvplot.palette("nfl", teams=["LV", "KC"]) # {'LV': '#000000', 'KC': '#e31837'}
|
|
174
|
+
sdvplot.logo_url("OAK", "nfl", season=2010) # the Oakland-era mark
|
|
175
|
+
img = sdvplot.logo_image("LV", "nfl", size=128) # a PIL image
|
|
176
|
+
```
|
|
177
|
+
|
|
178
|
+
Logos on a plot, here the 2024 AFC playoff field in seed order:
|
|
179
|
+
|
|
180
|
+
```python
|
|
181
|
+
import matplotlib.pyplot as plt
|
|
182
|
+
import sdvplot
|
|
183
|
+
|
|
184
|
+
seeds = ["KC", "BUF", "BAL", "HOU", "LAC", "PIT", "DEN"]
|
|
185
|
+
x = list(range(1, 8))
|
|
186
|
+
fig, ax = plt.subplots(figsize=(8, 1.6))
|
|
187
|
+
sdvplot.add_logos(ax, x, [0] * 7, seeds, league="nfl", height=0.7)
|
|
188
|
+
ax.set(xlim=(0.5, 7.5), ylim=(-1, 1), xticks=x, yticks=[], title="2024 AFC playoff seeds")
|
|
189
|
+
```
|
|
190
|
+
|
|
191
|
+
Colors work in any library that takes a `{value: color}` mapping, for example seaborn:
|
|
192
|
+
`sns.barplot(data=df, x="team", y="epa", hue="team", palette=sdvplot.palette("nfl", teams=df["team"]))`.
|
|
193
|
+
|
|
194
|
+
`teams()` records where each team's colors come from in `color_source`: `nflverse` or `espn` when that source
|
|
195
|
+
publishes them, `logo` when they are derived from the team's archived logo because no source does, and `fallback` for
|
|
196
|
+
a placeholder that is not the team's colors (`cbbplotR` on the conference rows `teams(league, include_conferences=True)`
|
|
197
|
+
adds).
|
|
198
|
+
|
|
199
|
+
From the [gallery](https://sdvplot.sportsdataverse.org/docs/gallery), each drawn by sdvplot from the logo archive:
|
|
200
|
+
|
|
201
|
+
| | |
|
|
202
|
+
| --- | --- |
|
|
203
|
+
| 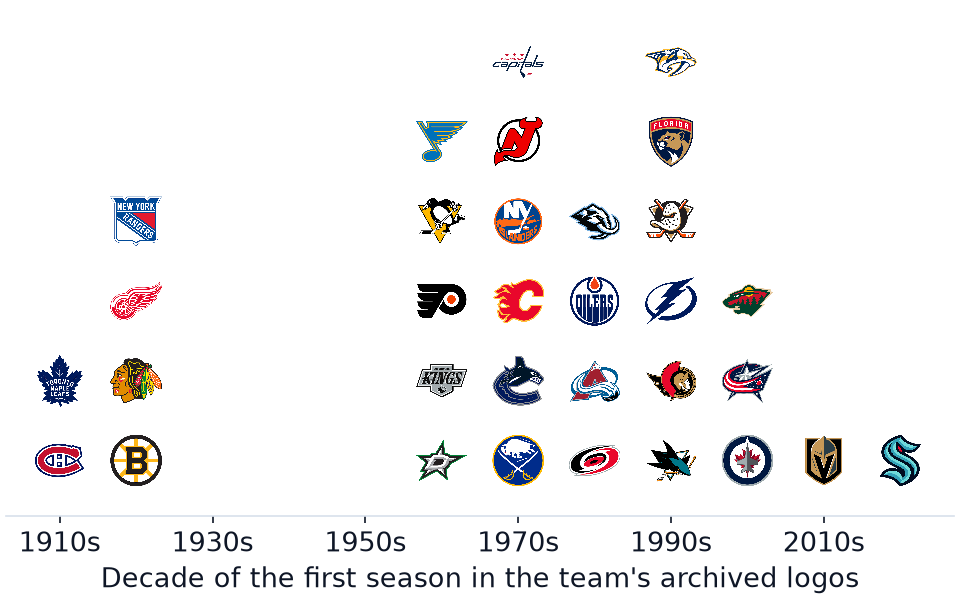 | 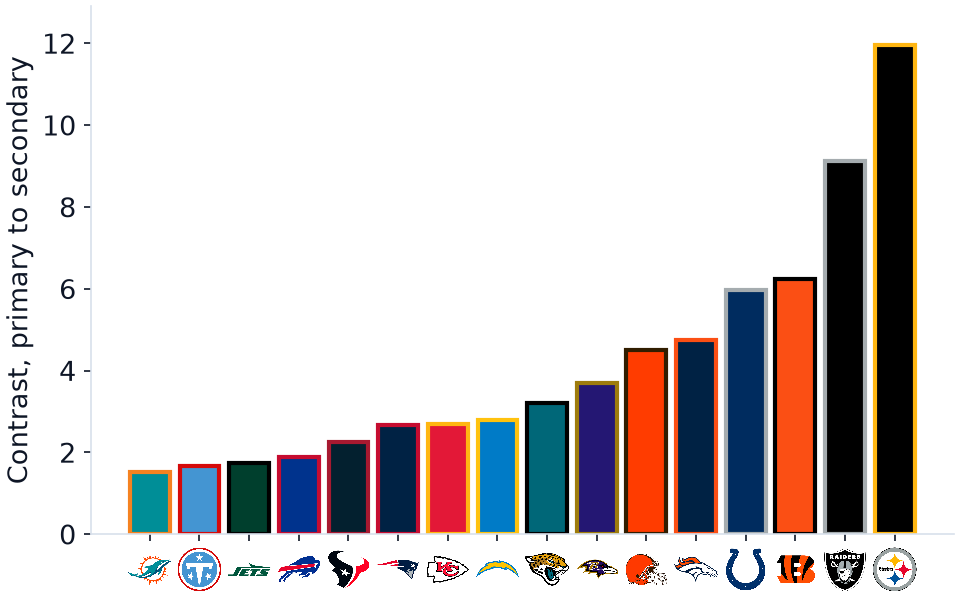 |
|
|
204
|
+
| `add_logos()` as scatter points: NHL teams by the decade their archived logos begin | Each AFC team's two colors from `palette()`, their contrast as the height, `axis_logos()` on the axis |
|
|
205
|
+
| 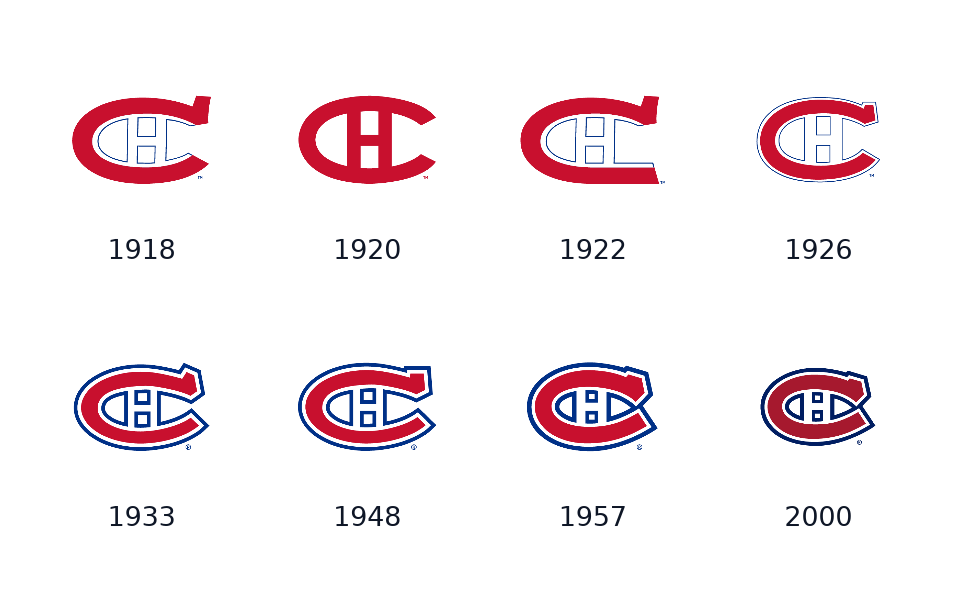 | 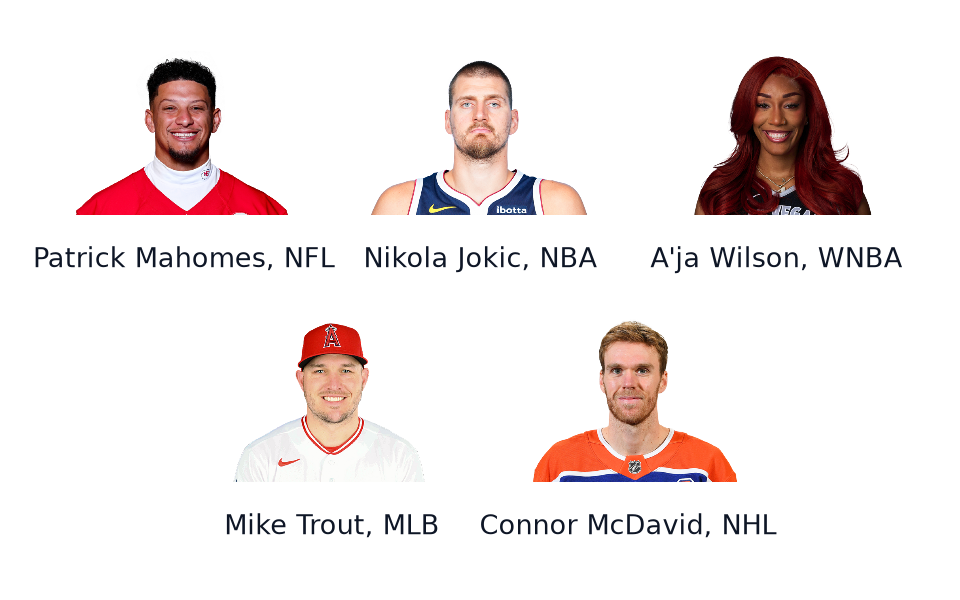 |
|
|
206
|
+
| One `add_logos()` call with `season=`: the mark Montreal used each season | `add_headshots()` with ESPN athlete ids, one player from each of five leagues |
|
|
207
|
+
|
|
208
|
+
## **Documentation**
|
|
209
|
+
|
|
210
|
+
The [**`sdvplot`** documentation website](https://sdvplot.sportsdataverse.org) has the
|
|
211
|
+
[getting started guide](https://sdvplot.sportsdataverse.org/docs/intro), the
|
|
212
|
+
[API reference](https://sdvplot.sportsdataverse.org/docs/reference) and the
|
|
213
|
+
[gallery](https://sdvplot.sportsdataverse.org/docs/gallery), plus:
|
|
214
|
+
|
|
215
|
+
**League tutorials:**
|
|
216
|
+
[NFL](https://sdvplot.sportsdataverse.org/docs/tutorials/leagues/nfl) ·
|
|
217
|
+
[CFB](https://sdvplot.sportsdataverse.org/docs/tutorials/leagues/cfb) ·
|
|
218
|
+
[NBA](https://sdvplot.sportsdataverse.org/docs/tutorials/leagues/nba) ·
|
|
219
|
+
[WNBA](https://sdvplot.sportsdataverse.org/docs/tutorials/leagues/wnba) ·
|
|
220
|
+
[MBB](https://sdvplot.sportsdataverse.org/docs/tutorials/leagues/mbb) ·
|
|
221
|
+
[WBB](https://sdvplot.sportsdataverse.org/docs/tutorials/leagues/wbb) ·
|
|
222
|
+
[MLB](https://sdvplot.sportsdataverse.org/docs/tutorials/leagues/mlb) ·
|
|
223
|
+
[NHL](https://sdvplot.sportsdataverse.org/docs/tutorials/leagues/nhl) ·
|
|
224
|
+
[PWHL](https://sdvplot.sportsdataverse.org/docs/tutorials/leagues/pwhl) ·
|
|
225
|
+
[Soccer](https://sdvplot.sportsdataverse.org/docs/tutorials/leagues/soccer) ·
|
|
226
|
+
[Cricket](https://sdvplot.sportsdataverse.org/docs/tutorials/leagues/cricket)
|
|
227
|
+
|
|
228
|
+
**Cookbooks:**
|
|
229
|
+
[Matplotlib logos](https://sdvplot.sportsdataverse.org/docs/cookbooks/matplotlib-logos) ·
|
|
230
|
+
[Colors and themes](https://sdvplot.sportsdataverse.org/docs/cookbooks/colors-and-themes) ·
|
|
231
|
+
[Tables](https://sdvplot.sportsdataverse.org/docs/cookbooks/tables) ·
|
|
232
|
+
[Interactive web](https://sdvplot.sportsdataverse.org/docs/cookbooks/interactive-web) ·
|
|
233
|
+
[plotnine](https://sdvplot.sportsdataverse.org/docs/cookbooks/plotnine) ·
|
|
234
|
+
[Surfaces and shot charts](https://sdvplot.sportsdataverse.org/docs/cookbooks/surfaces-and-shot-charts)
|
|
235
|
+
|
|
236
|
+
**Recipes, leaderboards and automation:**
|
|
237
|
+
[Head-to-head card](https://sdvplot.sportsdataverse.org/docs/recipes/head-to-head-card) ·
|
|
238
|
+
[CFB conference table](https://sdvplot.sportsdataverse.org/docs/recipes/cfb-conference-table) ·
|
|
239
|
+
[NFL weekly leaderboard](https://sdvplot.sportsdataverse.org/docs/leaderboards/nfl-weekly) ·
|
|
240
|
+
[Social game-day graphics](https://sdvplot.sportsdataverse.org/docs/automation)
|
|
241
|
+
|
|
242
|
+
The [changelog](https://github.com/sportsdataverse/sdvplot/blob/main/CHANGELOG.md) lists every release, and
|
|
243
|
+
[contributing](https://github.com/sportsdataverse/sdvplot/blob/main/CONTRIBUTING.md) covers development.
|
|
244
|
+
|
|
245
|
+
### Environment variables
|
|
246
|
+
|
|
247
|
+
- `SDVPLOT_CACHE_DIR`: cache root.
|
|
248
|
+
- `SDVPLOT_CACHE_TTL`: cache lifetime in days (default 7).
|
|
249
|
+
- `SDVPLOT_LIVE_TESTS=1`: enable the network tests.
|
|
250
|
+
|
|
251
|
+
<!-- cheatsheet-section -->
|
|
252
|
+
## **Cheat sheet**
|
|
253
|
+
|
|
254
|
+
A printable four-page reference for **sdvplot**: team identity and colours, the nine plotting adapters, the
|
|
255
|
+
great_tables toolkit, surfaces and coordinates, in four colour themes, light and dark.
|
|
256
|
+
|
|
257
|
+
📄 **[Download the sdvplot cheat sheet (PDF)](https://sportsdataverse.org/cheatsheets/sdvplot.pdf)**
|
|
258
|
+
|
|
259
|
+
Browse the other SportsDataverse cheat sheets at
|
|
260
|
+
**[sportsdataverse.org/cheatsheets](https://sportsdataverse.org/cheatsheets)**.
|
|
261
|
+
|
|
262
|
+
## **Logos, trademarks and data**
|
|
263
|
+
|
|
264
|
+
Team names, logos, wordmarks and player headshots are trademarks or copyrighted works of their respective leagues,
|
|
265
|
+
teams, schools and other rights holders. sdvplot is not affiliated with, sponsored by or endorsed by any of them, and
|
|
266
|
+
using sdvplot to draw a mark grants no right to use it. The package ships no logo files: the wheel carries only an
|
|
267
|
+
index of team names, ids and colors, and marks are fetched at runtime from the
|
|
268
|
+
[SportsDataverse logo archive](https://github.com/sportsdataverse/sdv-assets), headshots from ESPN (or, for NFL gsis
|
|
269
|
+
ids, the URLs in nflverse's player table). Use of any mark in your own work is
|
|
270
|
+
governed by that owner's terms, and following them is your responsibility. The [MIT license](https://github.com/sportsdataverse/sdvplot/blob/main/LICENSE)
|
|
271
|
+
covers the sdvplot code only; team data belongs to its respective owners and sources.
|
|
272
|
+
|
|
273
|
+
## **The SportsDataverse**
|
|
274
|
+
|
|
275
|
+
`sdvplot` draws the pictures; the companion packages fetch the data.
|
|
276
|
+
|
|
277
|
+
| Package | Sport / Scope |
|
|
278
|
+
| --- | --- |
|
|
279
|
+
| [**sportsdataverse-py**](https://py.sportsdataverse.org/) | SportsDataverse data for Python: NFL, CFB, NBA, WNBA, MBB, WBB, MLB, NHL, PWHL, soccer and more |
|
|
280
|
+
| [**sdvplotR**](https://sdvplotR.sportsdataverse.org/) | The R package this one mirrors |
|
|
281
|
+
| [**sdvplot-js**](https://plot.sportsdataverse.org/) | The JavaScript port: `@sportsdataverse/sdvplot`, `@sportsdataverse/sporty` and `@sportsdataverse/sdvtables` on npm |
|
|
282
|
+
| [**sportypy**](https://sportypy.sportsdataverse.org/) | Playing-surface plots for Python |
|
|
283
|
+
| [**nflreadpy**](https://github.com/nflverse/nflreadpy) | nflverse data loaders for Python |
|
|
284
|
+
| [**sportsdataverse-R**](https://r.sportsdataverse.org/) · [**sportsdataverse.js**](https://js.sportsdataverse.org/) | R and Node.js |
|
|
285
|
+
|
|
286
|
+
See the full ecosystem at [sportsdataverse.org](https://sportsdataverse.org/).
|
|
287
|
+
|
|
288
|
+
## **Follow the [SportsDataverse](https://x.com/SportsDataverse) on X and star this repo**
|
|
289
|
+
|
|
290
|
+
[](https://x.com/SportsDataverse)
|
|
291
|
+
[](https://github.com/sportsdataverse/sdvplot/stargazers/)
|
|
292
|
+
|
|
293
|
+
<a href="https://github.com/sportsdataverse/sdvplot/stargazers">
|
|
294
|
+
<picture>
|
|
295
|
+
<source media="(prefers-color-scheme: dark)" srcset="https://raw.githubusercontent.com/sportsdataverse/sdvplot/star-history/star-history-dark.svg">
|
|
296
|
+
<img alt="Star history of sportsdataverse/sdvplot" src="https://raw.githubusercontent.com/sportsdataverse/sdvplot/star-history/star-history.png" width="600">
|
|
297
|
+
</picture>
|
|
298
|
+
</a>
|
|
299
|
+
|
|
300
|
+
## **Our Authors**
|
|
301
|
+
|
|
302
|
+
- [Saiem Gilani](https://x.com/saiemgilani)
|
|
303
|
+
<a href="https://x.com/saiemgilani" target="blank"><img src="https://img.shields.io/twitter/follow/saiemgilani?color=blue&label=%40saiemgilani&logo=x&style=for-the-badge" alt="@saiemgilani" /></a>
|
|
304
|
+
<a href="https://github.com/saiemgilani" target="blank"><img src="https://img.shields.io/github/followers/saiemgilani?color=eee&logo=Github&style=for-the-badge" alt="@saiemgilani" /></a>
|
|
305
|
+
|
|
306
|
+
## **Citations**
|
|
307
|
+
|
|
308
|
+
To cite [**`sdvplot`**](https://sdvplot.sportsdataverse.org) in publications, use:
|
|
309
|
+
|
|
310
|
+
BibTeX Citation
|
|
311
|
+
|
|
312
|
+
```bibtex
|
|
313
|
+
@misc{gilani_2026_sdvplot,
|
|
314
|
+
author = {Gilani, Saiem},
|
|
315
|
+
title = {sdvplot: Team logos, wordmarks, headshots and colors for Python plots and tables},
|
|
316
|
+
url = {https://sdvplot.sportsdataverse.org},
|
|
317
|
+
year = {2026}
|
|
318
|
+
}
|
|
319
|
+
```
|