scope-profiler 0.3.2__tar.gz → 0.3.4__tar.gz
This diff represents the content of publicly available package versions that have been released to one of the supported registries. The information contained in this diff is provided for informational purposes only and reflects changes between package versions as they appear in their respective public registries.
- scope_profiler-0.3.4/PKG-INFO +157 -0
- scope_profiler-0.3.4/README.md +89 -0
- {scope_profiler-0.3.2 → scope_profiler-0.3.4}/pyproject.toml +14 -3
- {scope_profiler-0.3.2 → scope_profiler-0.3.4}/src/scope_profiler/__init__.py +10 -0
- {scope_profiler-0.3.2 → scope_profiler-0.3.4}/src/scope_profiler/__main__.py +130 -5
- scope_profiler-0.3.4/src/scope_profiler/benchmark.py +234 -0
- scope_profiler-0.3.4/src/scope_profiler/call_stack.py +384 -0
- {scope_profiler-0.3.2 → scope_profiler-0.3.4}/src/scope_profiler/diff.py +10 -18
- scope_profiler-0.3.4/src/scope_profiler/gpu_timing.py +122 -0
- {scope_profiler-0.3.2 → scope_profiler-0.3.4}/src/scope_profiler/h5reader.py +146 -3
- scope_profiler-0.3.4/src/scope_profiler/h5schema.py +54 -0
- scope_profiler-0.3.4/src/scope_profiler/h5writer.py +1025 -0
- scope_profiler-0.3.4/src/scope_profiler/html_report.py +650 -0
- {scope_profiler-0.3.2 → scope_profiler-0.3.4}/src/scope_profiler/line_profile_cli.py +19 -8
- {scope_profiler-0.3.2 → scope_profiler-0.3.4}/src/scope_profiler/mcp_server/server.py +21 -5
- {scope_profiler-0.3.2 → scope_profiler-0.3.4}/src/scope_profiler/mcp_server/tools.py +27 -5
- {scope_profiler-0.3.2 → scope_profiler-0.3.4}/src/scope_profiler/mpi_region.py +43 -2
- scope_profiler-0.3.4/src/scope_profiler/plotting_scripts.py +3899 -0
- {scope_profiler-0.3.2 → scope_profiler-0.3.4}/src/scope_profiler/post_processing.py +186 -22
- scope_profiler-0.3.4/src/scope_profiler/prof_export.py +373 -0
- {scope_profiler-0.3.2 → scope_profiler-0.3.4}/src/scope_profiler/profile_config.py +161 -0
- {scope_profiler-0.3.2 → scope_profiler-0.3.4}/src/scope_profiler/profile_manager.py +484 -47
- {scope_profiler-0.3.2 → scope_profiler-0.3.4}/src/scope_profiler/region.py +168 -17
- {scope_profiler-0.3.2 → scope_profiler-0.3.4}/src/scope_profiler/region_profiler.py +335 -10
- {scope_profiler-0.3.2 → scope_profiler-0.3.4}/src/scope_profiler/results.py +141 -24
- {scope_profiler-0.3.2 → scope_profiler-0.3.4}/src/scope_profiler/speedscope_export.py +25 -41
- {scope_profiler-0.3.2 → scope_profiler-0.3.4}/src/scope_profiler/summary.py +79 -68
- {scope_profiler-0.3.2 → scope_profiler-0.3.4}/src/scope_profiler/tests/check_mpi_launch.py +11 -1
- scope_profiler-0.3.4/src/scope_profiler/tests/check_parallel_hdf5.py +101 -0
- scope_profiler-0.3.4/src/scope_profiler/tests/test_aggregation.py +47 -0
- {scope_profiler-0.3.2 → scope_profiler-0.3.4}/src/scope_profiler/tests/test_app.py +67 -3
- scope_profiler-0.3.4/src/scope_profiler/tests/test_benchmark.py +75 -0
- {scope_profiler-0.3.2 → scope_profiler-0.3.4}/src/scope_profiler/tests/test_buffer_growth.py +3 -6
- {scope_profiler-0.3.2 → scope_profiler-0.3.4}/src/scope_profiler/tests/test_diff.py +1 -1
- scope_profiler-0.3.4/src/scope_profiler/tests/test_html_report.py +229 -0
- {scope_profiler-0.3.2 → scope_profiler-0.3.4}/src/scope_profiler/tests/test_in_memory_results.py +60 -0
- {scope_profiler-0.3.2 → scope_profiler-0.3.4}/src/scope_profiler/tests/test_inspection.py +7 -6
- {scope_profiler-0.3.2 → scope_profiler-0.3.4}/src/scope_profiler/tests/test_line_profile_cli.py +3 -2
- {scope_profiler-0.3.2 → scope_profiler-0.3.4}/src/scope_profiler/tests/test_main_cli.py +31 -0
- {scope_profiler-0.3.2 → scope_profiler-0.3.4}/src/scope_profiler/tests/test_mcp_server.py +9 -2
- {scope_profiler-0.3.2 → scope_profiler-0.3.4}/src/scope_profiler/tests/test_post_processing.py +521 -19
- {scope_profiler-0.3.2 → scope_profiler-0.3.4}/src/scope_profiler/tests/test_prof_export.py +120 -25
- scope_profiler-0.3.4/src/scope_profiler/tests/test_profile_config_toml.py +89 -0
- {scope_profiler-0.3.2 → scope_profiler-0.3.4}/src/scope_profiler/tests/test_region_source.py +4 -49
- {scope_profiler-0.3.2 → scope_profiler-0.3.4}/src/scope_profiler/tests/test_repeated_finalize.py +89 -0
- {scope_profiler-0.3.2 → scope_profiler-0.3.4}/src/scope_profiler/tests/test_results_api.py +163 -4
- {scope_profiler-0.3.2 → scope_profiler-0.3.4}/src/scope_profiler/tests/test_speedscope_export.py +40 -15
- scope_profiler-0.3.4/src/scope_profiler/tests/test_tui.py +324 -0
- scope_profiler-0.3.4/src/scope_profiler/tests/unit/test_call_stack.py +184 -0
- scope_profiler-0.3.4/src/scope_profiler/tests/unit/test_h5writer.py +475 -0
- {scope_profiler-0.3.2 → scope_profiler-0.3.4}/src/scope_profiler/tests/unit/test_payload_collection.py +95 -4
- scope_profiler-0.3.4/src/scope_profiler/tui.py +1493 -0
- scope_profiler-0.3.4/src/scope_profiler.egg-info/PKG-INFO +157 -0
- {scope_profiler-0.3.2 → scope_profiler-0.3.4}/src/scope_profiler.egg-info/SOURCES.txt +10 -0
- {scope_profiler-0.3.2 → scope_profiler-0.3.4}/src/scope_profiler.egg-info/requires.txt +13 -2
- scope_profiler-0.3.2/PKG-INFO +0 -606
- scope_profiler-0.3.2/README.md +0 -545
- scope_profiler-0.3.2/src/scope_profiler/call_stack.py +0 -123
- scope_profiler-0.3.2/src/scope_profiler/h5writer.py +0 -183
- scope_profiler-0.3.2/src/scope_profiler/plotting_scripts.py +0 -2138
- scope_profiler-0.3.2/src/scope_profiler/prof_export.py +0 -211
- scope_profiler-0.3.2/src/scope_profiler/tests/test_tui.py +0 -141
- scope_profiler-0.3.2/src/scope_profiler/tests/unit/test_h5writer.py +0 -244
- scope_profiler-0.3.2/src/scope_profiler/tui.py +0 -650
- scope_profiler-0.3.2/src/scope_profiler.egg-info/PKG-INFO +0 -606
- {scope_profiler-0.3.2 → scope_profiler-0.3.4}/setup.cfg +0 -0
- {scope_profiler-0.3.2 → scope_profiler-0.3.4}/src/scope_profiler/c/Makefile +0 -0
- {scope_profiler-0.3.2 → scope_profiler-0.3.4}/src/scope_profiler/c/example.c +0 -0
- {scope_profiler-0.3.2 → scope_profiler-0.3.4}/src/scope_profiler/c/scope_profiler.c +0 -0
- {scope_profiler-0.3.2 → scope_profiler-0.3.4}/src/scope_profiler/c/scope_profiler.h +0 -0
- {scope_profiler-0.3.2 → scope_profiler-0.3.4}/src/scope_profiler/fortran/Makefile +0 -0
- {scope_profiler-0.3.2 → scope_profiler-0.3.4}/src/scope_profiler/fortran/example.f90 +0 -0
- {scope_profiler-0.3.2 → scope_profiler-0.3.4}/src/scope_profiler/fortran/scope_profiler.f90 +0 -0
- {scope_profiler-0.3.2 → scope_profiler-0.3.4}/src/scope_profiler/inspection.py +0 -0
- {scope_profiler-0.3.2 → scope_profiler-0.3.4}/src/scope_profiler/likwid_data.py +0 -0
- {scope_profiler-0.3.2 → scope_profiler-0.3.4}/src/scope_profiler/mcp_server/__init__.py +0 -0
- {scope_profiler-0.3.2 → scope_profiler-0.3.4}/src/scope_profiler/mcp_server/__main__.py +0 -0
- {scope_profiler-0.3.2 → scope_profiler-0.3.4}/src/scope_profiler/metadata.py +0 -0
- {scope_profiler-0.3.2 → scope_profiler-0.3.4}/src/scope_profiler/mpi_launch.py +0 -0
- {scope_profiler-0.3.2 → scope_profiler-0.3.4}/src/scope_profiler/native_trace.py +0 -0
- {scope_profiler-0.3.2 → scope_profiler-0.3.4}/src/scope_profiler/tests/__init__.py +0 -0
- {scope_profiler-0.3.2 → scope_profiler-0.3.4}/src/scope_profiler/tests/examples.py +0 -0
- {scope_profiler-0.3.2 → scope_profiler-0.3.4}/src/scope_profiler/tests/examples_pylikwid.py +0 -0
- {scope_profiler-0.3.2 → scope_profiler-0.3.4}/src/scope_profiler/tests/pylikwid_readme.py +0 -0
- {scope_profiler-0.3.2 → scope_profiler-0.3.4}/src/scope_profiler/tests/test_c_api.py +0 -0
- {scope_profiler-0.3.2 → scope_profiler-0.3.4}/src/scope_profiler/tests/test_fortran_api.py +0 -0
- {scope_profiler-0.3.2 → scope_profiler-0.3.4}/src/scope_profiler/tests/test_label.py +0 -0
- {scope_profiler-0.3.2 → scope_profiler-0.3.4}/src/scope_profiler/tests/test_likwid_data.py +0 -0
- {scope_profiler-0.3.2 → scope_profiler-0.3.4}/src/scope_profiler/tests/test_mcp_tools.py +0 -0
- {scope_profiler-0.3.2 → scope_profiler-0.3.4}/src/scope_profiler/tests/test_metadata.py +0 -0
- {scope_profiler-0.3.2 → scope_profiler-0.3.4}/src/scope_profiler/tests/test_mixed_language.py +0 -0
- {scope_profiler-0.3.2 → scope_profiler-0.3.4}/src/scope_profiler/tests/test_mpi.py +0 -0
- {scope_profiler-0.3.2 → scope_profiler-0.3.4}/src/scope_profiler/tests/test_overhead.py +0 -0
- {scope_profiler-0.3.2 → scope_profiler-0.3.4}/src/scope_profiler/tests/test_readme.py +0 -0
- {scope_profiler-0.3.2 → scope_profiler-0.3.4}/src/scope_profiler/tests/test_summary_likwid.py +0 -0
- {scope_profiler-0.3.2 → scope_profiler-0.3.4}/src/scope_profiler/tests/unit/__init__.py +0 -0
- {scope_profiler-0.3.2 → scope_profiler-0.3.4}/src/scope_profiler/tests/unit/test_lazy_config.py +0 -0
- {scope_profiler-0.3.2 → scope_profiler-0.3.4}/src/scope_profiler/tests/unit/test_likwid_child_env.py +0 -0
- {scope_profiler-0.3.2 → scope_profiler-0.3.4}/src/scope_profiler/tests/unit/test_merge_results.py +0 -0
- {scope_profiler-0.3.2 → scope_profiler-0.3.4}/src/scope_profiler/tests/unit/test_mpi_launch.py +0 -0
- {scope_profiler-0.3.2 → scope_profiler-0.3.4}/src/scope_profiler.egg-info/dependency_links.txt +0 -0
- {scope_profiler-0.3.2 → scope_profiler-0.3.4}/src/scope_profiler.egg-info/entry_points.txt +0 -0
- {scope_profiler-0.3.2 → scope_profiler-0.3.4}/src/scope_profiler.egg-info/top_level.txt +0 -0
|
@@ -0,0 +1,157 @@
|
|
|
1
|
+
Metadata-Version: 2.4
|
|
2
|
+
Name: scope-profiler
|
|
3
|
+
Version: 0.3.4
|
|
4
|
+
Summary: Profile code regions in python, optionally with LIKWID markers.
|
|
5
|
+
Author: Max
|
|
6
|
+
Project-URL: Source, https://github.com/max-models/scope-profiler
|
|
7
|
+
Keywords: python
|
|
8
|
+
Classifier: Development Status :: 3 - Alpha
|
|
9
|
+
Classifier: Programming Language :: Python :: 3 :: Only
|
|
10
|
+
Classifier: Programming Language :: Python :: 3.10
|
|
11
|
+
Classifier: Programming Language :: Python :: 3.11
|
|
12
|
+
Classifier: Programming Language :: Python :: 3.12
|
|
13
|
+
Classifier: Programming Language :: Python :: 3.13
|
|
14
|
+
Classifier: Programming Language :: Python :: 3.14
|
|
15
|
+
Requires-Python: >=3.10
|
|
16
|
+
Description-Content-Type: text/markdown
|
|
17
|
+
Requires-Dist: h5py
|
|
18
|
+
Requires-Dist: numpy
|
|
19
|
+
Requires-Dist: tabulate
|
|
20
|
+
Requires-Dist: tomli>=2.0; python_version < "3.11"
|
|
21
|
+
Provides-Extra: fortran
|
|
22
|
+
Requires-Dist: meson; extra == "fortran"
|
|
23
|
+
Requires-Dist: ninja; extra == "fortran"
|
|
24
|
+
Provides-Extra: compression
|
|
25
|
+
Requires-Dist: hdf5plugin; extra == "compression"
|
|
26
|
+
Provides-Extra: likwid
|
|
27
|
+
Requires-Dist: pylikwid; extra == "likwid"
|
|
28
|
+
Provides-Extra: line-profiler
|
|
29
|
+
Requires-Dist: line-profiler; extra == "line-profiler"
|
|
30
|
+
Provides-Extra: nvtx
|
|
31
|
+
Requires-Dist: nvtx; extra == "nvtx"
|
|
32
|
+
Provides-Extra: mcp
|
|
33
|
+
Requires-Dist: mcp<2.0.0,>=1.6.0; extra == "mcp"
|
|
34
|
+
Provides-Extra: mpi
|
|
35
|
+
Requires-Dist: mpi4py; extra == "mpi"
|
|
36
|
+
Provides-Extra: pproc
|
|
37
|
+
Requires-Dist: ipykernel; extra == "pproc"
|
|
38
|
+
Requires-Dist: jupyterlab; extra == "pproc"
|
|
39
|
+
Requires-Dist: matplotlib; extra == "pproc"
|
|
40
|
+
Requires-Dist: maxplotlibx>=0.1.8; extra == "pproc"
|
|
41
|
+
Requires-Dist: pandas; extra == "pproc"
|
|
42
|
+
Requires-Dist: plotly; extra == "pproc"
|
|
43
|
+
Requires-Dist: snakeviz; extra == "pproc"
|
|
44
|
+
Requires-Dist: tabulate; extra == "pproc"
|
|
45
|
+
Requires-Dist: textual>=0.86; extra == "pproc"
|
|
46
|
+
Provides-Extra: graph
|
|
47
|
+
Requires-Dist: pyvis>=0.3.2; extra == "graph"
|
|
48
|
+
Provides-Extra: dev
|
|
49
|
+
Requires-Dist: black[jupyter]; extra == "dev"
|
|
50
|
+
Requires-Dist: isort>=9.0.0; extra == "dev"
|
|
51
|
+
Requires-Dist: ruff; extra == "dev"
|
|
52
|
+
Requires-Dist: scope-profiler[docs,fortran,line-profiler,mcp,mpi,nvtx,pproc,test,tui]; extra == "dev"
|
|
53
|
+
Provides-Extra: docs
|
|
54
|
+
Requires-Dist: myst-parser; extra == "docs"
|
|
55
|
+
Requires-Dist: nbconvert; extra == "docs"
|
|
56
|
+
Requires-Dist: nbsphinx; extra == "docs"
|
|
57
|
+
Requires-Dist: pre-commit; extra == "docs"
|
|
58
|
+
Requires-Dist: pyproject-fmt; extra == "docs"
|
|
59
|
+
Requires-Dist: sphinx; extra == "docs"
|
|
60
|
+
Requires-Dist: sphinx-book-theme; extra == "docs"
|
|
61
|
+
Requires-Dist: scope-profiler[line-profiler,pproc,tui]; extra == "docs"
|
|
62
|
+
Provides-Extra: test
|
|
63
|
+
Requires-Dist: coverage; extra == "test"
|
|
64
|
+
Requires-Dist: pytest; extra == "test"
|
|
65
|
+
Provides-Extra: tui
|
|
66
|
+
Requires-Dist: tabulate; extra == "tui"
|
|
67
|
+
Requires-Dist: textual>=0.86; extra == "tui"
|
|
68
|
+
|
|
69
|
+
|
|
70
|
+
|
|
71
|
+
<!-- Generated README.md is rendered from this file by docs/render_markdown.py. -->
|
|
72
|
+
|
|
73
|
+
# scope-profiler
|
|
74
|
+
|
|
75
|
+
Profile Python code regions—and optionally C, Fortran, MPI, NVTX, and
|
|
76
|
+
[LIKWID](https://github.com/RRZE-HPC/likwid)—with one consistent API and
|
|
77
|
+
HDF5 output format.
|
|
78
|
+
|
|
79
|
+
``` bash
|
|
80
|
+
pip install scope-profiler
|
|
81
|
+
```
|
|
82
|
+
|
|
83
|
+
## Quick start
|
|
84
|
+
|
|
85
|
+
``` python
|
|
86
|
+
from scope_profiler import ProfileManager
|
|
87
|
+
|
|
88
|
+
with ProfileManager.session():
|
|
89
|
+
@ProfileManager.profile("main")
|
|
90
|
+
def main():
|
|
91
|
+
with ProfileManager.profile_region("work"):
|
|
92
|
+
sum(range(100)) # replace with the code you want to measure
|
|
93
|
+
|
|
94
|
+
main()
|
|
95
|
+
# writes profiling_data.h5 and prints a summary
|
|
96
|
+
```
|
|
97
|
+
|
|
98
|
+
You can also profile a script without changing its source:
|
|
99
|
+
|
|
100
|
+
``` bash
|
|
101
|
+
scope-profiler run my_script.py
|
|
102
|
+
scope-profiler inspect profiling_data.h5
|
|
103
|
+
scope-profiler plot default profiling_data.h5 -o figures
|
|
104
|
+
scope-profiler report profiling_data.h5 -o report.html
|
|
105
|
+
```
|
|
106
|
+
|
|
107
|
+
## Example output
|
|
108
|
+
|
|
109
|
+
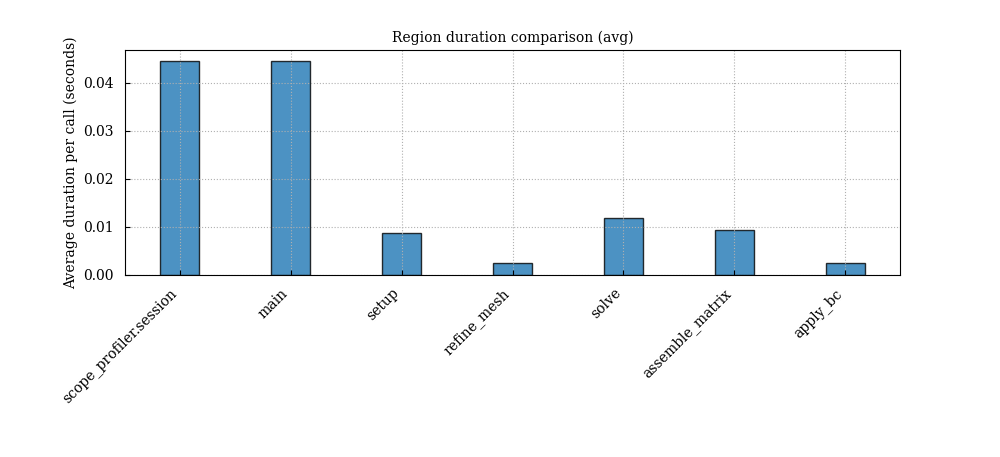
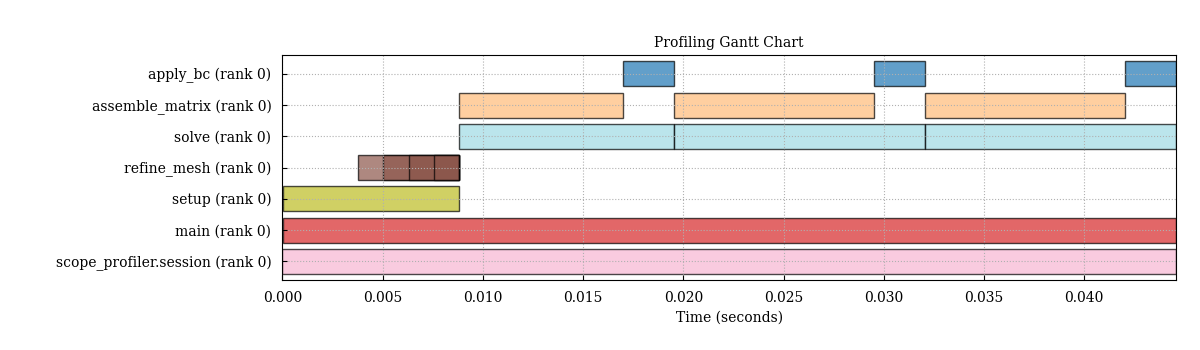
The plotting tools include duration summaries and timelines for finding
|
|
110
|
+
expensive regions:
|
|
111
|
+
|
|
112
|
+
|
|
114
|
+
|
|
115
|
+
|
|
117
|
+
|
|
118
|
+
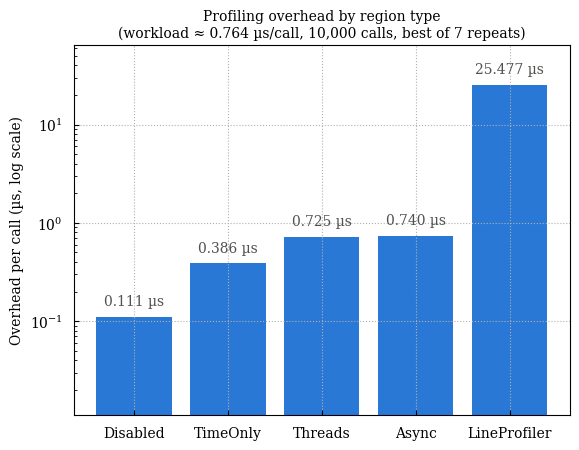
The overhead benchmark measures the cost of each instrumentation mode:
|
|
119
|
+
|
|
120
|
+
``` bash
|
|
121
|
+
python examples/benchmark_overhead.py
|
|
122
|
+
```
|
|
123
|
+
|
|
124
|
+
|
|
126
|
+
|
|
127
|
+
## Documentation
|
|
128
|
+
|
|
129
|
+
- [Installation](https://max-models.github.io/scope-profiler/installation.html)
|
|
130
|
+
- [Quick
|
|
131
|
+
start](https://max-models.github.io/scope-profiler/quickstart.html)
|
|
132
|
+
- [Python API and
|
|
133
|
+
post-processing](https://max-models.github.io/scope-profiler/guide/hdf5_and_python_api.html)
|
|
134
|
+
- [CLI reference](https://max-models.github.io/scope-profiler/cli.html)
|
|
135
|
+
- [Configuration and profiling
|
|
136
|
+
regions](https://max-models.github.io/scope-profiler/guide/configuration.html)
|
|
137
|
+
- [MPI](https://max-models.github.io/scope-profiler/guide/mpi.html),
|
|
138
|
+
[C](https://max-models.github.io/scope-profiler/guide/c.html), and
|
|
139
|
+
[Fortran](https://max-models.github.io/scope-profiler/guide/fortran.html)
|
|
140
|
+
- [LIKWID](https://max-models.github.io/scope-profiler/guide/likwid.html),
|
|
141
|
+
[line
|
|
142
|
+
profiling](https://max-models.github.io/scope-profiler/guide/line_profiler.html),
|
|
143
|
+
and [MCP](https://max-models.github.io/scope-profiler/guide/mcp.html)
|
|
144
|
+
- [Tutorial
|
|
145
|
+
notebooks](https://max-models.github.io/scope-profiler/tutorials.html)
|
|
146
|
+
- [Examples](https://github.com/max-models/scope-profiler/tree/devel/examples)
|
|
147
|
+
|
|
148
|
+
## Development
|
|
149
|
+
|
|
150
|
+
``` bash
|
|
151
|
+
pip install -e '.[dev]'
|
|
152
|
+
pytest
|
|
153
|
+
```
|
|
154
|
+
|
|
155
|
+
See
|
|
156
|
+
[AGENTS.md](https://github.com/max-models/scope-profiler/blob/devel/AGENTS.md)
|
|
157
|
+
for the measured benchmark workflow used when optimizing this project.
|
|
@@ -0,0 +1,89 @@
|
|
|
1
|
+
|
|
2
|
+
|
|
3
|
+
<!-- Generated README.md is rendered from this file by docs/render_markdown.py. -->
|
|
4
|
+
|
|
5
|
+
# scope-profiler
|
|
6
|
+
|
|
7
|
+
Profile Python code regions—and optionally C, Fortran, MPI, NVTX, and
|
|
8
|
+
[LIKWID](https://github.com/RRZE-HPC/likwid)—with one consistent API and
|
|
9
|
+
HDF5 output format.
|
|
10
|
+
|
|
11
|
+
``` bash
|
|
12
|
+
pip install scope-profiler
|
|
13
|
+
```
|
|
14
|
+
|
|
15
|
+
## Quick start
|
|
16
|
+
|
|
17
|
+
``` python
|
|
18
|
+
from scope_profiler import ProfileManager
|
|
19
|
+
|
|
20
|
+
with ProfileManager.session():
|
|
21
|
+
@ProfileManager.profile("main")
|
|
22
|
+
def main():
|
|
23
|
+
with ProfileManager.profile_region("work"):
|
|
24
|
+
sum(range(100)) # replace with the code you want to measure
|
|
25
|
+
|
|
26
|
+
main()
|
|
27
|
+
# writes profiling_data.h5 and prints a summary
|
|
28
|
+
```
|
|
29
|
+
|
|
30
|
+
You can also profile a script without changing its source:
|
|
31
|
+
|
|
32
|
+
``` bash
|
|
33
|
+
scope-profiler run my_script.py
|
|
34
|
+
scope-profiler inspect profiling_data.h5
|
|
35
|
+
scope-profiler plot default profiling_data.h5 -o figures
|
|
36
|
+
scope-profiler report profiling_data.h5 -o report.html
|
|
37
|
+
```
|
|
38
|
+
|
|
39
|
+
## Example output
|
|
40
|
+
|
|
41
|
+
The plotting tools include duration summaries and timelines for finding
|
|
42
|
+
expensive regions:
|
|
43
|
+
|
|
44
|
+

|
|
46
|
+
|
|
47
|
+

|
|
49
|
+
|
|
50
|
+
The overhead benchmark measures the cost of each instrumentation mode:
|
|
51
|
+
|
|
52
|
+
``` bash
|
|
53
|
+
python examples/benchmark_overhead.py
|
|
54
|
+
```
|
|
55
|
+
|
|
56
|
+

|
|
58
|
+
|
|
59
|
+
## Documentation
|
|
60
|
+
|
|
61
|
+
- [Installation](https://max-models.github.io/scope-profiler/installation.html)
|
|
62
|
+
- [Quick
|
|
63
|
+
start](https://max-models.github.io/scope-profiler/quickstart.html)
|
|
64
|
+
- [Python API and
|
|
65
|
+
post-processing](https://max-models.github.io/scope-profiler/guide/hdf5_and_python_api.html)
|
|
66
|
+
- [CLI reference](https://max-models.github.io/scope-profiler/cli.html)
|
|
67
|
+
- [Configuration and profiling
|
|
68
|
+
regions](https://max-models.github.io/scope-profiler/guide/configuration.html)
|
|
69
|
+
- [MPI](https://max-models.github.io/scope-profiler/guide/mpi.html),
|
|
70
|
+
[C](https://max-models.github.io/scope-profiler/guide/c.html), and
|
|
71
|
+
[Fortran](https://max-models.github.io/scope-profiler/guide/fortran.html)
|
|
72
|
+
- [LIKWID](https://max-models.github.io/scope-profiler/guide/likwid.html),
|
|
73
|
+
[line
|
|
74
|
+
profiling](https://max-models.github.io/scope-profiler/guide/line_profiler.html),
|
|
75
|
+
and [MCP](https://max-models.github.io/scope-profiler/guide/mcp.html)
|
|
76
|
+
- [Tutorial
|
|
77
|
+
notebooks](https://max-models.github.io/scope-profiler/tutorials.html)
|
|
78
|
+
- [Examples](https://github.com/max-models/scope-profiler/tree/devel/examples)
|
|
79
|
+
|
|
80
|
+
## Development
|
|
81
|
+
|
|
82
|
+
``` bash
|
|
83
|
+
pip install -e '.[dev]'
|
|
84
|
+
pytest
|
|
85
|
+
```
|
|
86
|
+
|
|
87
|
+
See
|
|
88
|
+
[AGENTS.md](https://github.com/max-models/scope-profiler/blob/devel/AGENTS.md)
|
|
89
|
+
for the measured benchmark workflow used when optimizing this project.
|
|
@@ -5,7 +5,7 @@ requires = [ "setuptools", "wheel" ]
|
|
|
5
5
|
|
|
6
6
|
[project]
|
|
7
7
|
name = "scope-profiler"
|
|
8
|
-
version = "0.3.
|
|
8
|
+
version = "0.3.4"
|
|
9
9
|
description = "Profile code regions in python, optionally with LIKWID markers."
|
|
10
10
|
readme = "README.md"
|
|
11
11
|
keywords = [ "python" ]
|
|
@@ -24,6 +24,8 @@ classifiers = [
|
|
|
24
24
|
dependencies = [
|
|
25
25
|
"h5py",
|
|
26
26
|
"numpy",
|
|
27
|
+
"tabulate",
|
|
28
|
+
"tomli>=2.0; python_version < '3.11'",
|
|
27
29
|
]
|
|
28
30
|
|
|
29
31
|
optional-dependencies.fortran = [
|
|
@@ -33,6 +35,10 @@ optional-dependencies.fortran = [
|
|
|
33
35
|
"ninja",
|
|
34
36
|
]
|
|
35
37
|
|
|
38
|
+
optional-dependencies.compression = [
|
|
39
|
+
"hdf5plugin",
|
|
40
|
+
]
|
|
41
|
+
|
|
36
42
|
optional-dependencies.likwid = [
|
|
37
43
|
"pylikwid",
|
|
38
44
|
]
|
|
@@ -57,16 +63,21 @@ optional-dependencies.pproc = [
|
|
|
57
63
|
"ipykernel",
|
|
58
64
|
"jupyterlab",
|
|
59
65
|
"matplotlib",
|
|
60
|
-
"maxplotlibx >= 0.1.
|
|
66
|
+
"maxplotlibx >= 0.1.8",
|
|
61
67
|
"pandas",
|
|
68
|
+
"plotly",
|
|
62
69
|
"snakeviz",
|
|
63
70
|
"tabulate",
|
|
64
71
|
"textual>=0.86",
|
|
65
72
|
]
|
|
66
73
|
|
|
74
|
+
optional-dependencies.graph = [
|
|
75
|
+
"pyvis >= 0.3.2",
|
|
76
|
+
]
|
|
77
|
+
|
|
67
78
|
optional-dependencies.dev = [
|
|
68
79
|
"black[jupyter]",
|
|
69
|
-
"isort",
|
|
80
|
+
"isort >= 9.0.0",
|
|
70
81
|
"ruff",
|
|
71
82
|
"scope-profiler[docs,fortran,line-profiler,mcp,mpi,nvtx,pproc,test,tui]",
|
|
72
83
|
]
|
|
@@ -3,6 +3,9 @@
|
|
|
3
3
|
from importlib.metadata import PackageNotFoundError, version
|
|
4
4
|
|
|
5
5
|
from scope_profiler.call_stack import (
|
|
6
|
+
CallArrays,
|
|
7
|
+
NestingError,
|
|
8
|
+
build_call_arrays,
|
|
6
9
|
build_call_stack,
|
|
7
10
|
call_stack_children,
|
|
8
11
|
call_stack_roots,
|
|
@@ -30,19 +33,26 @@ _LAZY_ATTRS = {
|
|
|
30
33
|
"plot_flame": "plotting_scripts",
|
|
31
34
|
"plot_gantt": "plotting_scripts",
|
|
32
35
|
"plot_speedup": "plotting_scripts",
|
|
36
|
+
"plot_weak_scaling": "plotting_scripts",
|
|
37
|
+
"plot_rank_heatmap": "plotting_scripts",
|
|
38
|
+
"plot_scaling_efficiency": "plotting_scripts",
|
|
33
39
|
"write_region_statistics_json": "plotting_scripts",
|
|
34
40
|
"export_prof": "prof_export",
|
|
35
41
|
"export_speedscope": "speedscope_export",
|
|
36
42
|
"collect_file_metadata": "inspection",
|
|
37
43
|
"inspect_file": "inspection",
|
|
44
|
+
"create_html_report": "html_report",
|
|
38
45
|
}
|
|
39
46
|
|
|
40
47
|
__all__ = [
|
|
48
|
+
"CallArrays",
|
|
41
49
|
"LikwidRegionResult",
|
|
42
50
|
"MPIRegion",
|
|
51
|
+
"NestingError",
|
|
43
52
|
"ProfileManager",
|
|
44
53
|
"ProfilingResults",
|
|
45
54
|
"Region",
|
|
55
|
+
"build_call_arrays",
|
|
46
56
|
"build_call_stack",
|
|
47
57
|
"call_stack_children",
|
|
48
58
|
"call_stack_roots",
|
|
@@ -18,6 +18,8 @@ Six subcommands:
|
|
|
18
18
|
per-region statistics table (including LIKWID hardware counters, when the
|
|
19
19
|
run recorded any) for merged HDF5 profiling output, without producing any
|
|
20
20
|
plots. See ``scope_profiler.inspection``.
|
|
21
|
+
- ``scope-profiler report file.h5 -o report.html`` -- writes a standalone HTML
|
|
22
|
+
summary with metadata and per-region timing statistics.
|
|
21
23
|
- ``scope-profiler tui file.h5`` -- opens an interactive Textual browser for
|
|
22
24
|
metadata, region statistics, per-rank calls, LIKWID counters and the raw
|
|
23
25
|
HDF5 tree.
|
|
@@ -29,6 +31,10 @@ Six subcommands:
|
|
|
29
31
|
``scope_profiler.diff``.
|
|
30
32
|
- ``scope-profiler check a.h5 b.h5`` -- applies a regression budget and
|
|
31
33
|
returns a CI-friendly exit code.
|
|
34
|
+
- ``scope-profiler benchmark run config.toml`` -- runs a repeatable benchmark
|
|
35
|
+
with a correctness gate and writes a JSON manifest.
|
|
36
|
+
- ``scope-profiler benchmark compare baseline.json candidate.json`` -- makes a
|
|
37
|
+
median-based keep/reject decision for an AI agent or CI.
|
|
32
38
|
- ``scope-profiler import-native traces/ -o out.h5`` -- converts the trace
|
|
33
39
|
files written by the Fortran region API
|
|
34
40
|
(``scope_profiler/fortran/scope_profiler.f90``)
|
|
@@ -52,9 +58,14 @@ def _parse_run_args(argv):
|
|
|
52
58
|
parser.add_argument(
|
|
53
59
|
"-o",
|
|
54
60
|
"--outfile",
|
|
55
|
-
default=
|
|
61
|
+
default=None,
|
|
56
62
|
help="Path to the merged HDF5 output file (default: profiling_data.h5)",
|
|
57
63
|
)
|
|
64
|
+
parser.add_argument(
|
|
65
|
+
"--config",
|
|
66
|
+
metavar="FILE",
|
|
67
|
+
help="TOML file containing profiling settings ([profiling] table)",
|
|
68
|
+
)
|
|
58
69
|
parser.add_argument(
|
|
59
70
|
"-q",
|
|
60
71
|
"--quiet",
|
|
@@ -70,13 +81,14 @@ def _parse_run_args(argv):
|
|
|
70
81
|
parser.add_argument(
|
|
71
82
|
"--line-profile",
|
|
72
83
|
action="store_true",
|
|
84
|
+
default=None,
|
|
73
85
|
help="Also collect line-by-line timings via line_profiler "
|
|
74
86
|
"(requires scope-profiler[line-profiler])",
|
|
75
87
|
)
|
|
76
88
|
parser.add_argument(
|
|
77
89
|
"--buffer-limit",
|
|
78
90
|
type=int,
|
|
79
|
-
default=
|
|
91
|
+
default=None,
|
|
80
92
|
help="Initial buffer capacity per region; grows as needed (default: 1024)",
|
|
81
93
|
)
|
|
82
94
|
parser.add_argument("script", help="Script to run and profile")
|
|
@@ -100,11 +112,14 @@ def _run(argv):
|
|
|
100
112
|
raise SystemExit(1)
|
|
101
113
|
|
|
102
114
|
ProfileManager.setup(
|
|
103
|
-
|
|
104
|
-
|
|
115
|
+
# ``run`` historically enables recursive profiling. A TOML file may
|
|
116
|
+
# override it, while the no-config path keeps that default.
|
|
117
|
+
recursive_profile=True if args.config is None else None,
|
|
118
|
+
use_likwid=None,
|
|
105
119
|
use_line_profiler=args.line_profile,
|
|
106
120
|
buffer_limit=args.buffer_limit,
|
|
107
121
|
file_path=args.outfile,
|
|
122
|
+
config_path=args.config,
|
|
108
123
|
)
|
|
109
124
|
|
|
110
125
|
try:
|
|
@@ -138,6 +153,62 @@ def _inspect(argv):
|
|
|
138
153
|
return inspect_main(argv)
|
|
139
154
|
|
|
140
155
|
|
|
156
|
+
def _report(argv):
|
|
157
|
+
"""Handle ``scope-profiler report``: write a standalone HTML summary."""
|
|
158
|
+
from scope_profiler.html_report import create_html_report
|
|
159
|
+
from scope_profiler.post_processing import expand_file_patterns, parse_ranks
|
|
160
|
+
from scope_profiler.summary import REGION_TABLE_COLUMNS, SORT_KEYS
|
|
161
|
+
|
|
162
|
+
parser = argparse.ArgumentParser(
|
|
163
|
+
prog="scope-profiler report",
|
|
164
|
+
description="Write a standalone HTML report from profiling HDF5 files.",
|
|
165
|
+
)
|
|
166
|
+
parser.add_argument(
|
|
167
|
+
"files", nargs="+", help="Profiling HDF5 files or glob patterns"
|
|
168
|
+
)
|
|
169
|
+
parser.add_argument(
|
|
170
|
+
"-o", "--output", required=True, metavar="PATH", help="HTML file to write"
|
|
171
|
+
)
|
|
172
|
+
parser.add_argument(
|
|
173
|
+
"--include", nargs="+", help="Only include matching region names"
|
|
174
|
+
)
|
|
175
|
+
parser.add_argument("--exclude", nargs="+", help="Exclude matching region names")
|
|
176
|
+
parser.add_argument("--ranks", nargs="+", help="Ranks to include, e.g. 0 2 or 0-3")
|
|
177
|
+
parser.add_argument(
|
|
178
|
+
"--sort",
|
|
179
|
+
choices=SORT_KEYS,
|
|
180
|
+
default="total",
|
|
181
|
+
help="Region ordering (default: total)",
|
|
182
|
+
)
|
|
183
|
+
parser.add_argument(
|
|
184
|
+
"--columns",
|
|
185
|
+
nargs="+",
|
|
186
|
+
choices=REGION_TABLE_COLUMNS,
|
|
187
|
+
help="Region table columns",
|
|
188
|
+
)
|
|
189
|
+
parser.add_argument(
|
|
190
|
+
"--no-charts",
|
|
191
|
+
action="store_true",
|
|
192
|
+
help="Omit embedded interactive charts",
|
|
193
|
+
)
|
|
194
|
+
args = parser.parse_args(argv)
|
|
195
|
+
ranks = None
|
|
196
|
+
if args.ranks:
|
|
197
|
+
ranks = sorted({rank for spec in args.ranks for rank in parse_ranks(spec)})
|
|
198
|
+
output = create_html_report(
|
|
199
|
+
expand_file_patterns(args.files, parser),
|
|
200
|
+
args.output,
|
|
201
|
+
include=args.include,
|
|
202
|
+
exclude=args.exclude,
|
|
203
|
+
ranks=ranks,
|
|
204
|
+
sort=args.sort,
|
|
205
|
+
columns=args.columns,
|
|
206
|
+
include_charts=not args.no_charts,
|
|
207
|
+
)
|
|
208
|
+
print(f"Report written to: {output}")
|
|
209
|
+
return 0
|
|
210
|
+
|
|
211
|
+
|
|
141
212
|
def _tui(argv):
|
|
142
213
|
"""Handle ``scope-profiler tui``: open the interactive HDF5 browser."""
|
|
143
214
|
from scope_profiler.tui import main as tui_main
|
|
@@ -166,6 +237,48 @@ def _check(argv):
|
|
|
166
237
|
return check_main(argv)
|
|
167
238
|
|
|
168
239
|
|
|
240
|
+
def _benchmark(argv):
|
|
241
|
+
"""Run or compare declarative, repeated benchmark manifests."""
|
|
242
|
+
from scope_profiler.benchmark import (
|
|
243
|
+
BenchmarkError,
|
|
244
|
+
compare_benchmarks,
|
|
245
|
+
load_config,
|
|
246
|
+
run_benchmark,
|
|
247
|
+
)
|
|
248
|
+
|
|
249
|
+
parser = argparse.ArgumentParser(
|
|
250
|
+
prog="scope-profiler benchmark",
|
|
251
|
+
description="Run or compare repeatable AI/CI benchmark workflows.",
|
|
252
|
+
)
|
|
253
|
+
subparsers = parser.add_subparsers(dest="action", required=True)
|
|
254
|
+
run_parser = subparsers.add_parser("run", help="run a benchmark config")
|
|
255
|
+
run_parser.add_argument("config", help="benchmark TOML configuration")
|
|
256
|
+
run_parser.add_argument(
|
|
257
|
+
"--label", default="candidate", help="baseline or candidate label"
|
|
258
|
+
)
|
|
259
|
+
run_parser.add_argument("--json", action="store_true", help="print only JSON")
|
|
260
|
+
compare_parser = subparsers.add_parser(
|
|
261
|
+
"compare", help="compare two benchmark manifests"
|
|
262
|
+
)
|
|
263
|
+
compare_parser.add_argument("baseline")
|
|
264
|
+
compare_parser.add_argument("candidate")
|
|
265
|
+
compare_parser.add_argument("--json", action="store_true", help="print only JSON")
|
|
266
|
+
args = parser.parse_args(argv)
|
|
267
|
+
try:
|
|
268
|
+
if args.action == "run":
|
|
269
|
+
result = run_benchmark(load_config(args.config), label=args.label)
|
|
270
|
+
exit_code = 0 if result["correctness"]["passed"] else 1
|
|
271
|
+
else:
|
|
272
|
+
result = compare_benchmarks(args.baseline, args.candidate)
|
|
273
|
+
exit_code = 0 if result["decision"] == "keep" else 1
|
|
274
|
+
except BenchmarkError as exc:
|
|
275
|
+
parser.error(str(exc))
|
|
276
|
+
print(__import__("json").dumps(result, indent=None if args.json else 2))
|
|
277
|
+
if exit_code:
|
|
278
|
+
raise SystemExit(exit_code)
|
|
279
|
+
return 0
|
|
280
|
+
|
|
281
|
+
|
|
169
282
|
def _import_fortran(argv):
|
|
170
283
|
"""Handle ``scope-profiler import-native``: Fortran traces -> HDF5."""
|
|
171
284
|
from scope_profiler.native_trace import TRACE_SUFFIX, convert_traces
|
|
@@ -238,10 +351,12 @@ _COMMANDS = {
|
|
|
238
351
|
"plot": _plot,
|
|
239
352
|
"export": _export,
|
|
240
353
|
"inspect": _inspect,
|
|
354
|
+
"report": _report,
|
|
241
355
|
"tui": _tui,
|
|
242
356
|
"line-profile": _line_profile,
|
|
243
357
|
"diff": _diff,
|
|
244
358
|
"check": _check,
|
|
359
|
+
"benchmark": _benchmark,
|
|
245
360
|
"import-native": _import_fortran,
|
|
246
361
|
}
|
|
247
362
|
|
|
@@ -283,6 +398,11 @@ def main(argv=None):
|
|
|
283
398
|
help="Print metadata and region statistics of HDF5 profiling data "
|
|
284
399
|
"(see `scope-profiler inspect --help`)",
|
|
285
400
|
)
|
|
401
|
+
subparsers.add_parser(
|
|
402
|
+
"report",
|
|
403
|
+
add_help=False,
|
|
404
|
+
help="Write a standalone HTML report (see `scope-profiler report --help`)",
|
|
405
|
+
)
|
|
286
406
|
subparsers.add_parser(
|
|
287
407
|
"tui",
|
|
288
408
|
add_help=False,
|
|
@@ -306,6 +426,11 @@ def main(argv=None):
|
|
|
306
426
|
add_help=False,
|
|
307
427
|
help="Fail on profiling regressions (see `scope-profiler check --help`)",
|
|
308
428
|
)
|
|
429
|
+
subparsers.add_parser(
|
|
430
|
+
"benchmark",
|
|
431
|
+
add_help=False,
|
|
432
|
+
help="Run or compare repeatable benchmarks (see `scope-profiler benchmark --help`)",
|
|
433
|
+
)
|
|
309
434
|
subparsers.add_parser(
|
|
310
435
|
"import-native",
|
|
311
436
|
add_help=False,
|
|
@@ -331,4 +456,4 @@ def main(argv=None):
|
|
|
331
456
|
|
|
332
457
|
|
|
333
458
|
if __name__ == "__main__":
|
|
334
|
-
main()
|
|
459
|
+
raise SystemExit(main())
|