scope-profiler 0.3.2__tar.gz → 0.3.3__tar.gz
This diff represents the content of publicly available package versions that have been released to one of the supported registries. The information contained in this diff is provided for informational purposes only and reflects changes between package versions as they appear in their respective public registries.
- scope_profiler-0.3.3/PKG-INFO +151 -0
- scope_profiler-0.3.3/README.md +88 -0
- {scope_profiler-0.3.2 → scope_profiler-0.3.3}/pyproject.toml +3 -1
- {scope_profiler-0.3.2 → scope_profiler-0.3.3}/src/scope_profiler/__main__.py +65 -4
- scope_profiler-0.3.3/src/scope_profiler/benchmark.py +234 -0
- {scope_profiler-0.3.2 → scope_profiler-0.3.3}/src/scope_profiler/diff.py +10 -18
- scope_profiler-0.3.3/src/scope_profiler/gpu_timing.py +122 -0
- {scope_profiler-0.3.2 → scope_profiler-0.3.3}/src/scope_profiler/h5reader.py +5 -0
- {scope_profiler-0.3.2 → scope_profiler-0.3.3}/src/scope_profiler/h5writer.py +8 -2
- {scope_profiler-0.3.2 → scope_profiler-0.3.3}/src/scope_profiler/line_profile_cli.py +19 -8
- {scope_profiler-0.3.2 → scope_profiler-0.3.3}/src/scope_profiler/mcp_server/server.py +20 -4
- {scope_profiler-0.3.2 → scope_profiler-0.3.3}/src/scope_profiler/mcp_server/tools.py +25 -0
- {scope_profiler-0.3.2 → scope_profiler-0.3.3}/src/scope_profiler/mpi_region.py +42 -1
- {scope_profiler-0.3.2 → scope_profiler-0.3.3}/src/scope_profiler/profile_config.py +68 -0
- {scope_profiler-0.3.2 → scope_profiler-0.3.3}/src/scope_profiler/profile_manager.py +85 -27
- {scope_profiler-0.3.2 → scope_profiler-0.3.3}/src/scope_profiler/region.py +48 -5
- {scope_profiler-0.3.2 → scope_profiler-0.3.3}/src/scope_profiler/region_profiler.py +116 -0
- {scope_profiler-0.3.2 → scope_profiler-0.3.3}/src/scope_profiler/results.py +9 -4
- {scope_profiler-0.3.2 → scope_profiler-0.3.3}/src/scope_profiler/summary.py +49 -67
- {scope_profiler-0.3.2 → scope_profiler-0.3.3}/src/scope_profiler/tests/test_app.py +58 -0
- scope_profiler-0.3.3/src/scope_profiler/tests/test_benchmark.py +75 -0
- {scope_profiler-0.3.2 → scope_profiler-0.3.3}/src/scope_profiler/tests/test_diff.py +1 -1
- {scope_profiler-0.3.2 → scope_profiler-0.3.3}/src/scope_profiler/tests/test_inspection.py +7 -6
- {scope_profiler-0.3.2 → scope_profiler-0.3.3}/src/scope_profiler/tests/test_line_profile_cli.py +3 -2
- {scope_profiler-0.3.2 → scope_profiler-0.3.3}/src/scope_profiler/tests/test_main_cli.py +30 -0
- {scope_profiler-0.3.2 → scope_profiler-0.3.3}/src/scope_profiler/tests/test_mcp_server.py +9 -2
- scope_profiler-0.3.3/src/scope_profiler/tests/test_profile_config_toml.py +43 -0
- {scope_profiler-0.3.2 → scope_profiler-0.3.3}/src/scope_profiler/tests/test_results_api.py +1 -1
- {scope_profiler-0.3.2 → scope_profiler-0.3.3}/src/scope_profiler/tests/test_tui.py +83 -2
- {scope_profiler-0.3.2 → scope_profiler-0.3.3}/src/scope_profiler/tests/unit/test_h5writer.py +17 -5
- scope_profiler-0.3.3/src/scope_profiler/tui.py +1217 -0
- scope_profiler-0.3.3/src/scope_profiler.egg-info/PKG-INFO +151 -0
- {scope_profiler-0.3.2 → scope_profiler-0.3.3}/src/scope_profiler.egg-info/SOURCES.txt +4 -0
- {scope_profiler-0.3.2 → scope_profiler-0.3.3}/src/scope_profiler.egg-info/requires.txt +4 -0
- scope_profiler-0.3.2/PKG-INFO +0 -606
- scope_profiler-0.3.2/README.md +0 -545
- scope_profiler-0.3.2/src/scope_profiler/tui.py +0 -650
- scope_profiler-0.3.2/src/scope_profiler.egg-info/PKG-INFO +0 -606
- {scope_profiler-0.3.2 → scope_profiler-0.3.3}/setup.cfg +0 -0
- {scope_profiler-0.3.2 → scope_profiler-0.3.3}/src/scope_profiler/__init__.py +0 -0
- {scope_profiler-0.3.2 → scope_profiler-0.3.3}/src/scope_profiler/c/Makefile +0 -0
- {scope_profiler-0.3.2 → scope_profiler-0.3.3}/src/scope_profiler/c/example.c +0 -0
- {scope_profiler-0.3.2 → scope_profiler-0.3.3}/src/scope_profiler/c/scope_profiler.c +0 -0
- {scope_profiler-0.3.2 → scope_profiler-0.3.3}/src/scope_profiler/c/scope_profiler.h +0 -0
- {scope_profiler-0.3.2 → scope_profiler-0.3.3}/src/scope_profiler/call_stack.py +0 -0
- {scope_profiler-0.3.2 → scope_profiler-0.3.3}/src/scope_profiler/fortran/Makefile +0 -0
- {scope_profiler-0.3.2 → scope_profiler-0.3.3}/src/scope_profiler/fortran/example.f90 +0 -0
- {scope_profiler-0.3.2 → scope_profiler-0.3.3}/src/scope_profiler/fortran/scope_profiler.f90 +0 -0
- {scope_profiler-0.3.2 → scope_profiler-0.3.3}/src/scope_profiler/inspection.py +0 -0
- {scope_profiler-0.3.2 → scope_profiler-0.3.3}/src/scope_profiler/likwid_data.py +0 -0
- {scope_profiler-0.3.2 → scope_profiler-0.3.3}/src/scope_profiler/mcp_server/__init__.py +0 -0
- {scope_profiler-0.3.2 → scope_profiler-0.3.3}/src/scope_profiler/mcp_server/__main__.py +0 -0
- {scope_profiler-0.3.2 → scope_profiler-0.3.3}/src/scope_profiler/metadata.py +0 -0
- {scope_profiler-0.3.2 → scope_profiler-0.3.3}/src/scope_profiler/mpi_launch.py +0 -0
- {scope_profiler-0.3.2 → scope_profiler-0.3.3}/src/scope_profiler/native_trace.py +0 -0
- {scope_profiler-0.3.2 → scope_profiler-0.3.3}/src/scope_profiler/plotting_scripts.py +0 -0
- {scope_profiler-0.3.2 → scope_profiler-0.3.3}/src/scope_profiler/post_processing.py +0 -0
- {scope_profiler-0.3.2 → scope_profiler-0.3.3}/src/scope_profiler/prof_export.py +0 -0
- {scope_profiler-0.3.2 → scope_profiler-0.3.3}/src/scope_profiler/speedscope_export.py +0 -0
- {scope_profiler-0.3.2 → scope_profiler-0.3.3}/src/scope_profiler/tests/__init__.py +0 -0
- {scope_profiler-0.3.2 → scope_profiler-0.3.3}/src/scope_profiler/tests/check_mpi_launch.py +0 -0
- {scope_profiler-0.3.2 → scope_profiler-0.3.3}/src/scope_profiler/tests/examples.py +0 -0
- {scope_profiler-0.3.2 → scope_profiler-0.3.3}/src/scope_profiler/tests/examples_pylikwid.py +0 -0
- {scope_profiler-0.3.2 → scope_profiler-0.3.3}/src/scope_profiler/tests/pylikwid_readme.py +0 -0
- {scope_profiler-0.3.2 → scope_profiler-0.3.3}/src/scope_profiler/tests/test_buffer_growth.py +0 -0
- {scope_profiler-0.3.2 → scope_profiler-0.3.3}/src/scope_profiler/tests/test_c_api.py +0 -0
- {scope_profiler-0.3.2 → scope_profiler-0.3.3}/src/scope_profiler/tests/test_fortran_api.py +0 -0
- {scope_profiler-0.3.2 → scope_profiler-0.3.3}/src/scope_profiler/tests/test_in_memory_results.py +0 -0
- {scope_profiler-0.3.2 → scope_profiler-0.3.3}/src/scope_profiler/tests/test_label.py +0 -0
- {scope_profiler-0.3.2 → scope_profiler-0.3.3}/src/scope_profiler/tests/test_likwid_data.py +0 -0
- {scope_profiler-0.3.2 → scope_profiler-0.3.3}/src/scope_profiler/tests/test_mcp_tools.py +0 -0
- {scope_profiler-0.3.2 → scope_profiler-0.3.3}/src/scope_profiler/tests/test_metadata.py +0 -0
- {scope_profiler-0.3.2 → scope_profiler-0.3.3}/src/scope_profiler/tests/test_mixed_language.py +0 -0
- {scope_profiler-0.3.2 → scope_profiler-0.3.3}/src/scope_profiler/tests/test_mpi.py +0 -0
- {scope_profiler-0.3.2 → scope_profiler-0.3.3}/src/scope_profiler/tests/test_overhead.py +0 -0
- {scope_profiler-0.3.2 → scope_profiler-0.3.3}/src/scope_profiler/tests/test_post_processing.py +0 -0
- {scope_profiler-0.3.2 → scope_profiler-0.3.3}/src/scope_profiler/tests/test_prof_export.py +0 -0
- {scope_profiler-0.3.2 → scope_profiler-0.3.3}/src/scope_profiler/tests/test_readme.py +0 -0
- {scope_profiler-0.3.2 → scope_profiler-0.3.3}/src/scope_profiler/tests/test_region_source.py +0 -0
- {scope_profiler-0.3.2 → scope_profiler-0.3.3}/src/scope_profiler/tests/test_repeated_finalize.py +0 -0
- {scope_profiler-0.3.2 → scope_profiler-0.3.3}/src/scope_profiler/tests/test_speedscope_export.py +0 -0
- {scope_profiler-0.3.2 → scope_profiler-0.3.3}/src/scope_profiler/tests/test_summary_likwid.py +0 -0
- {scope_profiler-0.3.2 → scope_profiler-0.3.3}/src/scope_profiler/tests/unit/__init__.py +0 -0
- {scope_profiler-0.3.2 → scope_profiler-0.3.3}/src/scope_profiler/tests/unit/test_lazy_config.py +0 -0
- {scope_profiler-0.3.2 → scope_profiler-0.3.3}/src/scope_profiler/tests/unit/test_likwid_child_env.py +0 -0
- {scope_profiler-0.3.2 → scope_profiler-0.3.3}/src/scope_profiler/tests/unit/test_merge_results.py +0 -0
- {scope_profiler-0.3.2 → scope_profiler-0.3.3}/src/scope_profiler/tests/unit/test_mpi_launch.py +0 -0
- {scope_profiler-0.3.2 → scope_profiler-0.3.3}/src/scope_profiler/tests/unit/test_payload_collection.py +0 -0
- {scope_profiler-0.3.2 → scope_profiler-0.3.3}/src/scope_profiler.egg-info/dependency_links.txt +0 -0
- {scope_profiler-0.3.2 → scope_profiler-0.3.3}/src/scope_profiler.egg-info/entry_points.txt +0 -0
- {scope_profiler-0.3.2 → scope_profiler-0.3.3}/src/scope_profiler.egg-info/top_level.txt +0 -0
|
@@ -0,0 +1,151 @@
|
|
|
1
|
+
Metadata-Version: 2.4
|
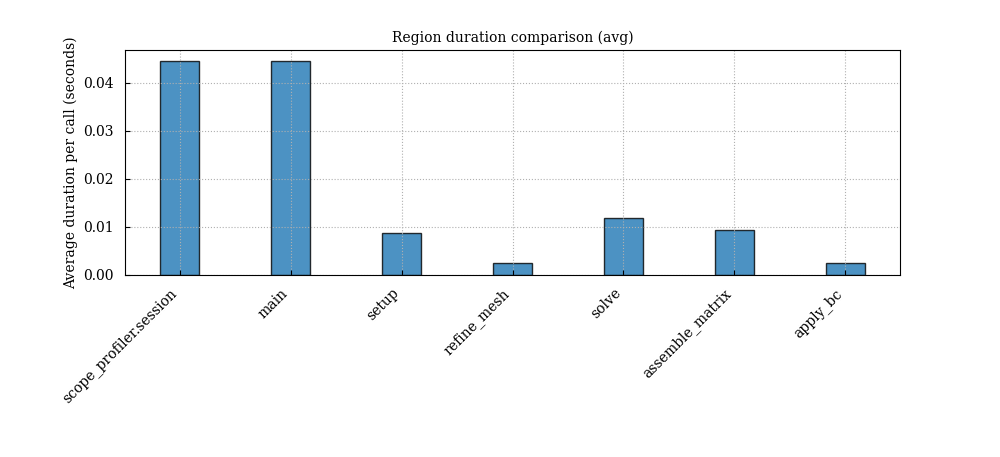
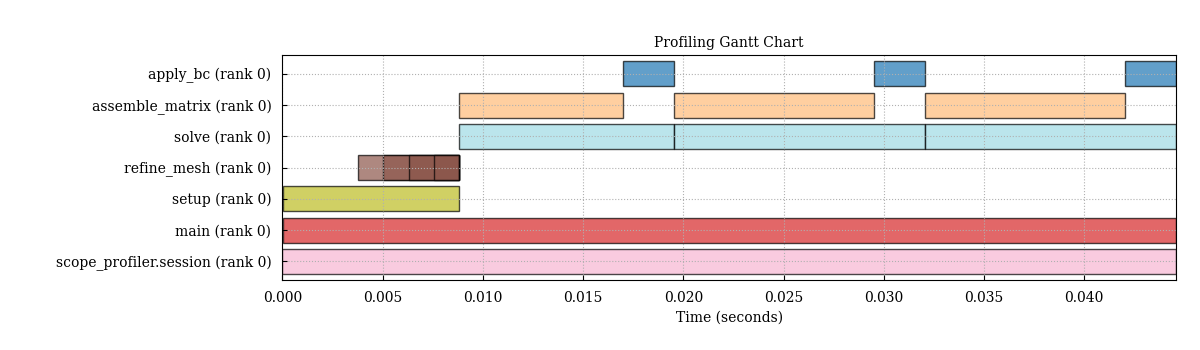
|
2
|
+
Name: scope-profiler
|
|
3
|
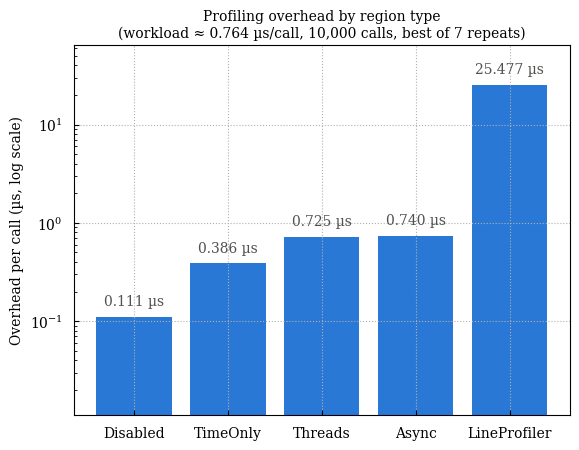
+
Version: 0.3.3
|
|
4
|
+
Summary: Profile code regions in python, optionally with LIKWID markers.
|
|
5
|
+
Author: Max
|
|
6
|
+
Project-URL: Source, https://github.com/max-models/scope-profiler
|
|
7
|
+
Keywords: python
|
|
8
|
+
Classifier: Development Status :: 3 - Alpha
|
|
9
|
+
Classifier: Programming Language :: Python :: 3 :: Only
|
|
10
|
+
Classifier: Programming Language :: Python :: 3.10
|
|
11
|
+
Classifier: Programming Language :: Python :: 3.11
|
|
12
|
+
Classifier: Programming Language :: Python :: 3.12
|
|
13
|
+
Classifier: Programming Language :: Python :: 3.13
|
|
14
|
+
Classifier: Programming Language :: Python :: 3.14
|
|
15
|
+
Requires-Python: >=3.10
|
|
16
|
+
Description-Content-Type: text/markdown
|
|
17
|
+
Requires-Dist: h5py
|
|
18
|
+
Requires-Dist: numpy
|
|
19
|
+
Requires-Dist: tabulate
|
|
20
|
+
Requires-Dist: tomli>=2.0; python_version < "3.11"
|
|
21
|
+
Provides-Extra: fortran
|
|
22
|
+
Requires-Dist: meson; extra == "fortran"
|
|
23
|
+
Requires-Dist: ninja; extra == "fortran"
|
|
24
|
+
Provides-Extra: likwid
|
|
25
|
+
Requires-Dist: pylikwid; extra == "likwid"
|
|
26
|
+
Provides-Extra: line-profiler
|
|
27
|
+
Requires-Dist: line-profiler; extra == "line-profiler"
|
|
28
|
+
Provides-Extra: nvtx
|
|
29
|
+
Requires-Dist: nvtx; extra == "nvtx"
|
|
30
|
+
Provides-Extra: mcp
|
|
31
|
+
Requires-Dist: mcp<2.0.0,>=1.6.0; extra == "mcp"
|
|
32
|
+
Provides-Extra: mpi
|
|
33
|
+
Requires-Dist: mpi4py; extra == "mpi"
|
|
34
|
+
Provides-Extra: pproc
|
|
35
|
+
Requires-Dist: ipykernel; extra == "pproc"
|
|
36
|
+
Requires-Dist: jupyterlab; extra == "pproc"
|
|
37
|
+
Requires-Dist: matplotlib; extra == "pproc"
|
|
38
|
+
Requires-Dist: maxplotlibx>=0.1.6; extra == "pproc"
|
|
39
|
+
Requires-Dist: pandas; extra == "pproc"
|
|
40
|
+
Requires-Dist: snakeviz; extra == "pproc"
|
|
41
|
+
Requires-Dist: tabulate; extra == "pproc"
|
|
42
|
+
Requires-Dist: textual>=0.86; extra == "pproc"
|
|
43
|
+
Provides-Extra: dev
|
|
44
|
+
Requires-Dist: black[jupyter]; extra == "dev"
|
|
45
|
+
Requires-Dist: isort; extra == "dev"
|
|
46
|
+
Requires-Dist: ruff; extra == "dev"
|
|
47
|
+
Requires-Dist: scope-profiler[docs,fortran,line-profiler,mcp,mpi,nvtx,pproc,test,tui]; extra == "dev"
|
|
48
|
+
Provides-Extra: docs
|
|
49
|
+
Requires-Dist: myst-parser; extra == "docs"
|
|
50
|
+
Requires-Dist: nbconvert; extra == "docs"
|
|
51
|
+
Requires-Dist: nbsphinx; extra == "docs"
|
|
52
|
+
Requires-Dist: pre-commit; extra == "docs"
|
|
53
|
+
Requires-Dist: pyproject-fmt; extra == "docs"
|
|
54
|
+
Requires-Dist: sphinx; extra == "docs"
|
|
55
|
+
Requires-Dist: sphinx-book-theme; extra == "docs"
|
|
56
|
+
Requires-Dist: scope-profiler[line-profiler,pproc,tui]; extra == "docs"
|
|
57
|
+
Provides-Extra: test
|
|
58
|
+
Requires-Dist: coverage; extra == "test"
|
|
59
|
+
Requires-Dist: pytest; extra == "test"
|
|
60
|
+
Provides-Extra: tui
|
|
61
|
+
Requires-Dist: tabulate; extra == "tui"
|
|
62
|
+
Requires-Dist: textual>=0.86; extra == "tui"
|
|
63
|
+
|
|
64
|
+
|
|
65
|
+
|
|
66
|
+
<!-- Generated README.md is rendered from this file by docs/render_markdown.py. -->
|
|
67
|
+
|
|
68
|
+
# scope-profiler
|
|
69
|
+
|
|
70
|
+
Profile Python code regions—and optionally C, Fortran, MPI, NVTX, and
|
|
71
|
+
[LIKWID](https://github.com/RRZE-HPC/likwid)—with one consistent API and
|
|
72
|
+
HDF5 output format.
|
|
73
|
+
|
|
74
|
+
``` bash
|
|
75
|
+
pip install scope-profiler
|
|
76
|
+
```
|
|
77
|
+
|
|
78
|
+
## Quick start
|
|
79
|
+
|
|
80
|
+
``` python
|
|
81
|
+
from scope_profiler import ProfileManager
|
|
82
|
+
|
|
83
|
+
with ProfileManager.session():
|
|
84
|
+
@ProfileManager.profile("main")
|
|
85
|
+
def main():
|
|
86
|
+
with ProfileManager.profile_region("work"):
|
|
87
|
+
sum(range(100)) # replace with the code you want to measure
|
|
88
|
+
|
|
89
|
+
main()
|
|
90
|
+
# writes profiling_data.h5 and prints a summary
|
|
91
|
+
```
|
|
92
|
+
|
|
93
|
+
You can also profile a script without changing its source:
|
|
94
|
+
|
|
95
|
+
``` bash
|
|
96
|
+
scope-profiler run my_script.py
|
|
97
|
+
scope-profiler inspect profiling_data.h5
|
|
98
|
+
scope-profiler plot default profiling_data.h5 -o figures
|
|
99
|
+
```
|
|
100
|
+
|
|
101
|
+
## Example output
|
|
102
|
+
|
|
103
|
+
The plotting tools include duration summaries and timelines for finding
|
|
104
|
+
expensive regions:
|
|
105
|
+
|
|
106
|
+
|
|
108
|
+
|
|
109
|
+
|
|
111
|
+
|
|
112
|
+
The overhead benchmark measures the cost of each instrumentation mode:
|
|
113
|
+
|
|
114
|
+
``` bash
|
|
115
|
+
python examples/benchmark_overhead.py
|
|
116
|
+
```
|
|
117
|
+
|
|
118
|
+
|
|
120
|
+
|
|
121
|
+
## Documentation
|
|
122
|
+
|
|
123
|
+
- [Installation](https://max-models.github.io/scope-profiler/installation.html)
|
|
124
|
+
- [Quick
|
|
125
|
+
start](https://max-models.github.io/scope-profiler/quickstart.html)
|
|
126
|
+
- [Python API and
|
|
127
|
+
post-processing](https://max-models.github.io/scope-profiler/guide/hdf5_and_python_api.html)
|
|
128
|
+
- [CLI reference](https://max-models.github.io/scope-profiler/cli.html)
|
|
129
|
+
- [Configuration and profiling
|
|
130
|
+
regions](https://max-models.github.io/scope-profiler/guide/configuration.html)
|
|
131
|
+
- [MPI](https://max-models.github.io/scope-profiler/guide/mpi.html),
|
|
132
|
+
[C](https://max-models.github.io/scope-profiler/guide/c.html), and
|
|
133
|
+
[Fortran](https://max-models.github.io/scope-profiler/guide/fortran.html)
|
|
134
|
+
- [LIKWID](https://max-models.github.io/scope-profiler/guide/likwid.html),
|
|
135
|
+
[line
|
|
136
|
+
profiling](https://max-models.github.io/scope-profiler/guide/line_profiler.html),
|
|
137
|
+
and [MCP](https://max-models.github.io/scope-profiler/guide/mcp.html)
|
|
138
|
+
- [Tutorial
|
|
139
|
+
notebooks](https://max-models.github.io/scope-profiler/tutorials.html)
|
|
140
|
+
- [Examples](https://github.com/max-models/scope-profiler/tree/devel/examples)
|
|
141
|
+
|
|
142
|
+
## Development
|
|
143
|
+
|
|
144
|
+
``` bash
|
|
145
|
+
pip install -e '.[dev]'
|
|
146
|
+
pytest
|
|
147
|
+
```
|
|
148
|
+
|
|
149
|
+
See
|
|
150
|
+
[AGENTS.md](https://github.com/max-models/scope-profiler/blob/devel/AGENTS.md)
|
|
151
|
+
for the measured benchmark workflow used when optimizing this project.
|
|
@@ -0,0 +1,88 @@
|
|
|
1
|
+
|
|
2
|
+
|
|
3
|
+
<!-- Generated README.md is rendered from this file by docs/render_markdown.py. -->
|
|
4
|
+
|
|
5
|
+
# scope-profiler
|
|
6
|
+
|
|
7
|
+
Profile Python code regions—and optionally C, Fortran, MPI, NVTX, and
|
|
8
|
+
[LIKWID](https://github.com/RRZE-HPC/likwid)—with one consistent API and
|
|
9
|
+
HDF5 output format.
|
|
10
|
+
|
|
11
|
+
``` bash
|
|
12
|
+
pip install scope-profiler
|
|
13
|
+
```
|
|
14
|
+
|
|
15
|
+
## Quick start
|
|
16
|
+
|
|
17
|
+
``` python
|
|
18
|
+
from scope_profiler import ProfileManager
|
|
19
|
+
|
|
20
|
+
with ProfileManager.session():
|
|
21
|
+
@ProfileManager.profile("main")
|
|
22
|
+
def main():
|
|
23
|
+
with ProfileManager.profile_region("work"):
|
|
24
|
+
sum(range(100)) # replace with the code you want to measure
|
|
25
|
+
|
|
26
|
+
main()
|
|
27
|
+
# writes profiling_data.h5 and prints a summary
|
|
28
|
+
```
|
|
29
|
+
|
|
30
|
+
You can also profile a script without changing its source:
|
|
31
|
+
|
|
32
|
+
``` bash
|
|
33
|
+
scope-profiler run my_script.py
|
|
34
|
+
scope-profiler inspect profiling_data.h5
|
|
35
|
+
scope-profiler plot default profiling_data.h5 -o figures
|
|
36
|
+
```
|
|
37
|
+
|
|
38
|
+
## Example output
|
|
39
|
+
|
|
40
|
+
The plotting tools include duration summaries and timelines for finding
|
|
41
|
+
expensive regions:
|
|
42
|
+
|
|
43
|
+

|
|
45
|
+
|
|
46
|
+

|
|
48
|
+
|
|
49
|
+
The overhead benchmark measures the cost of each instrumentation mode:
|
|
50
|
+
|
|
51
|
+
``` bash
|
|
52
|
+
python examples/benchmark_overhead.py
|
|
53
|
+
```
|
|
54
|
+
|
|
55
|
+

|
|
57
|
+
|
|
58
|
+
## Documentation
|
|
59
|
+
|
|
60
|
+
- [Installation](https://max-models.github.io/scope-profiler/installation.html)
|
|
61
|
+
- [Quick
|
|
62
|
+
start](https://max-models.github.io/scope-profiler/quickstart.html)
|
|
63
|
+
- [Python API and
|
|
64
|
+
post-processing](https://max-models.github.io/scope-profiler/guide/hdf5_and_python_api.html)
|
|
65
|
+
- [CLI reference](https://max-models.github.io/scope-profiler/cli.html)
|
|
66
|
+
- [Configuration and profiling
|
|
67
|
+
regions](https://max-models.github.io/scope-profiler/guide/configuration.html)
|
|
68
|
+
- [MPI](https://max-models.github.io/scope-profiler/guide/mpi.html),
|
|
69
|
+
[C](https://max-models.github.io/scope-profiler/guide/c.html), and
|
|
70
|
+
[Fortran](https://max-models.github.io/scope-profiler/guide/fortran.html)
|
|
71
|
+
- [LIKWID](https://max-models.github.io/scope-profiler/guide/likwid.html),
|
|
72
|
+
[line
|
|
73
|
+
profiling](https://max-models.github.io/scope-profiler/guide/line_profiler.html),
|
|
74
|
+
and [MCP](https://max-models.github.io/scope-profiler/guide/mcp.html)
|
|
75
|
+
- [Tutorial
|
|
76
|
+
notebooks](https://max-models.github.io/scope-profiler/tutorials.html)
|
|
77
|
+
- [Examples](https://github.com/max-models/scope-profiler/tree/devel/examples)
|
|
78
|
+
|
|
79
|
+
## Development
|
|
80
|
+
|
|
81
|
+
``` bash
|
|
82
|
+
pip install -e '.[dev]'
|
|
83
|
+
pytest
|
|
84
|
+
```
|
|
85
|
+
|
|
86
|
+
See
|
|
87
|
+
[AGENTS.md](https://github.com/max-models/scope-profiler/blob/devel/AGENTS.md)
|
|
88
|
+
for the measured benchmark workflow used when optimizing this project.
|
|
@@ -5,7 +5,7 @@ requires = [ "setuptools", "wheel" ]
|
|
|
5
5
|
|
|
6
6
|
[project]
|
|
7
7
|
name = "scope-profiler"
|
|
8
|
-
version = "0.3.
|
|
8
|
+
version = "0.3.3"
|
|
9
9
|
description = "Profile code regions in python, optionally with LIKWID markers."
|
|
10
10
|
readme = "README.md"
|
|
11
11
|
keywords = [ "python" ]
|
|
@@ -24,6 +24,8 @@ classifiers = [
|
|
|
24
24
|
dependencies = [
|
|
25
25
|
"h5py",
|
|
26
26
|
"numpy",
|
|
27
|
+
"tabulate",
|
|
28
|
+
"tomli>=2.0; python_version < '3.11'",
|
|
27
29
|
]
|
|
28
30
|
|
|
29
31
|
optional-dependencies.fortran = [
|
|
@@ -29,6 +29,10 @@ Six subcommands:
|
|
|
29
29
|
``scope_profiler.diff``.
|
|
30
30
|
- ``scope-profiler check a.h5 b.h5`` -- applies a regression budget and
|
|
31
31
|
returns a CI-friendly exit code.
|
|
32
|
+
- ``scope-profiler benchmark run config.toml`` -- runs a repeatable benchmark
|
|
33
|
+
with a correctness gate and writes a JSON manifest.
|
|
34
|
+
- ``scope-profiler benchmark compare baseline.json candidate.json`` -- makes a
|
|
35
|
+
median-based keep/reject decision for an AI agent or CI.
|
|
32
36
|
- ``scope-profiler import-native traces/ -o out.h5`` -- converts the trace
|
|
33
37
|
files written by the Fortran region API
|
|
34
38
|
(``scope_profiler/fortran/scope_profiler.f90``)
|
|
@@ -52,9 +56,14 @@ def _parse_run_args(argv):
|
|
|
52
56
|
parser.add_argument(
|
|
53
57
|
"-o",
|
|
54
58
|
"--outfile",
|
|
55
|
-
default=
|
|
59
|
+
default=None,
|
|
56
60
|
help="Path to the merged HDF5 output file (default: profiling_data.h5)",
|
|
57
61
|
)
|
|
62
|
+
parser.add_argument(
|
|
63
|
+
"--config",
|
|
64
|
+
metavar="FILE",
|
|
65
|
+
help="TOML file containing profiling settings ([profiling] table)",
|
|
66
|
+
)
|
|
58
67
|
parser.add_argument(
|
|
59
68
|
"-q",
|
|
60
69
|
"--quiet",
|
|
@@ -70,13 +79,14 @@ def _parse_run_args(argv):
|
|
|
70
79
|
parser.add_argument(
|
|
71
80
|
"--line-profile",
|
|
72
81
|
action="store_true",
|
|
82
|
+
default=None,
|
|
73
83
|
help="Also collect line-by-line timings via line_profiler "
|
|
74
84
|
"(requires scope-profiler[line-profiler])",
|
|
75
85
|
)
|
|
76
86
|
parser.add_argument(
|
|
77
87
|
"--buffer-limit",
|
|
78
88
|
type=int,
|
|
79
|
-
default=
|
|
89
|
+
default=None,
|
|
80
90
|
help="Initial buffer capacity per region; grows as needed (default: 1024)",
|
|
81
91
|
)
|
|
82
92
|
parser.add_argument("script", help="Script to run and profile")
|
|
@@ -100,11 +110,14 @@ def _run(argv):
|
|
|
100
110
|
raise SystemExit(1)
|
|
101
111
|
|
|
102
112
|
ProfileManager.setup(
|
|
103
|
-
|
|
104
|
-
|
|
113
|
+
# ``run`` historically enables recursive profiling. A TOML file may
|
|
114
|
+
# override it, while the no-config path keeps that default.
|
|
115
|
+
recursive_profile=True if args.config is None else None,
|
|
116
|
+
use_likwid=None,
|
|
105
117
|
use_line_profiler=args.line_profile,
|
|
106
118
|
buffer_limit=args.buffer_limit,
|
|
107
119
|
file_path=args.outfile,
|
|
120
|
+
config_path=args.config,
|
|
108
121
|
)
|
|
109
122
|
|
|
110
123
|
try:
|
|
@@ -166,6 +179,48 @@ def _check(argv):
|
|
|
166
179
|
return check_main(argv)
|
|
167
180
|
|
|
168
181
|
|
|
182
|
+
def _benchmark(argv):
|
|
183
|
+
"""Run or compare declarative, repeated benchmark manifests."""
|
|
184
|
+
from scope_profiler.benchmark import (
|
|
185
|
+
BenchmarkError,
|
|
186
|
+
compare_benchmarks,
|
|
187
|
+
load_config,
|
|
188
|
+
run_benchmark,
|
|
189
|
+
)
|
|
190
|
+
|
|
191
|
+
parser = argparse.ArgumentParser(
|
|
192
|
+
prog="scope-profiler benchmark",
|
|
193
|
+
description="Run or compare repeatable AI/CI benchmark workflows.",
|
|
194
|
+
)
|
|
195
|
+
subparsers = parser.add_subparsers(dest="action", required=True)
|
|
196
|
+
run_parser = subparsers.add_parser("run", help="run a benchmark config")
|
|
197
|
+
run_parser.add_argument("config", help="benchmark TOML configuration")
|
|
198
|
+
run_parser.add_argument(
|
|
199
|
+
"--label", default="candidate", help="baseline or candidate label"
|
|
200
|
+
)
|
|
201
|
+
run_parser.add_argument("--json", action="store_true", help="print only JSON")
|
|
202
|
+
compare_parser = subparsers.add_parser(
|
|
203
|
+
"compare", help="compare two benchmark manifests"
|
|
204
|
+
)
|
|
205
|
+
compare_parser.add_argument("baseline")
|
|
206
|
+
compare_parser.add_argument("candidate")
|
|
207
|
+
compare_parser.add_argument("--json", action="store_true", help="print only JSON")
|
|
208
|
+
args = parser.parse_args(argv)
|
|
209
|
+
try:
|
|
210
|
+
if args.action == "run":
|
|
211
|
+
result = run_benchmark(load_config(args.config), label=args.label)
|
|
212
|
+
exit_code = 0 if result["correctness"]["passed"] else 1
|
|
213
|
+
else:
|
|
214
|
+
result = compare_benchmarks(args.baseline, args.candidate)
|
|
215
|
+
exit_code = 0 if result["decision"] == "keep" else 1
|
|
216
|
+
except BenchmarkError as exc:
|
|
217
|
+
parser.error(str(exc))
|
|
218
|
+
print(__import__("json").dumps(result, indent=None if args.json else 2))
|
|
219
|
+
if exit_code:
|
|
220
|
+
raise SystemExit(exit_code)
|
|
221
|
+
return 0
|
|
222
|
+
|
|
223
|
+
|
|
169
224
|
def _import_fortran(argv):
|
|
170
225
|
"""Handle ``scope-profiler import-native``: Fortran traces -> HDF5."""
|
|
171
226
|
from scope_profiler.native_trace import TRACE_SUFFIX, convert_traces
|
|
@@ -242,6 +297,7 @@ _COMMANDS = {
|
|
|
242
297
|
"line-profile": _line_profile,
|
|
243
298
|
"diff": _diff,
|
|
244
299
|
"check": _check,
|
|
300
|
+
"benchmark": _benchmark,
|
|
245
301
|
"import-native": _import_fortran,
|
|
246
302
|
}
|
|
247
303
|
|
|
@@ -306,6 +362,11 @@ def main(argv=None):
|
|
|
306
362
|
add_help=False,
|
|
307
363
|
help="Fail on profiling regressions (see `scope-profiler check --help`)",
|
|
308
364
|
)
|
|
365
|
+
subparsers.add_parser(
|
|
366
|
+
"benchmark",
|
|
367
|
+
add_help=False,
|
|
368
|
+
help="Run or compare repeatable benchmarks (see `scope-profiler benchmark --help`)",
|
|
369
|
+
)
|
|
309
370
|
subparsers.add_parser(
|
|
310
371
|
"import-native",
|
|
311
372
|
add_help=False,
|
|
@@ -0,0 +1,234 @@
|
|
|
1
|
+
"""Repeatable benchmark workflows for coding agents and CI.
|
|
2
|
+
|
|
3
|
+
The benchmark format is TOML so it works with Python 3.10+ without adding a
|
|
4
|
+
configuration dependency. A benchmark run produces a JSON manifest containing
|
|
5
|
+
the individual profile paths, robust summary statistics, and correctness status.
|
|
6
|
+
"""
|
|
7
|
+
|
|
8
|
+
from __future__ import annotations
|
|
9
|
+
|
|
10
|
+
import json
|
|
11
|
+
import math
|
|
12
|
+
import os
|
|
13
|
+
import statistics
|
|
14
|
+
import subprocess
|
|
15
|
+
import sys
|
|
16
|
+
from dataclasses import asdict, dataclass
|
|
17
|
+
from pathlib import Path
|
|
18
|
+
|
|
19
|
+
try: # Python 3.11+
|
|
20
|
+
import tomllib
|
|
21
|
+
except ModuleNotFoundError: # Python 3.10
|
|
22
|
+
import tomli as tomllib
|
|
23
|
+
|
|
24
|
+
from scope_profiler.h5reader import read_h5
|
|
25
|
+
|
|
26
|
+
|
|
27
|
+
class BenchmarkError(Exception):
|
|
28
|
+
"""A user-facing benchmark configuration or execution error."""
|
|
29
|
+
|
|
30
|
+
|
|
31
|
+
@dataclass(frozen=True)
|
|
32
|
+
class BenchmarkConfig:
|
|
33
|
+
name: str
|
|
34
|
+
script: str
|
|
35
|
+
args: tuple[str, ...] = ()
|
|
36
|
+
runs: int = 5
|
|
37
|
+
warmups: int = 1
|
|
38
|
+
timeout_seconds: float = 300.0
|
|
39
|
+
only_user_code: bool = True
|
|
40
|
+
output_dir: str = ".scope-profiler"
|
|
41
|
+
correctness_command: tuple[str, ...] = ()
|
|
42
|
+
correctness_timeout_seconds: float = 300.0
|
|
43
|
+
threshold_pct: float = 2.0
|
|
44
|
+
|
|
45
|
+
|
|
46
|
+
def load_config(path: str | os.PathLike[str]) -> BenchmarkConfig:
|
|
47
|
+
"""Load and validate a benchmark TOML file."""
|
|
48
|
+
config_path = Path(path).resolve()
|
|
49
|
+
try:
|
|
50
|
+
with config_path.open("rb") as stream:
|
|
51
|
+
raw = tomllib.load(stream)
|
|
52
|
+
except OSError as exc:
|
|
53
|
+
raise BenchmarkError(
|
|
54
|
+
f"Could not read benchmark config {path!r}: {exc}"
|
|
55
|
+
) from exc
|
|
56
|
+
except tomllib.TOMLDecodeError as exc:
|
|
57
|
+
raise BenchmarkError(f"Invalid benchmark TOML {path!r}: {exc}") from exc
|
|
58
|
+
|
|
59
|
+
bench = raw.get("benchmark", raw)
|
|
60
|
+
script = bench.get("script")
|
|
61
|
+
if not script:
|
|
62
|
+
raise BenchmarkError("Benchmark config must define benchmark.script")
|
|
63
|
+
script_path = (config_path.parent / script).resolve()
|
|
64
|
+
if not script_path.is_file():
|
|
65
|
+
raise BenchmarkError(f"Benchmark script does not exist: {script_path}")
|
|
66
|
+
|
|
67
|
+
correctness = raw.get("correctness", {})
|
|
68
|
+
command = correctness.get("command", bench.get("correctness_command", []))
|
|
69
|
+
if isinstance(command, str):
|
|
70
|
+
command = [command]
|
|
71
|
+
config = BenchmarkConfig(
|
|
72
|
+
name=str(bench.get("name", config_path.stem)),
|
|
73
|
+
script=str(script_path),
|
|
74
|
+
args=tuple(str(x) for x in bench.get("args", [])),
|
|
75
|
+
runs=int(bench.get("runs", 5)),
|
|
76
|
+
warmups=int(bench.get("warmups", 1)),
|
|
77
|
+
timeout_seconds=float(bench.get("timeout_seconds", 300.0)),
|
|
78
|
+
only_user_code=bool(bench.get("only_user_code", True)),
|
|
79
|
+
output_dir=str(
|
|
80
|
+
(config_path.parent / bench.get("output_dir", ".scope-profiler")).resolve()
|
|
81
|
+
),
|
|
82
|
+
correctness_command=tuple(str(x) for x in command),
|
|
83
|
+
correctness_timeout_seconds=float(correctness.get("timeout_seconds", 300.0)),
|
|
84
|
+
threshold_pct=float(bench.get("threshold_pct", 2.0)),
|
|
85
|
+
)
|
|
86
|
+
if config.runs < 2:
|
|
87
|
+
raise BenchmarkError("benchmark.runs must be at least 2")
|
|
88
|
+
if config.warmups < 0 or config.timeout_seconds <= 0:
|
|
89
|
+
raise BenchmarkError(
|
|
90
|
+
"warmups must be non-negative and timeout_seconds positive"
|
|
91
|
+
)
|
|
92
|
+
if not 0 <= config.threshold_pct:
|
|
93
|
+
raise BenchmarkError("benchmark.threshold_pct must be non-negative")
|
|
94
|
+
return config
|
|
95
|
+
|
|
96
|
+
|
|
97
|
+
def _profile_once(config: BenchmarkConfig, path: Path) -> dict:
|
|
98
|
+
path.parent.mkdir(parents=True, exist_ok=True)
|
|
99
|
+
command = [sys.executable, "-m", "scope_profiler", "run", "-q", "-o", str(path)]
|
|
100
|
+
if not config.only_user_code:
|
|
101
|
+
command.append("--all")
|
|
102
|
+
command.extend([config.script, *config.args])
|
|
103
|
+
try:
|
|
104
|
+
completed = subprocess.run(
|
|
105
|
+
command,
|
|
106
|
+
capture_output=True,
|
|
107
|
+
text=True,
|
|
108
|
+
timeout=config.timeout_seconds,
|
|
109
|
+
check=False,
|
|
110
|
+
)
|
|
111
|
+
except subprocess.TimeoutExpired as exc:
|
|
112
|
+
raise BenchmarkError(
|
|
113
|
+
f"Benchmark run exceeded {config.timeout_seconds}s"
|
|
114
|
+
) from exc
|
|
115
|
+
if completed.returncode != 0:
|
|
116
|
+
raise BenchmarkError(
|
|
117
|
+
f"Benchmark run failed with exit code {completed.returncode}: "
|
|
118
|
+
f"{completed.stderr[-2000:]}"
|
|
119
|
+
)
|
|
120
|
+
if not path.exists():
|
|
121
|
+
raise BenchmarkError(f"Benchmark run produced no profile: {path}")
|
|
122
|
+
results = read_h5(path)
|
|
123
|
+
total = results.total_time
|
|
124
|
+
if total is None or not math.isfinite(total):
|
|
125
|
+
raise BenchmarkError(f"Profile has no finite total time: {path}")
|
|
126
|
+
regions = {
|
|
127
|
+
region.name: float(region.total_duration) for region in results.get_regions()
|
|
128
|
+
}
|
|
129
|
+
return {"path": str(path), "total_time_seconds": float(total), "regions": regions}
|
|
130
|
+
|
|
131
|
+
|
|
132
|
+
def _run_correctness(config: BenchmarkConfig) -> dict:
|
|
133
|
+
if not config.correctness_command:
|
|
134
|
+
return {
|
|
135
|
+
"configured": False,
|
|
136
|
+
"passed": True,
|
|
137
|
+
"command": [],
|
|
138
|
+
"stdout_tail": "",
|
|
139
|
+
"stderr_tail": "",
|
|
140
|
+
}
|
|
141
|
+
command = list(config.correctness_command)
|
|
142
|
+
if command[0] == "python":
|
|
143
|
+
command[0] = sys.executable
|
|
144
|
+
try:
|
|
145
|
+
completed = subprocess.run(
|
|
146
|
+
command,
|
|
147
|
+
cwd=Path(config.script).parent,
|
|
148
|
+
capture_output=True,
|
|
149
|
+
text=True,
|
|
150
|
+
timeout=config.correctness_timeout_seconds,
|
|
151
|
+
check=False,
|
|
152
|
+
)
|
|
153
|
+
except subprocess.TimeoutExpired:
|
|
154
|
+
return {
|
|
155
|
+
"configured": True,
|
|
156
|
+
"passed": False,
|
|
157
|
+
"command": command,
|
|
158
|
+
"error": "timeout",
|
|
159
|
+
}
|
|
160
|
+
return {
|
|
161
|
+
"configured": True,
|
|
162
|
+
"passed": completed.returncode == 0,
|
|
163
|
+
"returncode": completed.returncode,
|
|
164
|
+
"command": command,
|
|
165
|
+
"stdout_tail": completed.stdout[-2000:],
|
|
166
|
+
"stderr_tail": completed.stderr[-2000:],
|
|
167
|
+
}
|
|
168
|
+
|
|
169
|
+
|
|
170
|
+
def _stats(values: list[float]) -> dict:
|
|
171
|
+
return {
|
|
172
|
+
"count": len(values),
|
|
173
|
+
"min": min(values),
|
|
174
|
+
"max": max(values),
|
|
175
|
+
"mean": statistics.fmean(values),
|
|
176
|
+
"median": statistics.median(values),
|
|
177
|
+
"stdev": statistics.stdev(values) if len(values) > 1 else 0.0,
|
|
178
|
+
}
|
|
179
|
+
|
|
180
|
+
|
|
181
|
+
def run_benchmark(config: BenchmarkConfig, label: str = "candidate") -> dict:
|
|
182
|
+
"""Run warmups, correctness, and repeated measured profiles."""
|
|
183
|
+
output_dir = Path(config.output_dir) / config.name / label
|
|
184
|
+
for index in range(config.warmups):
|
|
185
|
+
_profile_once(config, output_dir / f"warmup-{index}.h5")
|
|
186
|
+
correctness = _run_correctness(config)
|
|
187
|
+
profiles = [
|
|
188
|
+
_profile_once(config, output_dir / f"run-{index}.h5")
|
|
189
|
+
for index in range(config.runs)
|
|
190
|
+
]
|
|
191
|
+
totals = [item["total_time_seconds"] for item in profiles]
|
|
192
|
+
manifest = {
|
|
193
|
+
"format": 1,
|
|
194
|
+
"name": config.name,
|
|
195
|
+
"label": label,
|
|
196
|
+
"config": asdict(config),
|
|
197
|
+
"correctness": correctness,
|
|
198
|
+
"profiles": profiles,
|
|
199
|
+
"total_time_seconds": _stats(totals),
|
|
200
|
+
}
|
|
201
|
+
manifest_path = output_dir / "benchmark.json"
|
|
202
|
+
manifest_path.write_text(json.dumps(manifest, indent=2) + "\n", encoding="utf-8")
|
|
203
|
+
manifest["manifest_path"] = str(manifest_path)
|
|
204
|
+
return manifest
|
|
205
|
+
|
|
206
|
+
|
|
207
|
+
def compare_benchmarks(baseline: dict | str, candidate: dict | str) -> dict:
|
|
208
|
+
"""Compare benchmark manifests using medians and report an agent decision."""
|
|
209
|
+
|
|
210
|
+
def load(value):
|
|
211
|
+
if isinstance(value, dict):
|
|
212
|
+
return value
|
|
213
|
+
return json.loads(Path(value).read_text(encoding="utf-8"))
|
|
214
|
+
|
|
215
|
+
base, cand = load(baseline), load(candidate)
|
|
216
|
+
base_median = base["total_time_seconds"]["median"]
|
|
217
|
+
cand_median = cand["total_time_seconds"]["median"]
|
|
218
|
+
change_pct = (
|
|
219
|
+
((cand_median - base_median) / base_median * 100) if base_median else None
|
|
220
|
+
)
|
|
221
|
+
threshold = float(cand.get("config", {}).get("threshold_pct", 2.0))
|
|
222
|
+
faster = bool(cand_median < base_median and change_pct <= -threshold)
|
|
223
|
+
correctness_passed = bool(cand.get("correctness", {}).get("passed", False))
|
|
224
|
+
decision = "keep" if faster and correctness_passed else "reject"
|
|
225
|
+
return {
|
|
226
|
+
"baseline": {"label": base.get("label"), "stats": base["total_time_seconds"]},
|
|
227
|
+
"candidate": {"label": cand.get("label"), "stats": cand["total_time_seconds"]},
|
|
228
|
+
"relative_change_pct": change_pct,
|
|
229
|
+
"speedup": base_median / cand_median if cand_median else None,
|
|
230
|
+
"faster_beyond_threshold": faster,
|
|
231
|
+
"correctness_passed": correctness_passed,
|
|
232
|
+
"decision": decision,
|
|
233
|
+
"threshold_pct": threshold,
|
|
234
|
+
}
|
|
@@ -10,6 +10,8 @@ configs, two job sizes) shows up as a single table instead of two separate
|
|
|
10
10
|
import argparse
|
|
11
11
|
import sys
|
|
12
12
|
|
|
13
|
+
from tabulate import tabulate
|
|
14
|
+
|
|
13
15
|
from scope_profiler.h5reader import read_h5
|
|
14
16
|
from scope_profiler.results import ProfilingResults
|
|
15
17
|
from scope_profiler.summary import region_rows
|
|
@@ -163,24 +165,14 @@ def print_diff_table(rows, metric: str = "total", title=None, stream=None) -> No
|
|
|
163
165
|
for row in rows
|
|
164
166
|
]
|
|
165
167
|
|
|
166
|
-
|
|
167
|
-
|
|
168
|
-
|
|
169
|
-
|
|
170
|
-
|
|
171
|
-
|
|
172
|
-
|
|
173
|
-
|
|
174
|
-
return " ".join(cells).rstrip()
|
|
175
|
-
|
|
176
|
-
header_line = render({key: header for key, header in columns})
|
|
177
|
-
rule = "-" * len(header_line)
|
|
178
|
-
|
|
179
|
-
print(f" {header_line}", file=stream)
|
|
180
|
-
print(f" {rule}", file=stream)
|
|
181
|
-
for row in formatted:
|
|
182
|
-
print(f" {render(row)}", file=stream)
|
|
183
|
-
print(f" {rule}", file=stream)
|
|
168
|
+
table_rows = [[row[key] for key, _ in columns] for row in formatted]
|
|
169
|
+
for line in tabulate(
|
|
170
|
+
table_rows,
|
|
171
|
+
headers=[header for _, header in columns],
|
|
172
|
+
tablefmt="rounded_outline",
|
|
173
|
+
disable_numparse=True,
|
|
174
|
+
).splitlines():
|
|
175
|
+
print(f" {line}", file=stream)
|
|
184
176
|
|
|
185
177
|
only_a = [row["name"] for row in rows if row["b"] is None]
|
|
186
178
|
only_b = [row["name"] for row in rows if row["a"] is None]
|