scope-profiler 0.2.7__tar.gz → 0.2.8__tar.gz
This diff represents the content of publicly available package versions that have been released to one of the supported registries. The information contained in this diff is provided for informational purposes only and reflects changes between package versions as they appear in their respective public registries.
- {scope_profiler-0.2.7 → scope_profiler-0.2.8}/PKG-INFO +68 -22
- {scope_profiler-0.2.7 → scope_profiler-0.2.8}/README.md +62 -19
- {scope_profiler-0.2.7 → scope_profiler-0.2.8}/pyproject.toml +22 -3
- {scope_profiler-0.2.7 → scope_profiler-0.2.8}/src/scope_profiler/__init__.py +2 -1
- {scope_profiler-0.2.7 → scope_profiler-0.2.8}/src/scope_profiler/__main__.py +107 -4
- scope_profiler-0.2.8/src/scope_profiler/c/Makefile +37 -0
- scope_profiler-0.2.8/src/scope_profiler/c/example.c +78 -0
- scope_profiler-0.2.8/src/scope_profiler/c/scope_profiler.c +399 -0
- scope_profiler-0.2.8/src/scope_profiler/c/scope_profiler.h +89 -0
- {scope_profiler-0.2.7 → scope_profiler-0.2.8}/src/scope_profiler/call_stack.py +2 -2
- scope_profiler-0.2.8/src/scope_profiler/diff.py +298 -0
- scope_profiler-0.2.8/src/scope_profiler/fortran/Makefile +41 -0
- scope_profiler-0.2.8/src/scope_profiler/fortran/example.f90 +80 -0
- scope_profiler-0.2.8/src/scope_profiler/fortran/scope_profiler.f90 +362 -0
- {scope_profiler-0.2.7 → scope_profiler-0.2.8}/src/scope_profiler/h5reader.py +11 -4
- scope_profiler-0.2.8/src/scope_profiler/h5writer.py +150 -0
- {scope_profiler-0.2.7 → scope_profiler-0.2.8}/src/scope_profiler/inspection.py +17 -15
- {scope_profiler-0.2.7 → scope_profiler-0.2.8}/src/scope_profiler/likwid_data.py +33 -7
- {scope_profiler-0.2.7 → scope_profiler-0.2.8}/src/scope_profiler/mpi_launch.py +4 -3
- {scope_profiler-0.2.7 → scope_profiler-0.2.8}/src/scope_profiler/mpi_region.py +1 -1
- scope_profiler-0.2.8/src/scope_profiler/native_trace.py +364 -0
- {scope_profiler-0.2.7 → scope_profiler-0.2.8}/src/scope_profiler/plotting_scripts.py +645 -76
- {scope_profiler-0.2.7 → scope_profiler-0.2.8}/src/scope_profiler/post_processing.py +335 -154
- {scope_profiler-0.2.7 → scope_profiler-0.2.8}/src/scope_profiler/prof_export.py +9 -9
- {scope_profiler-0.2.7 → scope_profiler-0.2.8}/src/scope_profiler/profile_config.py +11 -47
- {scope_profiler-0.2.7 → scope_profiler-0.2.8}/src/scope_profiler/profile_manager.py +314 -143
- {scope_profiler-0.2.7 → scope_profiler-0.2.8}/src/scope_profiler/region.py +1 -1
- {scope_profiler-0.2.7 → scope_profiler-0.2.8}/src/scope_profiler/region_profiler.py +69 -83
- {scope_profiler-0.2.7 → scope_profiler-0.2.8}/src/scope_profiler/results.py +87 -4
- {scope_profiler-0.2.7 → scope_profiler-0.2.8}/src/scope_profiler/speedscope_export.py +10 -10
- {scope_profiler-0.2.7 → scope_profiler-0.2.8}/src/scope_profiler/summary.py +30 -18
- {scope_profiler-0.2.7 → scope_profiler-0.2.8}/src/scope_profiler/tests/examples_pylikwid.py +17 -17
- {scope_profiler-0.2.7 → scope_profiler-0.2.8}/src/scope_profiler/tests/test_app.py +32 -13
- scope_profiler-0.2.8/src/scope_profiler/tests/test_c_api.py +617 -0
- scope_profiler-0.2.8/src/scope_profiler/tests/test_diff.py +210 -0
- scope_profiler-0.2.8/src/scope_profiler/tests/test_fortran_api.py +575 -0
- {scope_profiler-0.2.7 → scope_profiler-0.2.8}/src/scope_profiler/tests/test_label.py +15 -14
- {scope_profiler-0.2.7 → scope_profiler-0.2.8}/src/scope_profiler/tests/test_likwid_data.py +17 -17
- scope_profiler-0.2.8/src/scope_profiler/tests/test_main_cli.py +24 -0
- scope_profiler-0.2.8/src/scope_profiler/tests/test_mixed_language.py +251 -0
- {scope_profiler-0.2.7 → scope_profiler-0.2.8}/src/scope_profiler/tests/test_overhead.py +51 -29
- {scope_profiler-0.2.7 → scope_profiler-0.2.8}/src/scope_profiler/tests/test_post_processing.py +258 -39
- {scope_profiler-0.2.7 → scope_profiler-0.2.8}/src/scope_profiler/tests/test_prof_export.py +6 -7
- scope_profiler-0.2.7/src/scope_profiler/tests/test_reader_api.py → scope_profiler-0.2.8/src/scope_profiler/tests/test_results_api.py +88 -65
- {scope_profiler-0.2.7 → scope_profiler-0.2.8}/src/scope_profiler/tests/test_speedscope_export.py +6 -5
- {scope_profiler-0.2.7 → scope_profiler-0.2.8}/src/scope_profiler/tests/test_summary_likwid.py +3 -3
- scope_profiler-0.2.8/src/scope_profiler/tests/unit/test_h5writer.py +123 -0
- scope_profiler-0.2.8/src/scope_profiler/tests/unit/test_lazy_config.py +91 -0
- scope_profiler-0.2.8/src/scope_profiler/tests/unit/test_likwid_child_env.py +67 -0
- scope_profiler-0.2.8/src/scope_profiler/tests/unit/test_merge_results.py +125 -0
- {scope_profiler-0.2.7 → scope_profiler-0.2.8}/src/scope_profiler/tests/unit/test_mpi_launch.py +3 -3
- scope_profiler-0.2.8/src/scope_profiler/tests/unit/test_payload_collection.py +185 -0
- {scope_profiler-0.2.7 → scope_profiler-0.2.8}/src/scope_profiler.egg-info/PKG-INFO +68 -22
- {scope_profiler-0.2.7 → scope_profiler-0.2.8}/src/scope_profiler.egg-info/SOURCES.txt +22 -2
- {scope_profiler-0.2.7 → scope_profiler-0.2.8}/src/scope_profiler.egg-info/requires.txt +6 -2
- {scope_profiler-0.2.7 → scope_profiler-0.2.8}/setup.cfg +0 -0
- {scope_profiler-0.2.7 → scope_profiler-0.2.8}/src/scope_profiler/metadata.py +0 -0
- {scope_profiler-0.2.7 → scope_profiler-0.2.8}/src/scope_profiler/tests/__init__.py +0 -0
- {scope_profiler-0.2.7 → scope_profiler-0.2.8}/src/scope_profiler/tests/check_mpi_launch.py +0 -0
- {scope_profiler-0.2.7 → scope_profiler-0.2.8}/src/scope_profiler/tests/examples.py +0 -0
- {scope_profiler-0.2.7 → scope_profiler-0.2.8}/src/scope_profiler/tests/pylikwid_readme.py +0 -0
- {scope_profiler-0.2.7 → scope_profiler-0.2.8}/src/scope_profiler/tests/test_buffer_growth.py +0 -0
- {scope_profiler-0.2.7 → scope_profiler-0.2.8}/src/scope_profiler/tests/test_in_memory_results.py +0 -0
- {scope_profiler-0.2.7 → scope_profiler-0.2.8}/src/scope_profiler/tests/test_inspection.py +0 -0
- {scope_profiler-0.2.7 → scope_profiler-0.2.8}/src/scope_profiler/tests/test_metadata.py +0 -0
- {scope_profiler-0.2.7 → scope_profiler-0.2.8}/src/scope_profiler/tests/test_mpi.py +0 -0
- {scope_profiler-0.2.7 → scope_profiler-0.2.8}/src/scope_profiler/tests/test_readme.py +0 -0
- {scope_profiler-0.2.7 → scope_profiler-0.2.8}/src/scope_profiler/tests/test_repeated_finalize.py +0 -0
- {scope_profiler-0.2.7 → scope_profiler-0.2.8}/src/scope_profiler/tests/unit/__init__.py +0 -0
- {scope_profiler-0.2.7 → scope_profiler-0.2.8}/src/scope_profiler.egg-info/dependency_links.txt +0 -0
- {scope_profiler-0.2.7 → scope_profiler-0.2.8}/src/scope_profiler.egg-info/entry_points.txt +0 -0
- {scope_profiler-0.2.7 → scope_profiler-0.2.8}/src/scope_profiler.egg-info/top_level.txt +0 -0
|
@@ -1,6 +1,6 @@
|
|
|
1
1
|
Metadata-Version: 2.4
|
|
2
2
|
Name: scope-profiler
|
|
3
|
-
Version: 0.2.
|
|
3
|
+
Version: 0.2.8
|
|
4
4
|
Summary: Profile code regions in python, optionally with LIKWID markers.
|
|
5
5
|
Author: Max
|
|
6
6
|
Project-URL: Source, https://github.com/max-models/scope-profiler
|
|
@@ -16,6 +16,9 @@ Requires-Python: >=3.10
|
|
|
16
16
|
Description-Content-Type: text/markdown
|
|
17
17
|
Requires-Dist: h5py
|
|
18
18
|
Requires-Dist: numpy
|
|
19
|
+
Provides-Extra: fortran
|
|
20
|
+
Requires-Dist: meson; extra == "fortran"
|
|
21
|
+
Requires-Dist: ninja; extra == "fortran"
|
|
19
22
|
Provides-Extra: likwid
|
|
20
23
|
Requires-Dist: pylikwid; extra == "likwid"
|
|
21
24
|
Provides-Extra: line-profiler
|
|
@@ -26,14 +29,14 @@ Provides-Extra: pproc
|
|
|
26
29
|
Requires-Dist: ipykernel; extra == "pproc"
|
|
27
30
|
Requires-Dist: jupyterlab; extra == "pproc"
|
|
28
31
|
Requires-Dist: matplotlib; extra == "pproc"
|
|
29
|
-
Requires-Dist: maxplotlibx>=0.1.
|
|
32
|
+
Requires-Dist: maxplotlibx>=0.1.6; extra == "pproc"
|
|
30
33
|
Requires-Dist: pandas; extra == "pproc"
|
|
31
34
|
Requires-Dist: snakeviz; extra == "pproc"
|
|
32
35
|
Provides-Extra: dev
|
|
33
36
|
Requires-Dist: black[jupyter]; extra == "dev"
|
|
34
37
|
Requires-Dist: isort; extra == "dev"
|
|
35
38
|
Requires-Dist: ruff; extra == "dev"
|
|
36
|
-
Requires-Dist: scope-profiler[docs,line-profiler,mpi,pproc,test]; extra == "dev"
|
|
39
|
+
Requires-Dist: scope-profiler[docs,fortran,line-profiler,mpi,pproc,test]; extra == "dev"
|
|
37
40
|
Provides-Extra: docs
|
|
38
41
|
Requires-Dist: myst-parser; extra == "docs"
|
|
39
42
|
Requires-Dist: nbconvert; extra == "docs"
|
|
@@ -110,7 +113,6 @@ profiling_data.h5 (1 rank(s))
|
|
|
110
113
|
----------------------------------------------------------------------------------------
|
|
111
114
|
TOTAL 11 0.00150754
|
|
112
115
|
|
|
113
|
-
Regions may nest, so the summed total can exceed the wall-clock time.
|
|
114
116
|
```
|
|
115
117
|
|
|
116
118
|
`finalize()` prints the same table as `scope-profiler inspect` and
|
|
@@ -206,17 +208,60 @@ against a bare function call:
|
|
|
206
208
|
|
|
207
209
|
|
|
208
210
|
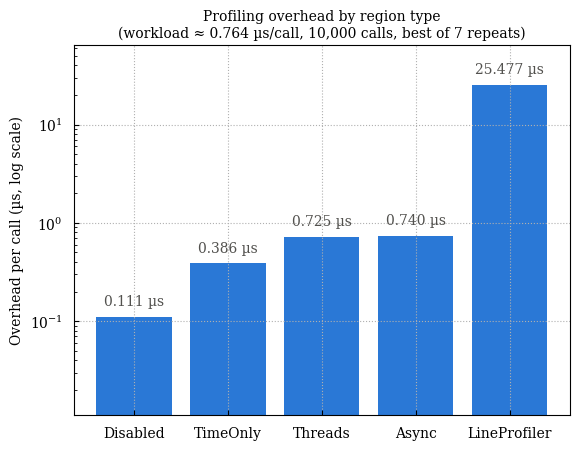
The default **TimeOnly** mode — nanosecond timestamps for every call — adds
|
|
209
|
-
roughly **0.
|
|
211
|
+
roughly **0.33 µs** per instrumented call.
|
|
210
212
|
|
|
211
213
|
Profiling can also be fully deactivated at setup time
|
|
212
|
-
(`deactivate_profiling=True`) to reduce the overhead to ~0.
|
|
214
|
+
(`deactivate_profiling=True`) to reduce the overhead to ~0.1 µs — barely
|
|
213
215
|
above a bare function call — making it safe to leave instrumentation in
|
|
214
216
|
production code and toggle it on only when needed.
|
|
215
217
|
|
|
216
|
-
The **LineProfiler** mode is intentionally heavier (~
|
|
218
|
+
The **LineProfiler** mode is intentionally heavier (~50 µs/call) because
|
|
217
219
|
`line_profiler` traces every source line. It is designed for targeted
|
|
218
220
|
debugging of individual functions, not for always-on use in hot loops.
|
|
219
221
|
|
|
222
|
+
## Profiling native code (C, C++, Fortran)
|
|
223
|
+
|
|
224
|
+
C and Fortran region APIs ship with the package, so native code — or the
|
|
225
|
+
kernels under a Python driver — can be profiled into the same output. They
|
|
226
|
+
share one trace format, so a program built from both lands in one profile.
|
|
227
|
+
|
|
228
|
+
```c
|
|
229
|
+
#include "scope_profiler.h"
|
|
230
|
+
|
|
231
|
+
sp_init("profile", my_rank);
|
|
232
|
+
int solve = sp_region("solve");
|
|
233
|
+
sp_begin(solve);
|
|
234
|
+
solve_system();
|
|
235
|
+
sp_end(solve);
|
|
236
|
+
sp_finalize();
|
|
237
|
+
```
|
|
238
|
+
|
|
239
|
+
```fortran
|
|
240
|
+
use scope_profiler
|
|
241
|
+
integer :: solve
|
|
242
|
+
|
|
243
|
+
call sp_init("profile", rank=my_rank)
|
|
244
|
+
solve = sp_region("solve")
|
|
245
|
+
call sp_begin(solve)
|
|
246
|
+
call solve_system()
|
|
247
|
+
call sp_end(solve)
|
|
248
|
+
call sp_finalize()
|
|
249
|
+
```
|
|
250
|
+
|
|
251
|
+
```bash
|
|
252
|
+
scope-profiler import-native . -o profiling_data.h5 # then pproc/inspect as usual
|
|
253
|
+
```
|
|
254
|
+
|
|
255
|
+
Both are one self-contained file (Fortran 2008, or C99 with an `extern "C"`
|
|
256
|
+
header for C++ callers): no HDF5, no MPI, nothing to link beyond libc.
|
|
257
|
+
|
|
258
|
+
Timestamps come from the same clock as Python's `time.perf_counter_ns()`, so a
|
|
259
|
+
Python driver and the native kernels it calls land on a single timeline —
|
|
260
|
+
`ProfileManager.finalize(native_traces=".")` folds them into one profile, with
|
|
261
|
+
the native regions nested inside the Python ones that called them. See the
|
|
262
|
+
[Fortran](https://scope-profiler.readthedocs.io/en/latest/guide/fortran.html)
|
|
263
|
+
and [C](https://scope-profiler.readthedocs.io/en/latest/guide/c.html) guides.
|
|
264
|
+
|
|
220
265
|
## Recursive profiling of nested calls
|
|
221
266
|
|
|
222
267
|
You can profile nested Python calls from one decorated entrypoint:
|
|
@@ -454,34 +499,35 @@ The JSON payload additionally includes a `colors` map (region or file label
|
|
|
454
499
|
to `#rrggbb`) matching the colors used in the matplotlib plot, so a
|
|
455
500
|
JavaScript charting library like Plotly can reproduce the same look.
|
|
456
501
|
|
|
457
|
-
`scope-profiler pproc --export
|
|
458
|
-
run, writing `gantt_data`, `flame_data`, `durations_data`, and (for
|
|
459
|
-
input files) `speedup_data` alongside the PNGs. Pass
|
|
460
|
-
json` to get `.json` files instead of the default
|
|
502
|
+
`scope-profiler pproc --export data` does the same for every selected plot in
|
|
503
|
+
one run, writing `gantt_data`, `flame_data`, `durations_data`, and (for
|
|
504
|
+
multiple input files) `speedup_data` alongside the PNGs. Pass
|
|
505
|
+
`--export-data-format json` to get `.json` files instead of the default
|
|
506
|
+
`.csv`:
|
|
461
507
|
|
|
462
508
|
```bash
|
|
463
|
-
scope-profiler pproc profiling_data.h5 -o figures --export
|
|
464
|
-
scope-profiler pproc profiling_data.h5 -o figures --export
|
|
509
|
+
scope-profiler pproc profiling_data.h5 -o figures --export data
|
|
510
|
+
scope-profiler pproc profiling_data.h5 -o figures --export data --export-data-format json
|
|
465
511
|
```
|
|
466
512
|
|
|
467
|
-
Pass `--skip-plot-images` (requires `--export
|
|
468
|
-
|
|
469
|
-
|
|
470
|
-
|
|
513
|
+
Pass `--skip-plot-images` (requires `--export`) to skip rendering the PNGs
|
|
514
|
+
entirely and only write the exported data plus `region_statistics.json` —
|
|
515
|
+
useful when a website renders charts client-side (e.g. with Plotly) straight
|
|
516
|
+
from the JSON:
|
|
471
517
|
|
|
472
518
|
```bash
|
|
473
519
|
scope-profiler pproc profiling_data.h5 -o figures \
|
|
474
|
-
--export
|
|
520
|
+
--export data --export-data-format json --skip-plot-images
|
|
475
521
|
```
|
|
476
522
|
|
|
477
523
|
### Viewing a run in snakeviz
|
|
478
524
|
|
|
479
|
-
`--export
|
|
525
|
+
`--export prof` writes the profile in the `.prof` format of the standard
|
|
480
526
|
library's `cProfile`, so a run can be explored with
|
|
481
527
|
[snakeviz](https://jiffyclub.github.io/snakeviz/) or `python -m pstats`:
|
|
482
528
|
|
|
483
529
|
```bash
|
|
484
|
-
scope-profiler pproc profiling_data.h5 -o figures --export
|
|
530
|
+
scope-profiler pproc profiling_data.h5 -o figures --export prof --skip-plot-images
|
|
485
531
|
snakeviz figures/profile_rank0.prof
|
|
486
532
|
```
|
|
487
533
|
|
|
@@ -492,12 +538,12 @@ written per exported rank, since `.prof` has no notion of ranks — see
|
|
|
492
538
|
|
|
493
539
|
### Viewing a run in speedscope
|
|
494
540
|
|
|
495
|
-
`--export
|
|
541
|
+
`--export speedscope` writes the run as a
|
|
496
542
|
[speedscope](https://www.speedscope.app) JSON file. Unlike `.prof`, it keeps
|
|
497
543
|
every individual call, so the timeline shows the run as it happened:
|
|
498
544
|
|
|
499
545
|
```bash
|
|
500
|
-
scope-profiler pproc profiling_data.h5 -o figures --export
|
|
546
|
+
scope-profiler pproc profiling_data.h5 -o figures --export speedscope --skip-plot-images
|
|
501
547
|
npx speedscope figures/profile.speedscope.json # or drop the file on speedscope.app
|
|
502
548
|
```
|
|
503
549
|
|
|
@@ -61,7 +61,6 @@ profiling_data.h5 (1 rank(s))
|
|
|
61
61
|
----------------------------------------------------------------------------------------
|
|
62
62
|
TOTAL 11 0.00150754
|
|
63
63
|
|
|
64
|
-
Regions may nest, so the summed total can exceed the wall-clock time.
|
|
65
64
|
```
|
|
66
65
|
|
|
67
66
|
`finalize()` prints the same table as `scope-profiler inspect` and
|
|
@@ -157,17 +156,60 @@ against a bare function call:
|
|
|
157
156
|

|
|
158
157
|
|
|
159
158
|
The default **TimeOnly** mode — nanosecond timestamps for every call — adds
|
|
160
|
-
roughly **0.
|
|
159
|
+
roughly **0.33 µs** per instrumented call.
|
|
161
160
|
|
|
162
161
|
Profiling can also be fully deactivated at setup time
|
|
163
|
-
(`deactivate_profiling=True`) to reduce the overhead to ~0.
|
|
162
|
+
(`deactivate_profiling=True`) to reduce the overhead to ~0.1 µs — barely
|
|
164
163
|
above a bare function call — making it safe to leave instrumentation in
|
|
165
164
|
production code and toggle it on only when needed.
|
|
166
165
|
|
|
167
|
-
The **LineProfiler** mode is intentionally heavier (~
|
|
166
|
+
The **LineProfiler** mode is intentionally heavier (~50 µs/call) because
|
|
168
167
|
`line_profiler` traces every source line. It is designed for targeted
|
|
169
168
|
debugging of individual functions, not for always-on use in hot loops.
|
|
170
169
|
|
|
170
|
+
## Profiling native code (C, C++, Fortran)
|
|
171
|
+
|
|
172
|
+
C and Fortran region APIs ship with the package, so native code — or the
|
|
173
|
+
kernels under a Python driver — can be profiled into the same output. They
|
|
174
|
+
share one trace format, so a program built from both lands in one profile.
|
|
175
|
+
|
|
176
|
+
```c
|
|
177
|
+
#include "scope_profiler.h"
|
|
178
|
+
|
|
179
|
+
sp_init("profile", my_rank);
|
|
180
|
+
int solve = sp_region("solve");
|
|
181
|
+
sp_begin(solve);
|
|
182
|
+
solve_system();
|
|
183
|
+
sp_end(solve);
|
|
184
|
+
sp_finalize();
|
|
185
|
+
```
|
|
186
|
+
|
|
187
|
+
```fortran
|
|
188
|
+
use scope_profiler
|
|
189
|
+
integer :: solve
|
|
190
|
+
|
|
191
|
+
call sp_init("profile", rank=my_rank)
|
|
192
|
+
solve = sp_region("solve")
|
|
193
|
+
call sp_begin(solve)
|
|
194
|
+
call solve_system()
|
|
195
|
+
call sp_end(solve)
|
|
196
|
+
call sp_finalize()
|
|
197
|
+
```
|
|
198
|
+
|
|
199
|
+
```bash
|
|
200
|
+
scope-profiler import-native . -o profiling_data.h5 # then pproc/inspect as usual
|
|
201
|
+
```
|
|
202
|
+
|
|
203
|
+
Both are one self-contained file (Fortran 2008, or C99 with an `extern "C"`
|
|
204
|
+
header for C++ callers): no HDF5, no MPI, nothing to link beyond libc.
|
|
205
|
+
|
|
206
|
+
Timestamps come from the same clock as Python's `time.perf_counter_ns()`, so a
|
|
207
|
+
Python driver and the native kernels it calls land on a single timeline —
|
|
208
|
+
`ProfileManager.finalize(native_traces=".")` folds them into one profile, with
|
|
209
|
+
the native regions nested inside the Python ones that called them. See the
|
|
210
|
+
[Fortran](https://scope-profiler.readthedocs.io/en/latest/guide/fortran.html)
|
|
211
|
+
and [C](https://scope-profiler.readthedocs.io/en/latest/guide/c.html) guides.
|
|
212
|
+
|
|
171
213
|
## Recursive profiling of nested calls
|
|
172
214
|
|
|
173
215
|
You can profile nested Python calls from one decorated entrypoint:
|
|
@@ -405,34 +447,35 @@ The JSON payload additionally includes a `colors` map (region or file label
|
|
|
405
447
|
to `#rrggbb`) matching the colors used in the matplotlib plot, so a
|
|
406
448
|
JavaScript charting library like Plotly can reproduce the same look.
|
|
407
449
|
|
|
408
|
-
`scope-profiler pproc --export
|
|
409
|
-
run, writing `gantt_data`, `flame_data`, `durations_data`, and (for
|
|
410
|
-
input files) `speedup_data` alongside the PNGs. Pass
|
|
411
|
-
json` to get `.json` files instead of the default
|
|
450
|
+
`scope-profiler pproc --export data` does the same for every selected plot in
|
|
451
|
+
one run, writing `gantt_data`, `flame_data`, `durations_data`, and (for
|
|
452
|
+
multiple input files) `speedup_data` alongside the PNGs. Pass
|
|
453
|
+
`--export-data-format json` to get `.json` files instead of the default
|
|
454
|
+
`.csv`:
|
|
412
455
|
|
|
413
456
|
```bash
|
|
414
|
-
scope-profiler pproc profiling_data.h5 -o figures --export
|
|
415
|
-
scope-profiler pproc profiling_data.h5 -o figures --export
|
|
457
|
+
scope-profiler pproc profiling_data.h5 -o figures --export data
|
|
458
|
+
scope-profiler pproc profiling_data.h5 -o figures --export data --export-data-format json
|
|
416
459
|
```
|
|
417
460
|
|
|
418
|
-
Pass `--skip-plot-images` (requires `--export
|
|
419
|
-
|
|
420
|
-
|
|
421
|
-
|
|
461
|
+
Pass `--skip-plot-images` (requires `--export`) to skip rendering the PNGs
|
|
462
|
+
entirely and only write the exported data plus `region_statistics.json` —
|
|
463
|
+
useful when a website renders charts client-side (e.g. with Plotly) straight
|
|
464
|
+
from the JSON:
|
|
422
465
|
|
|
423
466
|
```bash
|
|
424
467
|
scope-profiler pproc profiling_data.h5 -o figures \
|
|
425
|
-
--export
|
|
468
|
+
--export data --export-data-format json --skip-plot-images
|
|
426
469
|
```
|
|
427
470
|
|
|
428
471
|
### Viewing a run in snakeviz
|
|
429
472
|
|
|
430
|
-
`--export
|
|
473
|
+
`--export prof` writes the profile in the `.prof` format of the standard
|
|
431
474
|
library's `cProfile`, so a run can be explored with
|
|
432
475
|
[snakeviz](https://jiffyclub.github.io/snakeviz/) or `python -m pstats`:
|
|
433
476
|
|
|
434
477
|
```bash
|
|
435
|
-
scope-profiler pproc profiling_data.h5 -o figures --export
|
|
478
|
+
scope-profiler pproc profiling_data.h5 -o figures --export prof --skip-plot-images
|
|
436
479
|
snakeviz figures/profile_rank0.prof
|
|
437
480
|
```
|
|
438
481
|
|
|
@@ -443,12 +486,12 @@ written per exported rank, since `.prof` has no notion of ranks — see
|
|
|
443
486
|
|
|
444
487
|
### Viewing a run in speedscope
|
|
445
488
|
|
|
446
|
-
`--export
|
|
489
|
+
`--export speedscope` writes the run as a
|
|
447
490
|
[speedscope](https://www.speedscope.app) JSON file. Unlike `.prof`, it keeps
|
|
448
491
|
every individual call, so the timeline shows the run as it happened:
|
|
449
492
|
|
|
450
493
|
```bash
|
|
451
|
-
scope-profiler pproc profiling_data.h5 -o figures --export
|
|
494
|
+
scope-profiler pproc profiling_data.h5 -o figures --export speedscope --skip-plot-images
|
|
452
495
|
npx speedscope figures/profile.speedscope.json # or drop the file on speedscope.app
|
|
453
496
|
```
|
|
454
497
|
|
|
@@ -5,7 +5,7 @@ requires = [ "setuptools", "wheel" ]
|
|
|
5
5
|
|
|
6
6
|
[project]
|
|
7
7
|
name = "scope-profiler"
|
|
8
|
-
version = "0.2.
|
|
8
|
+
version = "0.2.8"
|
|
9
9
|
description = "Profile code regions in python, optionally with LIKWID markers."
|
|
10
10
|
readme = "README.md"
|
|
11
11
|
keywords = [ "python" ]
|
|
@@ -26,6 +26,13 @@ dependencies = [
|
|
|
26
26
|
"numpy",
|
|
27
27
|
]
|
|
28
28
|
|
|
29
|
+
optional-dependencies.fortran = [
|
|
30
|
+
# f2py's build backend, for building Fortran kernels into an extension
|
|
31
|
+
# module. The Fortran API itself needs only a compiler.
|
|
32
|
+
"meson",
|
|
33
|
+
"ninja",
|
|
34
|
+
]
|
|
35
|
+
|
|
29
36
|
optional-dependencies.likwid = [
|
|
30
37
|
"pylikwid",
|
|
31
38
|
]
|
|
@@ -42,7 +49,7 @@ optional-dependencies.pproc = [
|
|
|
42
49
|
"ipykernel",
|
|
43
50
|
"jupyterlab",
|
|
44
51
|
"matplotlib",
|
|
45
|
-
"maxplotlibx >= 0.1.
|
|
52
|
+
"maxplotlibx >= 0.1.6",
|
|
46
53
|
"pandas",
|
|
47
54
|
"snakeviz",
|
|
48
55
|
]
|
|
@@ -51,7 +58,7 @@ optional-dependencies.dev = [
|
|
|
51
58
|
"black[jupyter]",
|
|
52
59
|
"isort",
|
|
53
60
|
"ruff",
|
|
54
|
-
"scope-profiler[docs,line-profiler,mpi,pproc,test]",
|
|
61
|
+
"scope-profiler[docs,fortran,line-profiler,mpi,pproc,test]",
|
|
55
62
|
]
|
|
56
63
|
# https://medium.com/@pratikdomadiya123/build-project-documentation-quickly-with-the-sphinx-python-2a9732b66594
|
|
57
64
|
optional-dependencies.docs = [
|
|
@@ -75,5 +82,17 @@ scripts.scope-profiler = "scope_profiler.__main__:main"
|
|
|
75
82
|
[tool.setuptools.packages.find]
|
|
76
83
|
where = [ "src" ]
|
|
77
84
|
|
|
85
|
+
# The native region APIs ship with the wheel: they are source a user compiles
|
|
86
|
+
# into their own program, so they have to survive `pip install`.
|
|
87
|
+
# native_trace.fortran_source_path() / c_source_path() locate them at run time.
|
|
88
|
+
[tool.setuptools.package-data]
|
|
89
|
+
scope_profiler = [
|
|
90
|
+
"fortran/*.f90",
|
|
91
|
+
"fortran/Makefile",
|
|
92
|
+
"c/*.c",
|
|
93
|
+
"c/*.h",
|
|
94
|
+
"c/Makefile",
|
|
95
|
+
]
|
|
96
|
+
|
|
78
97
|
[tool.isort]
|
|
79
98
|
profile = "black"
|
|
@@ -12,7 +12,7 @@ from scope_profiler.likwid_data import LikwidRegionResult
|
|
|
12
12
|
from scope_profiler.mpi_region import MPIRegion
|
|
13
13
|
from scope_profiler.profile_manager import ProfileManager
|
|
14
14
|
from scope_profiler.region import Region
|
|
15
|
-
from scope_profiler.results import ProfilingResults
|
|
15
|
+
from scope_profiler.results import ProfilingResults, merge_results
|
|
16
16
|
|
|
17
17
|
try:
|
|
18
18
|
__version__ = version("scope-profiler")
|
|
@@ -46,6 +46,7 @@ __all__ = [
|
|
|
46
46
|
"build_call_stack",
|
|
47
47
|
"call_stack_children",
|
|
48
48
|
"call_stack_roots",
|
|
49
|
+
"merge_results",
|
|
49
50
|
"read_h5",
|
|
50
51
|
*sorted(_LAZY_ATTRS),
|
|
51
52
|
]
|
|
@@ -2,7 +2,7 @@
|
|
|
2
2
|
|
|
3
3
|
Also runnable as ``python -m scope_profiler <command> ...``.
|
|
4
4
|
|
|
5
|
-
|
|
5
|
+
Five subcommands:
|
|
6
6
|
|
|
7
7
|
- ``scope-profiler run script.py [args...]`` -- profiles a script's function
|
|
8
8
|
calls without requiring any decorators or context managers in the script
|
|
@@ -17,12 +17,22 @@ Three subcommands:
|
|
|
17
17
|
- ``scope-profiler inspect file.h5 [...]`` -- prints the run metadata and a
|
|
18
18
|
per-region statistics table for merged HDF5 profiling output, without
|
|
19
19
|
producing any plots. See ``scope_profiler.inspection``.
|
|
20
|
+
- ``scope-profiler diff a.h5 b.h5`` -- compares region statistics between two
|
|
21
|
+
merged HDF5 profiling files, region by region, so a regression (or
|
|
22
|
+
improvement) between two runs shows up in one table. See
|
|
23
|
+
``scope_profiler.diff``.
|
|
24
|
+
- ``scope-profiler import-native traces/ -o out.h5`` -- converts the trace
|
|
25
|
+
files written by the Fortran region API
|
|
26
|
+
(``scope_profiler/fortran/scope_profiler.f90``)
|
|
27
|
+
into the usual HDF5 output, so a Fortran run post-processes exactly like a
|
|
28
|
+
Python one. See ``scope_profiler.native_trace``.
|
|
20
29
|
"""
|
|
21
30
|
|
|
22
31
|
import argparse
|
|
23
32
|
import os
|
|
24
33
|
import sys
|
|
25
34
|
|
|
35
|
+
from scope_profiler import __version__
|
|
26
36
|
from scope_profiler.profile_manager import ProfileManager
|
|
27
37
|
|
|
28
38
|
|
|
@@ -107,21 +117,102 @@ def _inspect(argv):
|
|
|
107
117
|
return inspect_main(argv)
|
|
108
118
|
|
|
109
119
|
|
|
120
|
+
def _diff(argv):
|
|
121
|
+
"""Handle ``scope-profiler diff``: delegate to the diff CLI."""
|
|
122
|
+
from scope_profiler.diff import main as diff_main
|
|
123
|
+
|
|
124
|
+
return diff_main(argv)
|
|
125
|
+
|
|
126
|
+
|
|
127
|
+
def _import_fortran(argv):
|
|
128
|
+
"""Handle ``scope-profiler import-native``: Fortran traces -> HDF5."""
|
|
129
|
+
from scope_profiler.native_trace import TRACE_SUFFIX, convert_traces
|
|
130
|
+
|
|
131
|
+
parser = argparse.ArgumentParser(
|
|
132
|
+
prog="scope-profiler import-native",
|
|
133
|
+
description=(
|
|
134
|
+
"Convert the trace files written by the Fortran region API into a "
|
|
135
|
+
"standard scope-profiler HDF5 file."
|
|
136
|
+
),
|
|
137
|
+
)
|
|
138
|
+
parser.add_argument(
|
|
139
|
+
"inputs",
|
|
140
|
+
nargs="+",
|
|
141
|
+
help=f"trace files (*{TRACE_SUFFIX}) and/or directories containing them",
|
|
142
|
+
)
|
|
143
|
+
parser.add_argument(
|
|
144
|
+
"-o",
|
|
145
|
+
"--output",
|
|
146
|
+
default="profiling_data.h5",
|
|
147
|
+
help="HDF5 file to write (default: profiling_data.h5)",
|
|
148
|
+
)
|
|
149
|
+
parser.add_argument(
|
|
150
|
+
"--label",
|
|
151
|
+
default=None,
|
|
152
|
+
help="name for the run in summaries, charts and exports",
|
|
153
|
+
)
|
|
154
|
+
parser.add_argument(
|
|
155
|
+
"--merge",
|
|
156
|
+
metavar="PROFILE.h5",
|
|
157
|
+
default=None,
|
|
158
|
+
help="an existing profile to combine the traces with, for a run whose "
|
|
159
|
+
"Python side was profiled separately; region names must not clash",
|
|
160
|
+
)
|
|
161
|
+
parser.add_argument(
|
|
162
|
+
"-q",
|
|
163
|
+
"--quiet",
|
|
164
|
+
action="store_true",
|
|
165
|
+
help="do not print the summary table",
|
|
166
|
+
)
|
|
167
|
+
args = parser.parse_args(argv)
|
|
168
|
+
|
|
169
|
+
if args.merge is None:
|
|
170
|
+
path = convert_traces(args.inputs, args.output, label=args.label)
|
|
171
|
+
else:
|
|
172
|
+
from scope_profiler.h5reader import read_h5
|
|
173
|
+
from scope_profiler.native_trace import load_traces, write_results
|
|
174
|
+
from scope_profiler.results import merge_results
|
|
175
|
+
|
|
176
|
+
path = write_results(
|
|
177
|
+
merge_results(
|
|
178
|
+
read_h5(args.merge),
|
|
179
|
+
load_traces(args.inputs),
|
|
180
|
+
label=args.label,
|
|
181
|
+
file_path=args.output,
|
|
182
|
+
),
|
|
183
|
+
args.output,
|
|
184
|
+
)
|
|
185
|
+
|
|
186
|
+
if not args.quiet:
|
|
187
|
+
from scope_profiler.h5reader import read_h5
|
|
188
|
+
|
|
189
|
+
read_h5(path).print_summary()
|
|
190
|
+
print(f"\nwrote {path}")
|
|
191
|
+
return 0
|
|
192
|
+
|
|
193
|
+
|
|
110
194
|
_COMMANDS = {
|
|
111
195
|
"run": _run,
|
|
112
196
|
"pproc": _pproc,
|
|
113
197
|
"inspect": _inspect,
|
|
198
|
+
"diff": _diff,
|
|
199
|
+
"import-native": _import_fortran,
|
|
114
200
|
}
|
|
115
201
|
|
|
116
202
|
|
|
117
203
|
def main(argv=None):
|
|
118
|
-
"""Dispatch to the
|
|
204
|
+
"""Dispatch to the requested subcommand."""
|
|
119
205
|
argv = sys.argv[1:] if argv is None else list(argv)
|
|
120
206
|
|
|
121
207
|
parser = argparse.ArgumentParser(
|
|
122
208
|
prog="scope-profiler",
|
|
123
209
|
description="Profile scripts and post-process the resulting HDF5 output.",
|
|
124
210
|
)
|
|
211
|
+
parser.add_argument(
|
|
212
|
+
"--version",
|
|
213
|
+
action="version",
|
|
214
|
+
version=f"%(prog)s {__version__}",
|
|
215
|
+
)
|
|
125
216
|
subparsers = parser.add_subparsers(dest="command")
|
|
126
217
|
subparsers.add_parser(
|
|
127
218
|
"run",
|
|
@@ -140,12 +231,24 @@ def main(argv=None):
|
|
|
140
231
|
help="Print metadata and region statistics of HDF5 profiling data "
|
|
141
232
|
"(see `scope-profiler inspect --help`)",
|
|
142
233
|
)
|
|
234
|
+
subparsers.add_parser(
|
|
235
|
+
"diff",
|
|
236
|
+
add_help=False,
|
|
237
|
+
help="Compare region statistics between two HDF5 profiling files "
|
|
238
|
+
"(see `scope-profiler diff --help`)",
|
|
239
|
+
)
|
|
240
|
+
subparsers.add_parser(
|
|
241
|
+
"import-native",
|
|
242
|
+
add_help=False,
|
|
243
|
+
help="Convert Fortran API trace files into HDF5 "
|
|
244
|
+
"(see `scope-profiler import-native --help`)",
|
|
245
|
+
)
|
|
143
246
|
|
|
144
247
|
if not argv:
|
|
145
248
|
parser.print_help()
|
|
146
249
|
raise SystemExit(1)
|
|
147
|
-
if argv[0] in ("-h", "--help"):
|
|
148
|
-
parser.parse_args(argv) # prints help and exits(0)
|
|
250
|
+
if argv[0] in ("-h", "--help", "--version"):
|
|
251
|
+
parser.parse_args(argv) # prints help/version and exits(0)
|
|
149
252
|
return
|
|
150
253
|
|
|
151
254
|
command, *rest = argv
|
|
@@ -0,0 +1,37 @@
|
|
|
1
|
+
# Build the C region API and its example.
|
|
2
|
+
#
|
|
3
|
+
# make # build example into build/
|
|
4
|
+
# make CC=icx # use a different compiler
|
|
5
|
+
# make BUILD_DIR=/tmp/sp # build somewhere else
|
|
6
|
+
# make run # build, run, and import the trace
|
|
7
|
+
# make clean
|
|
8
|
+
#
|
|
9
|
+
# There is nothing to link beyond libc (and libm, for the example's sqrt):
|
|
10
|
+
# the implementation is one C99 file, no HDF5 and no MPI.
|
|
11
|
+
|
|
12
|
+
CC ?= cc
|
|
13
|
+
CFLAGS ?= -std=c99 -O2 -Wall -Wextra
|
|
14
|
+
BUILD_DIR ?= build
|
|
15
|
+
|
|
16
|
+
LIB_OBJ := $(BUILD_DIR)/scope_profiler.o
|
|
17
|
+
EXAMPLE := $(BUILD_DIR)/example
|
|
18
|
+
|
|
19
|
+
.PHONY: all run clean
|
|
20
|
+
|
|
21
|
+
all: $(EXAMPLE)
|
|
22
|
+
|
|
23
|
+
$(BUILD_DIR):
|
|
24
|
+
mkdir -p $(BUILD_DIR)
|
|
25
|
+
|
|
26
|
+
$(LIB_OBJ): scope_profiler.c scope_profiler.h | $(BUILD_DIR)
|
|
27
|
+
$(CC) $(CFLAGS) -I. -c scope_profiler.c -o $@
|
|
28
|
+
|
|
29
|
+
$(EXAMPLE): example.c $(LIB_OBJ)
|
|
30
|
+
$(CC) $(CFLAGS) -I. example.c $(LIB_OBJ) -lm -o $@
|
|
31
|
+
|
|
32
|
+
run: $(EXAMPLE)
|
|
33
|
+
cd $(BUILD_DIR) && ./example
|
|
34
|
+
scope-profiler import-native $(BUILD_DIR) -o $(BUILD_DIR)/profiling_data.h5
|
|
35
|
+
|
|
36
|
+
clean:
|
|
37
|
+
rm -rf $(BUILD_DIR)
|
|
@@ -0,0 +1,78 @@
|
|
|
1
|
+
/* Runnable example of the C region API.
|
|
2
|
+
*
|
|
3
|
+
* cc -O2 -c scope_profiler.c
|
|
4
|
+
* cc -O2 example.c scope_profiler.o -lm -o example
|
|
5
|
+
* ./example
|
|
6
|
+
* scope-profiler import-native . -o profiling_data.h5
|
|
7
|
+
* scope-profiler inspect profiling_data.h5
|
|
8
|
+
*/
|
|
9
|
+
#include "scope_profiler.h"
|
|
10
|
+
|
|
11
|
+
#include <math.h>
|
|
12
|
+
#include <stdio.h>
|
|
13
|
+
|
|
14
|
+
/* Something the compiler cannot optimise away. */
|
|
15
|
+
static double busy_work(int n)
|
|
16
|
+
{
|
|
17
|
+
double acc = 0.0;
|
|
18
|
+
int i;
|
|
19
|
+
|
|
20
|
+
for (i = 1; i <= n; ++i) {
|
|
21
|
+
acc += sqrt((double)i);
|
|
22
|
+
}
|
|
23
|
+
return acc;
|
|
24
|
+
}
|
|
25
|
+
|
|
26
|
+
/* Recursion: every invocation reserves its own slot in the same region. */
|
|
27
|
+
static int fib(int n)
|
|
28
|
+
{
|
|
29
|
+
int id = sp_region("fib_call");
|
|
30
|
+
int value;
|
|
31
|
+
|
|
32
|
+
sp_begin(id);
|
|
33
|
+
value = n < 2 ? n : fib(n - 1) + fib(n - 2);
|
|
34
|
+
sp_end(id);
|
|
35
|
+
return value;
|
|
36
|
+
}
|
|
37
|
+
|
|
38
|
+
int main(void)
|
|
39
|
+
{
|
|
40
|
+
int step, solve, assemble, io;
|
|
41
|
+
double total = 0.0;
|
|
42
|
+
|
|
43
|
+
sp_init("profile", 0);
|
|
44
|
+
|
|
45
|
+
/* Resolve the names once; the handles are what the hot loop uses. */
|
|
46
|
+
solve = sp_region("solve");
|
|
47
|
+
assemble = sp_region("assemble");
|
|
48
|
+
io = sp_region("checkpoint");
|
|
49
|
+
|
|
50
|
+
for (step = 1; step <= 20; ++step) {
|
|
51
|
+
sp_begin(assemble);
|
|
52
|
+
total += busy_work(20000);
|
|
53
|
+
sp_end(assemble);
|
|
54
|
+
|
|
55
|
+
sp_begin(solve);
|
|
56
|
+
total += busy_work(50000);
|
|
57
|
+
sp_end(solve);
|
|
58
|
+
|
|
59
|
+
if (step % 10 == 0) {
|
|
60
|
+
sp_begin(io);
|
|
61
|
+
total += busy_work(5000);
|
|
62
|
+
sp_end(io);
|
|
63
|
+
}
|
|
64
|
+
}
|
|
65
|
+
|
|
66
|
+
sp_begin(sp_region("fibonacci"));
|
|
67
|
+
step = fib(12);
|
|
68
|
+
sp_end(sp_region("fibonacci"));
|
|
69
|
+
|
|
70
|
+
printf("solve entered %lld time(s)\n", (long long)sp_num_calls(solve));
|
|
71
|
+
printf("checksum (ignore): %.4f\n", total + (double)step);
|
|
72
|
+
|
|
73
|
+
if (sp_finalize() != 0) {
|
|
74
|
+
return 1;
|
|
75
|
+
}
|
|
76
|
+
printf("wrote profile_rank00000.spt\n");
|
|
77
|
+
return 0;
|
|
78
|
+
}
|