ridgeplot-py 0.2.3__tar.gz → 0.2.7__tar.gz
This diff represents the content of publicly available package versions that have been released to one of the supported registries. The information contained in this diff is provided for informational purposes only and reflects changes between package versions as they appear in their respective public registries.
- {ridgeplot_py-0.2.3 → ridgeplot_py-0.2.7}/PKG-INFO +6 -5
- {ridgeplot_py-0.2.3 → ridgeplot_py-0.2.7}/pyproject.toml +20 -20
- {ridgeplot_py-0.2.3 → ridgeplot_py-0.2.7}/ridgeplot/colors.py +24 -2
- ridgeplot_py-0.2.7/ridgeplot/dotted_heatmap.py +69 -0
- {ridgeplot_py-0.2.3 → ridgeplot_py-0.2.7}/ridgeplot/ridge_plot.py +3 -1
- ridgeplot_py-0.2.3/setup.py +0 -33
- {ridgeplot_py-0.2.3 → ridgeplot_py-0.2.7}/LICENSE +0 -0
- {ridgeplot_py-0.2.3 → ridgeplot_py-0.2.7}/README.md +0 -0
- {ridgeplot_py-0.2.3 → ridgeplot_py-0.2.7}/ridgeplot/__init__.py +0 -0
- {ridgeplot_py-0.2.3 → ridgeplot_py-0.2.7}/ridgeplot/stats.py +0 -0
|
@@ -1,21 +1,22 @@
|
|
|
1
1
|
Metadata-Version: 2.1
|
|
2
2
|
Name: ridgeplot-py
|
|
3
|
-
Version: 0.2.
|
|
3
|
+
Version: 0.2.7
|
|
4
4
|
Summary: Plotting ridgeplots with matplotlib
|
|
5
5
|
License: MIT
|
|
6
6
|
Author: Douglas Wu
|
|
7
7
|
Author-email: wckdouglas@gmail.com
|
|
8
|
-
Requires-Python: >=3.
|
|
8
|
+
Requires-Python: >=3.9,<4.0
|
|
9
9
|
Classifier: License :: OSI Approved :: MIT License
|
|
10
10
|
Classifier: Programming Language :: Python :: 3
|
|
11
|
-
Classifier: Programming Language :: Python :: 3.8
|
|
12
11
|
Classifier: Programming Language :: Python :: 3.9
|
|
13
12
|
Classifier: Programming Language :: Python :: 3.10
|
|
14
13
|
Classifier: Programming Language :: Python :: 3.11
|
|
15
|
-
|
|
16
|
-
Requires-Dist: matplotlib (>=3.
|
|
14
|
+
Classifier: Programming Language :: Python :: 3.12
|
|
15
|
+
Requires-Dist: matplotlib (>=3.8,<4.0)
|
|
17
16
|
Requires-Dist: more-itertools (>=8.9.0,<9.0.0)
|
|
18
17
|
Requires-Dist: numpy (>=1.21.1,<2.0.0)
|
|
18
|
+
Requires-Dist: pandas (>=2.2.2,<3.0.0)
|
|
19
|
+
Requires-Dist: poetry (>=1.8.3,<2.0.0)
|
|
19
20
|
Requires-Dist: scipy (>=1.8.0,<2.0.0)
|
|
20
21
|
Description-Content-Type: text/markdown
|
|
21
22
|
|
|
@@ -1,35 +1,38 @@
|
|
|
1
1
|
[tool.poetry]
|
|
2
2
|
name = "ridgeplot-py"
|
|
3
|
-
version = "0.2.
|
|
3
|
+
version = "0.2.7" # managed by poetry-dynamic-versioning
|
|
4
4
|
description = "Plotting ridgeplots with matplotlib"
|
|
5
5
|
authors = ["Douglas Wu <wckdouglas@gmail.com>"]
|
|
6
6
|
license = "MIT"
|
|
7
|
-
packages = [
|
|
8
|
-
{"include" = "ridgeplot"}
|
|
9
|
-
]
|
|
7
|
+
packages = [{ "include" = "ridgeplot" }]
|
|
10
8
|
readme = "README.md"
|
|
11
9
|
|
|
12
10
|
[tool.poetry.dependencies]
|
|
13
|
-
python = "^3.
|
|
11
|
+
python = "^3.9"
|
|
14
12
|
scipy = "^1.8.0"
|
|
15
|
-
matplotlib = "^3.
|
|
13
|
+
matplotlib = "^3.8"
|
|
16
14
|
more-itertools = "^8.9.0"
|
|
17
15
|
numpy = "^1.21.1"
|
|
16
|
+
pandas = "^2.2.2"
|
|
17
|
+
poetry = "^1.8.3"
|
|
18
18
|
|
|
19
|
-
[tool.poetry.dev
|
|
19
|
+
[tool.poetry.group.dev]
|
|
20
|
+
optional = true
|
|
21
|
+
|
|
22
|
+
[tool.poetry.group.dev.dependencies]
|
|
20
23
|
pytest = "^6.2.5"
|
|
21
24
|
pytest-cov = "^2.12.1"
|
|
22
|
-
mypy = "^0.
|
|
23
|
-
black = "22.3.0"
|
|
25
|
+
mypy = "^0.990"
|
|
24
26
|
ruff = "^0.0.290"
|
|
27
|
+
pre-commit = "^3.7.0"
|
|
25
28
|
|
|
26
29
|
[tool.poetry-dynamic-versioning]
|
|
27
30
|
enable = false
|
|
28
31
|
vcs = "git"
|
|
29
|
-
metadata= false
|
|
32
|
+
metadata = false
|
|
30
33
|
bump = true
|
|
31
34
|
style = "pep440"
|
|
32
|
-
pattern
|
|
35
|
+
pattern = "^(?P<base>\\d+\\.\\d+\\.\\d+)(-?((?P<stage>[a-zA-Z]+)\\.?(?P<revision>\\d+)?))?"
|
|
33
36
|
format-jinja = """
|
|
34
37
|
{%- set ns = namespace(version=base) -%}
|
|
35
38
|
{%- for i in range(distance) -%}
|
|
@@ -42,20 +45,17 @@ format-jinja = """
|
|
|
42
45
|
requires = ["poetry-core>=1.0.0", "poetry-dynamic-versioning>=1.0.0,<2.0.0"]
|
|
43
46
|
build-backend = "poetry_dynamic_versioning.backend"
|
|
44
47
|
|
|
45
|
-
[tool.poetry.extras]
|
|
46
|
-
dev = ["pytest", "pytest-cov", "mypy", "ruff", "black"]
|
|
47
|
-
|
|
48
48
|
[tool.mypy]
|
|
49
49
|
plugins = "numpy.typing.mypy_plugin"
|
|
50
|
+
ignore_missing_imports = true
|
|
51
|
+
strict_optional = true
|
|
52
|
+
check_untyped_defs = true
|
|
50
53
|
|
|
51
54
|
[[tool.mypy.overrides]]
|
|
52
|
-
module = [
|
|
53
|
-
|
|
54
|
-
|
|
55
|
-
]
|
|
56
|
-
ignore_missing_imports = true
|
|
55
|
+
module = ["matplotlib.*", "scipy.*"]
|
|
56
|
+
ignore_errors = true
|
|
57
|
+
|
|
57
58
|
|
|
58
59
|
[tool.ruff]
|
|
59
60
|
line-length = 120
|
|
60
61
|
select = ['E', 'F', 'W', 'I']
|
|
61
|
-
|
|
@@ -3,11 +3,13 @@ for matplotlib plots and a collections of color palettes.
|
|
|
3
3
|
"""
|
|
4
4
|
|
|
5
5
|
from collections import OrderedDict
|
|
6
|
-
from typing import Any, Dict, List
|
|
6
|
+
from typing import Any, Dict, List, Tuple
|
|
7
7
|
|
|
8
8
|
import matplotlib.axes
|
|
9
9
|
import matplotlib.patches as mpatches
|
|
10
10
|
from matplotlib import legend
|
|
11
|
+
from matplotlib.cm import get_cmap
|
|
12
|
+
from matplotlib.colors import to_hex
|
|
11
13
|
|
|
12
14
|
ColorPalette: Dict[str, List[str]] = dict(
|
|
13
15
|
# 1. maximum
|
|
@@ -139,6 +141,7 @@ class ColorEncoder:
|
|
|
139
141
|
|
|
140
142
|
Example:
|
|
141
143
|
```
|
|
144
|
+
>>> from ridgeplot.colors import ColorEncoder, ColorPalette
|
|
142
145
|
>>> categorical_vector = ['group a','group b','group c','group a']
|
|
143
146
|
>>> colors = ColorPalette["okabeito"]
|
|
144
147
|
>>> ce = ColorEncoder()
|
|
@@ -248,7 +251,12 @@ class ColorEncoder:
|
|
|
248
251
|
self.fit(categories, colors=colors)
|
|
249
252
|
return self.transform(categories)
|
|
250
253
|
|
|
251
|
-
def show_legend(
|
|
254
|
+
def show_legend(
|
|
255
|
+
self,
|
|
256
|
+
ax: matplotlib.axes._axes.Axes,
|
|
257
|
+
sort: bool = False,
|
|
258
|
+
**kwargs: Dict[str, Any],
|
|
259
|
+
) -> legend.Legend:
|
|
252
260
|
"""
|
|
253
261
|
Adding matplotlib legend describing the color encoder to a matplotlib ax object
|
|
254
262
|
|
|
@@ -266,3 +274,17 @@ class ColorEncoder:
|
|
|
266
274
|
pat = [mpatches.Patch(color=col, label=lab) for lab, col in self.encoder.items()]
|
|
267
275
|
lgd = ax.legend(handles=pat, **kwargs)
|
|
268
276
|
return lgd
|
|
277
|
+
|
|
278
|
+
|
|
279
|
+
def get_cmap_color_values(cmap_name: str) -> Tuple[str, str]:
|
|
280
|
+
"""
|
|
281
|
+
Get color values for the min and max color in a color map
|
|
282
|
+
|
|
283
|
+
Args:
|
|
284
|
+
cmap_name: color map name (e.g. viridis)
|
|
285
|
+
|
|
286
|
+
Returns:
|
|
287
|
+
hex code for the min and max color
|
|
288
|
+
"""
|
|
289
|
+
cmap = get_cmap(cmap_name)
|
|
290
|
+
return to_hex(cmap(0.0)), to_hex(cmap(1.0))
|
|
@@ -0,0 +1,69 @@
|
|
|
1
|
+
"""
|
|
2
|
+
for most of the part, this is copied from:
|
|
3
|
+
https://stackoverflow.com/questions/59381273/heatmap-with-circles-indicating-size-of-population
|
|
4
|
+
"""
|
|
5
|
+
|
|
6
|
+
from __future__ import annotations
|
|
7
|
+
|
|
8
|
+
from typing import Optional
|
|
9
|
+
|
|
10
|
+
import matplotlib.axes
|
|
11
|
+
import matplotlib.pyplot as plt
|
|
12
|
+
import numpy as np
|
|
13
|
+
import pandas as pd
|
|
14
|
+
from matplotlib.collections import PatchCollection
|
|
15
|
+
|
|
16
|
+
|
|
17
|
+
def dotted_heatmap(
|
|
18
|
+
data: pd.DataFrame,
|
|
19
|
+
ax: matplotlib.axes._axes.Axes,
|
|
20
|
+
cmap: str = "cividis",
|
|
21
|
+
circle_size: Optional[float] = None,
|
|
22
|
+
):
|
|
23
|
+
"""
|
|
24
|
+
Plotting dotted heatmap
|
|
25
|
+
|
|
26
|
+
Example:
|
|
27
|
+
```
|
|
28
|
+
>>> import matplotlib.pyplot as plt
|
|
29
|
+
>>> from ridgeplot.dotted_heatmap import dotted_heatmap
|
|
30
|
+
>>> fig = plt.figure()
|
|
31
|
+
>>> ax = fig.add_subplot(111)
|
|
32
|
+
>>> data = pd.DataFrame(
|
|
33
|
+
... np.random.randn(n, n),
|
|
34
|
+
... index=[f"feature{i}" for i in range(n)],
|
|
35
|
+
... columns=[f"sample{i}" for i in range(n)],
|
|
36
|
+
... )
|
|
37
|
+
>>> dotted_heatmap(data=data,ax=ax, cmap="viridis")
|
|
38
|
+
```
|
|
39
|
+
|
|
40
|
+
Args:
|
|
41
|
+
data: data to plot
|
|
42
|
+
ax: matplotlib ax object
|
|
43
|
+
cmap: cmap value, defaults to "cividis"
|
|
44
|
+
circle_size: raidus of the circles,
|
|
45
|
+
if None, we will use relaive sizes, defaults to None
|
|
46
|
+
"""
|
|
47
|
+
nrows, ncols = data.shape
|
|
48
|
+
x, y = np.meshgrid(np.arange(ncols), np.arange(nrows))
|
|
49
|
+
radii = data.values / 2 / data.values.max()
|
|
50
|
+
# radius is relative if circle_size is None
|
|
51
|
+
circles = [
|
|
52
|
+
plt.Circle((j, i), radius=circle_size if circle_size is not None else r)
|
|
53
|
+
for r, j, i in zip(radii.flat, x.flat, y.flat)
|
|
54
|
+
]
|
|
55
|
+
col = PatchCollection(circles, array=data.values.flatten(), cmap=cmap)
|
|
56
|
+
ax.add_collection(col)
|
|
57
|
+
|
|
58
|
+
ax.set_xticks(np.arange(ncols))
|
|
59
|
+
ax.set_xticklabels(data.columns)
|
|
60
|
+
ax.set_yticks(np.arange(nrows))
|
|
61
|
+
ax.set_yticklabels(data.index)
|
|
62
|
+
|
|
63
|
+
ax.set_xticks(np.arange(ncols + 1) - 0.5, minor=True)
|
|
64
|
+
ax.set_yticks(np.arange(nrows + 1) - 0.5, minor=True)
|
|
65
|
+
ax.grid(which="minor", alpha=0.5, color="white")
|
|
66
|
+
ax.tick_params(left=False, bottom=False)
|
|
67
|
+
for d in ["top", "bottom", "left", "right"]:
|
|
68
|
+
ax.spines[d].set(alpha=0.5)
|
|
69
|
+
plt.colorbar(col)
|
|
@@ -1,6 +1,7 @@
|
|
|
1
1
|
"""This module contains the main function to plot
|
|
2
2
|
[ridgeplots](https://clauswilke.com/blog/2017/09/15/goodbye-joyplots/).
|
|
3
3
|
"""
|
|
4
|
+
|
|
4
5
|
from __future__ import annotations
|
|
5
6
|
|
|
6
7
|
from typing import Optional
|
|
@@ -18,7 +19,7 @@ class RidgePlotError(Exception):
|
|
|
18
19
|
|
|
19
20
|
|
|
20
21
|
def ridgeplot(
|
|
21
|
-
ax: matplotlib.axes,
|
|
22
|
+
ax: matplotlib.axes._axes.Axes,
|
|
22
23
|
data: dict[str, list[float]],
|
|
23
24
|
xlim: Optional[tuple[float, float]] = None,
|
|
24
25
|
fill_colors: Optional[list[str]] = None,
|
|
@@ -33,6 +34,7 @@ def ridgeplot(
|
|
|
33
34
|
```
|
|
34
35
|
>>> import numpy as np
|
|
35
36
|
>>> import matplotlib.pyplot as plt
|
|
37
|
+
>>> from ridgeplot.ridge_plot import ridgeplot
|
|
36
38
|
|
|
37
39
|
>>> data = {}
|
|
38
40
|
>>> for i in range(10):
|
ridgeplot_py-0.2.3/setup.py
DELETED
|
@@ -1,33 +0,0 @@
|
|
|
1
|
-
# -*- coding: utf-8 -*-
|
|
2
|
-
from setuptools import setup
|
|
3
|
-
|
|
4
|
-
packages = \
|
|
5
|
-
['ridgeplot']
|
|
6
|
-
|
|
7
|
-
package_data = \
|
|
8
|
-
{'': ['*']}
|
|
9
|
-
|
|
10
|
-
install_requires = \
|
|
11
|
-
['matplotlib>=3.1.3,<4.0.0',
|
|
12
|
-
'more-itertools>=8.9.0,<9.0.0',
|
|
13
|
-
'numpy>=1.21.1,<2.0.0',
|
|
14
|
-
'scipy>=1.8.0,<2.0.0']
|
|
15
|
-
|
|
16
|
-
setup_kwargs = {
|
|
17
|
-
'name': 'ridgeplot-py',
|
|
18
|
-
'version': '0.2.3',
|
|
19
|
-
'description': 'Plotting ridgeplots with matplotlib',
|
|
20
|
-
'long_description': '# ridgeplot-py #\n\n[](https://github.com/wckdouglas/ridgeplot-py/actions/workflows/ci.yaml) [](https://codecov.io/gh/wckdouglas/ridgeplot-py) [](https://badge.fury.io/py/ridgeplot-py) [](https://anaconda.org/conda-forge/ridgeplot-py)\n\n\nThis is a simple module for plotting [ridgeplot](https://clauswilke.com/blog/2017/09/15/goodbye-joyplots/) with the [scipy ecosystem](https://www.scipy.org/about.html).\n\nRidgeplot is a great data visualization technique to compare distributions from multiple groups at the same time, and was first introduced in 2017 as joy plot:\n\n<blockquote class="twitter-tweet"><p lang="en" dir="ltr">I hereby propose that we call these "joy plots" <a href="https://twitter.com/hashtag/rstats?src=hash&ref_src=twsrc%5Etfw">#rstats</a> <a href="https://t.co/uuLGpQLAwY">https://t.co/uuLGpQLAwY</a></p>— Jenny Bryan (@JennyBryan) <a href="https://twitter.com/JennyBryan/status/856674638981550080?ref_src=twsrc%5Etfw">April 25, 2017</a></blockquote> \n\n[ridgeplot-py](https://pypi.org/project/ridgeplot-py/) provides a simple API to produce matplotlib-compatible ridgeplots, as well as a handy [ColorEncoder](https://github.com/wckdouglas/ridgeplot-py/blob/0198628ce0622e2e7f4f4e9284165d5d09324ca9/ridgeplot/colors.py#L117) class with scikit-learn syntax for manipulating color annotations in a consistent way [through out manuscripts or presentations].\n\n## Install ##\n\n```bash\ngit clone git@github.com:wckdouglas/ridgeplot-py.git\ncd ridgeplot-py\npython setup.py install \n```\n\nor via conda:\n\n```bash\nconda install -c conda-forge ridgeplot-py\n```\n\nor via pypi:\n\n```bash\npip install ridgeplot-py\n```\n\n## Usage ##\n\n```python\nfrom ridgeplot import ridgeplot\nfrom ridgeplot.colors import ColorEncoder, ColorPalette\nimport numpy as np\nimport matplotlib.pyplot as plt\n\n# mocking some data\n# the input data should be a dict of\n# - keys: group names for the distributions\n# - values: list of values \ndata = {}\nfor i in range(8):\n data[\'data_{}\'.format(i)] = np.random.randn(100) * (i+1)\n\n# make the plot\nfig = plt.figure()\nax = fig.add_subplot(111)\nridgeplot(\n ax, \n data, \n xlim=(-20,20), \n label_size=15\n)\n```\n\n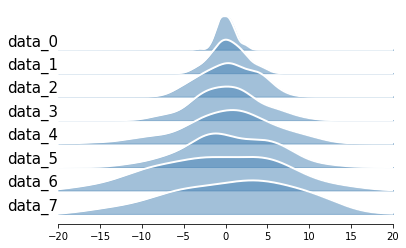\n\n\n## Example ##\n\nA [notebook](https://github.com/wckdouglas/ridgeplot-py/blob/main/Example.ipynb) showing quick howto is included in this repo!\n\n\n## Build on Apple silicon ##\n\nscipy may cause error and may be able to solved by the [this stackoverflow answer](https://stackoverflow.com/a/71764028):\n\n```\nbrew install openblas\nexport OPENBLAS="$(brew --prefix openblas)" \npoetry install\n```\n',
|
|
21
|
-
'author': 'Douglas Wu',
|
|
22
|
-
'author_email': 'wckdouglas@gmail.com',
|
|
23
|
-
'maintainer': 'None',
|
|
24
|
-
'maintainer_email': 'None',
|
|
25
|
-
'url': 'None',
|
|
26
|
-
'packages': packages,
|
|
27
|
-
'package_data': package_data,
|
|
28
|
-
'install_requires': install_requires,
|
|
29
|
-
'python_requires': '>=3.8,<4.0',
|
|
30
|
-
}
|
|
31
|
-
|
|
32
|
-
|
|
33
|
-
setup(**setup_kwargs)
|
|
File without changes
|
|
File without changes
|
|
File without changes
|
|
File without changes
|