reglscatterpy 0.4.0__tar.gz
This diff represents the content of publicly available package versions that have been released to one of the supported registries. The information contained in this diff is provided for informational purposes only and reflects changes between package versions as they appear in their respective public registries.
- reglscatterpy-0.4.0/.gitignore +7 -0
- reglscatterpy-0.4.0/PKG-INFO +292 -0
- reglscatterpy-0.4.0/README.md +247 -0
- reglscatterpy-0.4.0/SHOTLIST.md +44 -0
- reglscatterpy-0.4.0/data-raw/make_palettes.R +36 -0
- reglscatterpy-0.4.0/notebooks/reglscatterpy_tour.ipynb +6150 -0
- reglscatterpy-0.4.0/pyproject.toml +55 -0
- reglscatterpy-0.4.0/src/reglscatterpy/__init__.py +32 -0
- reglscatterpy-0.4.0/src/reglscatterpy/__main__.py +53 -0
- reglscatterpy-0.4.0/src/reglscatterpy/_compose.py +69 -0
- reglscatterpy-0.4.0/src/reglscatterpy/_export.py +315 -0
- reglscatterpy-0.4.0/src/reglscatterpy/_extract.py +271 -0
- reglscatterpy-0.4.0/src/reglscatterpy/_palettes.py +22 -0
- reglscatterpy-0.4.0/src/reglscatterpy/_payload.py +432 -0
- reglscatterpy-0.4.0/src/reglscatterpy/_widget.py +247 -0
- reglscatterpy-0.4.0/src/reglscatterpy/scatterplot.py +273 -0
- reglscatterpy-0.4.0/src/reglscatterpy/static/widget.js +700 -0
- reglscatterpy-0.4.0/tests/fixtures/README.md +11 -0
- reglscatterpy-0.4.0/tests/fixtures/parity_expected.json +1 -0
- reglscatterpy-0.4.0/tests/test_export.py +142 -0
- reglscatterpy-0.4.0/tests/test_extract.py +137 -0
- reglscatterpy-0.4.0/tests/test_payload_parity.py +80 -0
|
@@ -0,0 +1,292 @@
|
|
|
1
|
+
Metadata-Version: 2.4
|
|
2
|
+
Name: reglscatterpy
|
|
3
|
+
Version: 0.4.0
|
|
4
|
+
Summary: Interactive WebGL scatterplots for single-cell data (AnnData/MuData/SpatialData) in Jupyter, VS Code and Shiny for Python
|
|
5
|
+
Project-URL: Homepage, https://github.com/george123ya/reglscatterpy
|
|
6
|
+
Project-URL: Bug Tracker, https://github.com/george123ya/reglscatterpy/issues
|
|
7
|
+
Project-URL: R package, https://github.com/george123ya/reglScatterplotR
|
|
8
|
+
Author: George Muñoz
|
|
9
|
+
License: MIT
|
|
10
|
+
Keywords: anndata,scanpy,scatterplot,single-cell,visualization,webgl
|
|
11
|
+
Classifier: Framework :: Jupyter
|
|
12
|
+
Classifier: License :: OSI Approved :: MIT License
|
|
13
|
+
Classifier: Programming Language :: Python :: 3
|
|
14
|
+
Classifier: Topic :: Scientific/Engineering :: Bio-Informatics
|
|
15
|
+
Classifier: Topic :: Scientific/Engineering :: Visualization
|
|
16
|
+
Requires-Python: >=3.9
|
|
17
|
+
Requires-Dist: anywidget>=0.9
|
|
18
|
+
Requires-Dist: numpy
|
|
19
|
+
Requires-Dist: pandas
|
|
20
|
+
Provides-Extra: all
|
|
21
|
+
Requires-Dist: anndata; extra == 'all'
|
|
22
|
+
Requires-Dist: jupyter-scatter>=0.18; extra == 'all'
|
|
23
|
+
Requires-Dist: mudata; extra == 'all'
|
|
24
|
+
Requires-Dist: spatialdata; extra == 'all'
|
|
25
|
+
Provides-Extra: anndata
|
|
26
|
+
Requires-Dist: anndata; extra == 'anndata'
|
|
27
|
+
Provides-Extra: dev
|
|
28
|
+
Requires-Dist: anndata; extra == 'dev'
|
|
29
|
+
Requires-Dist: anywidget>=0.9; extra == 'dev'
|
|
30
|
+
Requires-Dist: ipykernel; extra == 'dev'
|
|
31
|
+
Requires-Dist: nbconvert>=7; extra == 'dev'
|
|
32
|
+
Requires-Dist: pytest; extra == 'dev'
|
|
33
|
+
Requires-Dist: scipy; extra == 'dev'
|
|
34
|
+
Provides-Extra: mudata
|
|
35
|
+
Requires-Dist: mudata; extra == 'mudata'
|
|
36
|
+
Provides-Extra: render
|
|
37
|
+
Requires-Dist: jupyter-scatter>=0.18; extra == 'render'
|
|
38
|
+
Provides-Extra: report
|
|
39
|
+
Requires-Dist: ipykernel; extra == 'report'
|
|
40
|
+
Requires-Dist: nbconvert>=7; extra == 'report'
|
|
41
|
+
Requires-Dist: nbformat; extra == 'report'
|
|
42
|
+
Provides-Extra: spatial
|
|
43
|
+
Requires-Dist: spatialdata; extra == 'spatial'
|
|
44
|
+
Description-Content-Type: text/markdown
|
|
45
|
+
|
|
46
|
+
# reglscatterpy
|
|
47
|
+
|
|
48
|
+
[](https://pypi.org/project/reglscatterpy/)
|
|
49
|
+
[](https://pypi.org/project/reglscatterpy/)
|
|
50
|
+
[](https://opensource.org/licenses/MIT)
|
|
51
|
+
|
|
52
|
+
Interactive WebGL scatterplots for single-cell / spatial data in Python —
|
|
53
|
+
**AnnData, MuData, SpatialData**, pandas, numpy. Renders millions of points in
|
|
54
|
+
the browser via [`regl-scatterplot`](https://github.com/flekschas/regl-scatterplot),
|
|
55
|
+
in **Jupyter, JupyterLab, VS Code and Colab**.
|
|
56
|
+
|
|
57
|
+
<p align="center">
|
|
58
|
+
<img src="https://raw.githubusercontent.com/george123ya/reglscatterpy/main/assets/demo.gif"
|
|
59
|
+
alt="Panning, lassoing and legend-filtering an interactive UMAP" width="760">
|
|
60
|
+
</p>
|
|
61
|
+
|
|
62
|
+
This is the Python companion to the R package
|
|
63
|
+
[**reglScatterplotR**](https://github.com/george123ya/reglScatterplotR). Both
|
|
64
|
+
drive the *same* compiled widget, so a plot looks and behaves identically across
|
|
65
|
+
R and Python — the draggable legend, `filter_by` distribution sliders, lasso,
|
|
66
|
+
tooltips and PNG/SVG/PDF export all come from one shared codebase. (Equivalence
|
|
67
|
+
is locked down by `tests/test_payload_parity.py`, which checks the Python
|
|
68
|
+
payload byte-for-byte against R fixtures.)
|
|
69
|
+
|
|
70
|
+
## Install
|
|
71
|
+
|
|
72
|
+
```bash
|
|
73
|
+
pip install reglscatterpy # numpy, pandas, anywidget
|
|
74
|
+
pip install anndata # for AnnData; mudata / spatialdata as needed
|
|
75
|
+
```
|
|
76
|
+
|
|
77
|
+
## Quick start
|
|
78
|
+
|
|
79
|
+
```python
|
|
80
|
+
import scanpy as sc
|
|
81
|
+
import reglscatterpy as rs
|
|
82
|
+
|
|
83
|
+
adata = sc.datasets.pbmc3k_processed()
|
|
84
|
+
rs.scatterplot(adata, x="X_umap", color_by="louvain") # an obs column
|
|
85
|
+
rs.scatterplot(adata, x="X_umap", color_by="CST3") # a gene
|
|
86
|
+
```
|
|
87
|
+
|
|
88
|
+
```python
|
|
89
|
+
import numpy as np, pandas as pd
|
|
90
|
+
df = pd.DataFrame({"x": np.random.rand(10_000), "y": np.random.rand(10_000),
|
|
91
|
+
"ct": np.random.choice(list("ABC"), 10_000)})
|
|
92
|
+
rs.scatterplot(df, x="x", y="y", color_by="ct")
|
|
93
|
+
```
|
|
94
|
+
|
|
95
|
+
Plots fill the notebook cell width by default; pass `width=` (pixels) for a
|
|
96
|
+
fixed size.
|
|
97
|
+
|
|
98
|
+
## Gallery
|
|
99
|
+
|
|
100
|
+
| Categorical colouring | Continuous (gene) colouring |
|
|
101
|
+
|---|---|
|
|
102
|
+
|  |  |
|
|
103
|
+
| **`filter_by` distribution sliders** | **Linked grid (`compose`)** |
|
|
104
|
+
|  |  |
|
|
105
|
+
|
|
106
|
+
> **Note:** like other Jupyter widgets, a plot's large state isn't reliably
|
|
107
|
+
> saved into the `.ipynb`, so after **reopening** a notebook the cell may show
|
|
108
|
+
> blank (or `Could not render … widget-view`) until you **re-run** it. To keep
|
|
109
|
+
> an interactive copy that survives reopening — and to share a plot with someone
|
|
110
|
+
> who has no kernel — export it to a standalone HTML file (see below).
|
|
111
|
+
|
|
112
|
+
## Save a standalone HTML (offline, kernel-free)
|
|
113
|
+
|
|
114
|
+
The Python equivalent of R's `htmlwidgets::saveWidget`: write a single
|
|
115
|
+
self-contained `.html` that **inlines the widget and the plot's data**, so it
|
|
116
|
+
opens in any browser with no kernel and no internet:
|
|
117
|
+
|
|
118
|
+
```python
|
|
119
|
+
w = rs.scatterplot(adata, x="X_umap", color_by="leiden")
|
|
120
|
+
rs.save_html(w, "umap.html") # or: w.to_html("umap.html")
|
|
121
|
+
```
|
|
122
|
+
|
|
123
|
+
The saved file is fully interactive (pan/zoom, legend, lasso, tooltips,
|
|
124
|
+
PNG/SVG/PDF export) but it's a **snapshot** — it has no kernel, so the Python
|
|
125
|
+
round-trips (`w.selection`, `w.annotate`, …) only work in the live notebook. The
|
|
126
|
+
widget bundle is inlined gzip-compressed (~0.5 MB, decompressed in-browser), so
|
|
127
|
+
a one-plot file is well under 1 MB. No R is involved — it's pure Python.
|
|
128
|
+
|
|
129
|
+
### A whole notebook → one HTML report (no re-running)
|
|
130
|
+
|
|
131
|
+
Plain `jupyter nbconvert --to html` leaves the plots blank (the same widget-state
|
|
132
|
+
limitation). The fix that **avoids re-executing a heavy notebook** is *record
|
|
133
|
+
mode*: call `rs.record_html()` once at the top, then run your notebook normally —
|
|
134
|
+
each plot bakes a static, interactive copy into its own cell output. After that:
|
|
135
|
+
|
|
136
|
+
```python
|
|
137
|
+
import reglscatterpy as rs
|
|
138
|
+
rs.record_html() # run once near the top, then work as usual
|
|
139
|
+
# ... rs.scatterplot(...) cells ...
|
|
140
|
+
```
|
|
141
|
+
|
|
142
|
+
```bash
|
|
143
|
+
# reopening the notebook now shows the plots, and either of these makes a report
|
|
144
|
+
# WITHOUT re-running anything:
|
|
145
|
+
jupyter nbconvert --to html analysis.ipynb
|
|
146
|
+
reglscatterpy-report analysis.ipynb -o analysis_report.html
|
|
147
|
+
```
|
|
148
|
+
|
|
149
|
+
`reglscatterpy-report` (and `rs.save_notebook_html(...)`) default to **not**
|
|
150
|
+
re-executing — they use the recorded outputs and share **one** copy of the
|
|
151
|
+
bundle across all plots. For a notebook that *wasn't* recorded, pass `--execute`
|
|
152
|
+
(CLI) / `execute=True` to re-run it once.
|
|
153
|
+
|
|
154
|
+
```python
|
|
155
|
+
rs.save_notebook_html("analysis.ipynb", "report.html") # uses outputs
|
|
156
|
+
rs.save_notebook_html("analysis.ipynb", "report.html", execute=True) # re-runs
|
|
157
|
+
```
|
|
158
|
+
|
|
159
|
+
> Recorded plots are a **one-way snapshot**: pan/zoom/lasso/tooltips/export all
|
|
160
|
+
> work, but `w.selection` / `w.annotate` no longer round-trip to Python (there's
|
|
161
|
+
> no kernel). Call `rs.record_html(False)` to go back to the live widget.
|
|
162
|
+
|
|
163
|
+
Needs `nbconvert` + `ipykernel` (`pip install 'reglscatterpy[report]'`). The
|
|
164
|
+
plots are fully offline; nbconvert's own page chrome (MathJax/RequireJS) is still
|
|
165
|
+
CDN-referenced — use [`nb_offline_convert`](https://github.com/trungleduc/nb_offline_convert)
|
|
166
|
+
if you need the surrounding report shell to be 100% offline too.
|
|
167
|
+
|
|
168
|
+
## Selection round-trip
|
|
169
|
+
|
|
170
|
+
Lasso points in the plot, then read them back in another cell — or drive the
|
|
171
|
+
selection from Python:
|
|
172
|
+
|
|
173
|
+
```python
|
|
174
|
+
w = rs.scatterplot(adata, x="X_umap", color_by="leiden")
|
|
175
|
+
w # show it, lasso some cells in the widget
|
|
176
|
+
|
|
177
|
+
w.selection # -> [12, 87, 134, ...] positional indices
|
|
178
|
+
adata[w.selection] # subset the AnnData directly
|
|
179
|
+
sub = w.subset() # same thing, as a convenience
|
|
180
|
+
|
|
181
|
+
w.selection = list(range(100)) # or set it from Python to highlight points
|
|
182
|
+
```
|
|
183
|
+
|
|
184
|
+
## Annotate cells by lassoing
|
|
185
|
+
|
|
186
|
+
Lasso a population, label it, and the label is written straight back into
|
|
187
|
+
`adata.obs` (or a DataFrame column) — curate cell types interactively:
|
|
188
|
+
|
|
189
|
+
```python
|
|
190
|
+
w = rs.scatterplot(adata, x="X_umap", color_by="leiden")
|
|
191
|
+
w # lasso a cluster
|
|
192
|
+
w.annotate("cell_type", "T cells") # -> writes adata.obs["cell_type"] for those cells
|
|
193
|
+
# lasso another, w.annotate("cell_type", "B cells"), ... then:
|
|
194
|
+
rs.scatterplot(adata, x="X_umap", color_by="cell_type")
|
|
195
|
+
```
|
|
196
|
+
|
|
197
|
+
## Differential expression of a selection
|
|
198
|
+
|
|
199
|
+
Lasso a population and get its top markers vs the rest (or vs another lasso):
|
|
200
|
+
|
|
201
|
+
```python
|
|
202
|
+
w = rs.scatterplot(adata, x="X_umap", color_by="leiden")
|
|
203
|
+
w # lasso a cluster
|
|
204
|
+
w.diff_expression(n=10) # top genes for the selection vs all other cells
|
|
205
|
+
# or two saved selections:
|
|
206
|
+
a = w.selection # after lassoing group A
|
|
207
|
+
# (lasso group B)
|
|
208
|
+
w.diff_expression(a, w.selection)
|
|
209
|
+
```
|
|
210
|
+
|
|
211
|
+
## Richer tooltips
|
|
212
|
+
|
|
213
|
+
Show extra fields on hover:
|
|
214
|
+
|
|
215
|
+
```python
|
|
216
|
+
rs.scatterplot(adata, x="X_umap", color_by="leiden",
|
|
217
|
+
tooltip_by=["n_genes", "sample", "CST3"]) # obs cols or genes
|
|
218
|
+
```
|
|
219
|
+
|
|
220
|
+
## Composition of a selection
|
|
221
|
+
|
|
222
|
+
Lasso a region and see what it's made of:
|
|
223
|
+
|
|
224
|
+
```python
|
|
225
|
+
w = rs.scatterplot(adata, x="X_umap", color_by="leiden")
|
|
226
|
+
w # lasso a region
|
|
227
|
+
w.composition("leiden") # -> count + fraction per cluster in the selection
|
|
228
|
+
```
|
|
229
|
+
|
|
230
|
+
## Linked grid
|
|
231
|
+
|
|
232
|
+
Compare embeddings side by side — pan/zoom and lasso selection stay in sync:
|
|
233
|
+
|
|
234
|
+
```python
|
|
235
|
+
from reglscatterpy import scatterplot, compose
|
|
236
|
+
|
|
237
|
+
a = scatterplot(adata, x="X_umap", color_by="leiden")
|
|
238
|
+
b = scatterplot(adata, x="X_pca", color_by="leiden")
|
|
239
|
+
compose([a, b]) # 2-up grid, linked camera + selection
|
|
240
|
+
```
|
|
241
|
+
|
|
242
|
+
## Toolbar & selection extras
|
|
243
|
+
|
|
244
|
+
`scatterplot(..., toolbar="left")` (or `"top"`, `"none"`) shows an in-plot
|
|
245
|
+
toolbar: pan, lasso, zoom-to-selection, reset, screenshot. Pass
|
|
246
|
+
`zoom_on_selection=True` to auto-frame a lasso selection.
|
|
247
|
+
|
|
248
|
+
Encode a numeric column on point **size** or **opacity** (in addition to
|
|
249
|
+
colour): `scatterplot(adata, x="X_umap", color_by="leiden", size_by="n_genes")`
|
|
250
|
+
or `opacity_by="total_counts"`.
|
|
251
|
+
|
|
252
|
+
## Supported objects
|
|
253
|
+
|
|
254
|
+
| Input | `x` (embedding) | `color_by` / `group_by` |
|
|
255
|
+
|-------|-----------------|-------------------------|
|
|
256
|
+
| `AnnData` | `obsm` key (`"X_umap"`, `"umap"`, `"spatial"`, …) | `obs` column or `var_names` feature |
|
|
257
|
+
| `MuData` | global `obsm` or `"modality:embedding"` | `obs` column or `"modality:feature"` |
|
|
258
|
+
| `SpatialData` | table's `obsm` (defaults to `"spatial"`) | table's `obs` / features |
|
|
259
|
+
| `pandas.DataFrame` | column name | column name or vector |
|
|
260
|
+
| `numpy.ndarray` | column index | vector |
|
|
261
|
+
|
|
262
|
+
## API parity with R
|
|
263
|
+
|
|
264
|
+
`rs.scatterplot(...)` mirrors R's `reglScatterplot(...)`: `color_by` / `group_by`,
|
|
265
|
+
`point_size`, `opacity`, `point_color`, `pixel_ratio`, `continuous_palette` /
|
|
266
|
+
`categorical_palette`, `custom_colors`, `vmin` / `vmax`, `center_zero`,
|
|
267
|
+
`filter_by`, legend styling, `enable_download`, and more.
|
|
268
|
+
|
|
269
|
+
> A `backend="jscatter"` option also exists if you'd rather render with
|
|
270
|
+
> [jupyter-scatter](https://github.com/flekschas/jupyter-scatter)
|
|
271
|
+
> (`pip install reglscatterpy[render]`); the default native widget is
|
|
272
|
+
> recommended.
|
|
273
|
+
|
|
274
|
+
## The widget bundle
|
|
275
|
+
|
|
276
|
+
`src/reglscatterpy/static/widget.js` is a **built artifact** (an anywidget ESM
|
|
277
|
+
bundle). Its source — the shared rendering widget plus the anywidget adapter —
|
|
278
|
+
lives in the **reglScatterplotR** repo under `js/`. To refresh it after a JS
|
|
279
|
+
change, build there and copy the result here:
|
|
280
|
+
|
|
281
|
+
```bash
|
|
282
|
+
# from a sibling checkout of reglScatterplotR
|
|
283
|
+
cd reglScatterplotR/js && npm install && npm run build
|
|
284
|
+
cp dist/widget.js ../../reglscatterpy/src/reglscatterpy/static/widget.js
|
|
285
|
+
```
|
|
286
|
+
|
|
287
|
+
## Develop / test
|
|
288
|
+
|
|
289
|
+
```bash
|
|
290
|
+
pip install -e .[dev]
|
|
291
|
+
pytest # extraction tests skip cleanly without anndata/scipy
|
|
292
|
+
```
|
|
@@ -0,0 +1,247 @@
|
|
|
1
|
+
# reglscatterpy
|
|
2
|
+
|
|
3
|
+
[](https://pypi.org/project/reglscatterpy/)
|
|
4
|
+
[](https://pypi.org/project/reglscatterpy/)
|
|
5
|
+
[](https://opensource.org/licenses/MIT)
|
|
6
|
+
|
|
7
|
+
Interactive WebGL scatterplots for single-cell / spatial data in Python —
|
|
8
|
+
**AnnData, MuData, SpatialData**, pandas, numpy. Renders millions of points in
|
|
9
|
+
the browser via [`regl-scatterplot`](https://github.com/flekschas/regl-scatterplot),
|
|
10
|
+
in **Jupyter, JupyterLab, VS Code and Colab**.
|
|
11
|
+
|
|
12
|
+
<p align="center">
|
|
13
|
+
<img src="https://raw.githubusercontent.com/george123ya/reglscatterpy/main/assets/demo.gif"
|
|
14
|
+
alt="Panning, lassoing and legend-filtering an interactive UMAP" width="760">
|
|
15
|
+
</p>
|
|
16
|
+
|
|
17
|
+
This is the Python companion to the R package
|
|
18
|
+
[**reglScatterplotR**](https://github.com/george123ya/reglScatterplotR). Both
|
|
19
|
+
drive the *same* compiled widget, so a plot looks and behaves identically across
|
|
20
|
+
R and Python — the draggable legend, `filter_by` distribution sliders, lasso,
|
|
21
|
+
tooltips and PNG/SVG/PDF export all come from one shared codebase. (Equivalence
|
|
22
|
+
is locked down by `tests/test_payload_parity.py`, which checks the Python
|
|
23
|
+
payload byte-for-byte against R fixtures.)
|
|
24
|
+
|
|
25
|
+
## Install
|
|
26
|
+
|
|
27
|
+
```bash
|
|
28
|
+
pip install reglscatterpy # numpy, pandas, anywidget
|
|
29
|
+
pip install anndata # for AnnData; mudata / spatialdata as needed
|
|
30
|
+
```
|
|
31
|
+
|
|
32
|
+
## Quick start
|
|
33
|
+
|
|
34
|
+
```python
|
|
35
|
+
import scanpy as sc
|
|
36
|
+
import reglscatterpy as rs
|
|
37
|
+
|
|
38
|
+
adata = sc.datasets.pbmc3k_processed()
|
|
39
|
+
rs.scatterplot(adata, x="X_umap", color_by="louvain") # an obs column
|
|
40
|
+
rs.scatterplot(adata, x="X_umap", color_by="CST3") # a gene
|
|
41
|
+
```
|
|
42
|
+
|
|
43
|
+
```python
|
|
44
|
+
import numpy as np, pandas as pd
|
|
45
|
+
df = pd.DataFrame({"x": np.random.rand(10_000), "y": np.random.rand(10_000),
|
|
46
|
+
"ct": np.random.choice(list("ABC"), 10_000)})
|
|
47
|
+
rs.scatterplot(df, x="x", y="y", color_by="ct")
|
|
48
|
+
```
|
|
49
|
+
|
|
50
|
+
Plots fill the notebook cell width by default; pass `width=` (pixels) for a
|
|
51
|
+
fixed size.
|
|
52
|
+
|
|
53
|
+
## Gallery
|
|
54
|
+
|
|
55
|
+
| Categorical colouring | Continuous (gene) colouring |
|
|
56
|
+
|---|---|
|
|
57
|
+
|  |  |
|
|
58
|
+
| **`filter_by` distribution sliders** | **Linked grid (`compose`)** |
|
|
59
|
+
|  |  |
|
|
60
|
+
|
|
61
|
+
> **Note:** like other Jupyter widgets, a plot's large state isn't reliably
|
|
62
|
+
> saved into the `.ipynb`, so after **reopening** a notebook the cell may show
|
|
63
|
+
> blank (or `Could not render … widget-view`) until you **re-run** it. To keep
|
|
64
|
+
> an interactive copy that survives reopening — and to share a plot with someone
|
|
65
|
+
> who has no kernel — export it to a standalone HTML file (see below).
|
|
66
|
+
|
|
67
|
+
## Save a standalone HTML (offline, kernel-free)
|
|
68
|
+
|
|
69
|
+
The Python equivalent of R's `htmlwidgets::saveWidget`: write a single
|
|
70
|
+
self-contained `.html` that **inlines the widget and the plot's data**, so it
|
|
71
|
+
opens in any browser with no kernel and no internet:
|
|
72
|
+
|
|
73
|
+
```python
|
|
74
|
+
w = rs.scatterplot(adata, x="X_umap", color_by="leiden")
|
|
75
|
+
rs.save_html(w, "umap.html") # or: w.to_html("umap.html")
|
|
76
|
+
```
|
|
77
|
+
|
|
78
|
+
The saved file is fully interactive (pan/zoom, legend, lasso, tooltips,
|
|
79
|
+
PNG/SVG/PDF export) but it's a **snapshot** — it has no kernel, so the Python
|
|
80
|
+
round-trips (`w.selection`, `w.annotate`, …) only work in the live notebook. The
|
|
81
|
+
widget bundle is inlined gzip-compressed (~0.5 MB, decompressed in-browser), so
|
|
82
|
+
a one-plot file is well under 1 MB. No R is involved — it's pure Python.
|
|
83
|
+
|
|
84
|
+
### A whole notebook → one HTML report (no re-running)
|
|
85
|
+
|
|
86
|
+
Plain `jupyter nbconvert --to html` leaves the plots blank (the same widget-state
|
|
87
|
+
limitation). The fix that **avoids re-executing a heavy notebook** is *record
|
|
88
|
+
mode*: call `rs.record_html()` once at the top, then run your notebook normally —
|
|
89
|
+
each plot bakes a static, interactive copy into its own cell output. After that:
|
|
90
|
+
|
|
91
|
+
```python
|
|
92
|
+
import reglscatterpy as rs
|
|
93
|
+
rs.record_html() # run once near the top, then work as usual
|
|
94
|
+
# ... rs.scatterplot(...) cells ...
|
|
95
|
+
```
|
|
96
|
+
|
|
97
|
+
```bash
|
|
98
|
+
# reopening the notebook now shows the plots, and either of these makes a report
|
|
99
|
+
# WITHOUT re-running anything:
|
|
100
|
+
jupyter nbconvert --to html analysis.ipynb
|
|
101
|
+
reglscatterpy-report analysis.ipynb -o analysis_report.html
|
|
102
|
+
```
|
|
103
|
+
|
|
104
|
+
`reglscatterpy-report` (and `rs.save_notebook_html(...)`) default to **not**
|
|
105
|
+
re-executing — they use the recorded outputs and share **one** copy of the
|
|
106
|
+
bundle across all plots. For a notebook that *wasn't* recorded, pass `--execute`
|
|
107
|
+
(CLI) / `execute=True` to re-run it once.
|
|
108
|
+
|
|
109
|
+
```python
|
|
110
|
+
rs.save_notebook_html("analysis.ipynb", "report.html") # uses outputs
|
|
111
|
+
rs.save_notebook_html("analysis.ipynb", "report.html", execute=True) # re-runs
|
|
112
|
+
```
|
|
113
|
+
|
|
114
|
+
> Recorded plots are a **one-way snapshot**: pan/zoom/lasso/tooltips/export all
|
|
115
|
+
> work, but `w.selection` / `w.annotate` no longer round-trip to Python (there's
|
|
116
|
+
> no kernel). Call `rs.record_html(False)` to go back to the live widget.
|
|
117
|
+
|
|
118
|
+
Needs `nbconvert` + `ipykernel` (`pip install 'reglscatterpy[report]'`). The
|
|
119
|
+
plots are fully offline; nbconvert's own page chrome (MathJax/RequireJS) is still
|
|
120
|
+
CDN-referenced — use [`nb_offline_convert`](https://github.com/trungleduc/nb_offline_convert)
|
|
121
|
+
if you need the surrounding report shell to be 100% offline too.
|
|
122
|
+
|
|
123
|
+
## Selection round-trip
|
|
124
|
+
|
|
125
|
+
Lasso points in the plot, then read them back in another cell — or drive the
|
|
126
|
+
selection from Python:
|
|
127
|
+
|
|
128
|
+
```python
|
|
129
|
+
w = rs.scatterplot(adata, x="X_umap", color_by="leiden")
|
|
130
|
+
w # show it, lasso some cells in the widget
|
|
131
|
+
|
|
132
|
+
w.selection # -> [12, 87, 134, ...] positional indices
|
|
133
|
+
adata[w.selection] # subset the AnnData directly
|
|
134
|
+
sub = w.subset() # same thing, as a convenience
|
|
135
|
+
|
|
136
|
+
w.selection = list(range(100)) # or set it from Python to highlight points
|
|
137
|
+
```
|
|
138
|
+
|
|
139
|
+
## Annotate cells by lassoing
|
|
140
|
+
|
|
141
|
+
Lasso a population, label it, and the label is written straight back into
|
|
142
|
+
`adata.obs` (or a DataFrame column) — curate cell types interactively:
|
|
143
|
+
|
|
144
|
+
```python
|
|
145
|
+
w = rs.scatterplot(adata, x="X_umap", color_by="leiden")
|
|
146
|
+
w # lasso a cluster
|
|
147
|
+
w.annotate("cell_type", "T cells") # -> writes adata.obs["cell_type"] for those cells
|
|
148
|
+
# lasso another, w.annotate("cell_type", "B cells"), ... then:
|
|
149
|
+
rs.scatterplot(adata, x="X_umap", color_by="cell_type")
|
|
150
|
+
```
|
|
151
|
+
|
|
152
|
+
## Differential expression of a selection
|
|
153
|
+
|
|
154
|
+
Lasso a population and get its top markers vs the rest (or vs another lasso):
|
|
155
|
+
|
|
156
|
+
```python
|
|
157
|
+
w = rs.scatterplot(adata, x="X_umap", color_by="leiden")
|
|
158
|
+
w # lasso a cluster
|
|
159
|
+
w.diff_expression(n=10) # top genes for the selection vs all other cells
|
|
160
|
+
# or two saved selections:
|
|
161
|
+
a = w.selection # after lassoing group A
|
|
162
|
+
# (lasso group B)
|
|
163
|
+
w.diff_expression(a, w.selection)
|
|
164
|
+
```
|
|
165
|
+
|
|
166
|
+
## Richer tooltips
|
|
167
|
+
|
|
168
|
+
Show extra fields on hover:
|
|
169
|
+
|
|
170
|
+
```python
|
|
171
|
+
rs.scatterplot(adata, x="X_umap", color_by="leiden",
|
|
172
|
+
tooltip_by=["n_genes", "sample", "CST3"]) # obs cols or genes
|
|
173
|
+
```
|
|
174
|
+
|
|
175
|
+
## Composition of a selection
|
|
176
|
+
|
|
177
|
+
Lasso a region and see what it's made of:
|
|
178
|
+
|
|
179
|
+
```python
|
|
180
|
+
w = rs.scatterplot(adata, x="X_umap", color_by="leiden")
|
|
181
|
+
w # lasso a region
|
|
182
|
+
w.composition("leiden") # -> count + fraction per cluster in the selection
|
|
183
|
+
```
|
|
184
|
+
|
|
185
|
+
## Linked grid
|
|
186
|
+
|
|
187
|
+
Compare embeddings side by side — pan/zoom and lasso selection stay in sync:
|
|
188
|
+
|
|
189
|
+
```python
|
|
190
|
+
from reglscatterpy import scatterplot, compose
|
|
191
|
+
|
|
192
|
+
a = scatterplot(adata, x="X_umap", color_by="leiden")
|
|
193
|
+
b = scatterplot(adata, x="X_pca", color_by="leiden")
|
|
194
|
+
compose([a, b]) # 2-up grid, linked camera + selection
|
|
195
|
+
```
|
|
196
|
+
|
|
197
|
+
## Toolbar & selection extras
|
|
198
|
+
|
|
199
|
+
`scatterplot(..., toolbar="left")` (or `"top"`, `"none"`) shows an in-plot
|
|
200
|
+
toolbar: pan, lasso, zoom-to-selection, reset, screenshot. Pass
|
|
201
|
+
`zoom_on_selection=True` to auto-frame a lasso selection.
|
|
202
|
+
|
|
203
|
+
Encode a numeric column on point **size** or **opacity** (in addition to
|
|
204
|
+
colour): `scatterplot(adata, x="X_umap", color_by="leiden", size_by="n_genes")`
|
|
205
|
+
or `opacity_by="total_counts"`.
|
|
206
|
+
|
|
207
|
+
## Supported objects
|
|
208
|
+
|
|
209
|
+
| Input | `x` (embedding) | `color_by` / `group_by` |
|
|
210
|
+
|-------|-----------------|-------------------------|
|
|
211
|
+
| `AnnData` | `obsm` key (`"X_umap"`, `"umap"`, `"spatial"`, …) | `obs` column or `var_names` feature |
|
|
212
|
+
| `MuData` | global `obsm` or `"modality:embedding"` | `obs` column or `"modality:feature"` |
|
|
213
|
+
| `SpatialData` | table's `obsm` (defaults to `"spatial"`) | table's `obs` / features |
|
|
214
|
+
| `pandas.DataFrame` | column name | column name or vector |
|
|
215
|
+
| `numpy.ndarray` | column index | vector |
|
|
216
|
+
|
|
217
|
+
## API parity with R
|
|
218
|
+
|
|
219
|
+
`rs.scatterplot(...)` mirrors R's `reglScatterplot(...)`: `color_by` / `group_by`,
|
|
220
|
+
`point_size`, `opacity`, `point_color`, `pixel_ratio`, `continuous_palette` /
|
|
221
|
+
`categorical_palette`, `custom_colors`, `vmin` / `vmax`, `center_zero`,
|
|
222
|
+
`filter_by`, legend styling, `enable_download`, and more.
|
|
223
|
+
|
|
224
|
+
> A `backend="jscatter"` option also exists if you'd rather render with
|
|
225
|
+
> [jupyter-scatter](https://github.com/flekschas/jupyter-scatter)
|
|
226
|
+
> (`pip install reglscatterpy[render]`); the default native widget is
|
|
227
|
+
> recommended.
|
|
228
|
+
|
|
229
|
+
## The widget bundle
|
|
230
|
+
|
|
231
|
+
`src/reglscatterpy/static/widget.js` is a **built artifact** (an anywidget ESM
|
|
232
|
+
bundle). Its source — the shared rendering widget plus the anywidget adapter —
|
|
233
|
+
lives in the **reglScatterplotR** repo under `js/`. To refresh it after a JS
|
|
234
|
+
change, build there and copy the result here:
|
|
235
|
+
|
|
236
|
+
```bash
|
|
237
|
+
# from a sibling checkout of reglScatterplotR
|
|
238
|
+
cd reglScatterplotR/js && npm install && npm run build
|
|
239
|
+
cp dist/widget.js ../../reglscatterpy/src/reglscatterpy/static/widget.js
|
|
240
|
+
```
|
|
241
|
+
|
|
242
|
+
## Develop / test
|
|
243
|
+
|
|
244
|
+
```bash
|
|
245
|
+
pip install -e .[dev]
|
|
246
|
+
pytest # extraction tests skip cleanly without anndata/scipy
|
|
247
|
+
```
|
|
@@ -0,0 +1,44 @@
|
|
|
1
|
+
# Media to capture for the README
|
|
2
|
+
|
|
3
|
+
Drop the files in `assets/` with these exact names (the README already links to
|
|
4
|
+
them). Use the bundled-style data so anyone can reproduce them, e.g.
|
|
5
|
+
`scanpy.datasets.pbmc3k_processed()` (a UMAP with a `louvain` column and genes
|
|
6
|
+
like `CST3`, `MS4A1`, `NKG7`).
|
|
7
|
+
|
|
8
|
+
## Stills (PNG)
|
|
9
|
+
|
|
10
|
+
| File | What to show | How |
|
|
11
|
+
|------|--------------|-----|
|
|
12
|
+
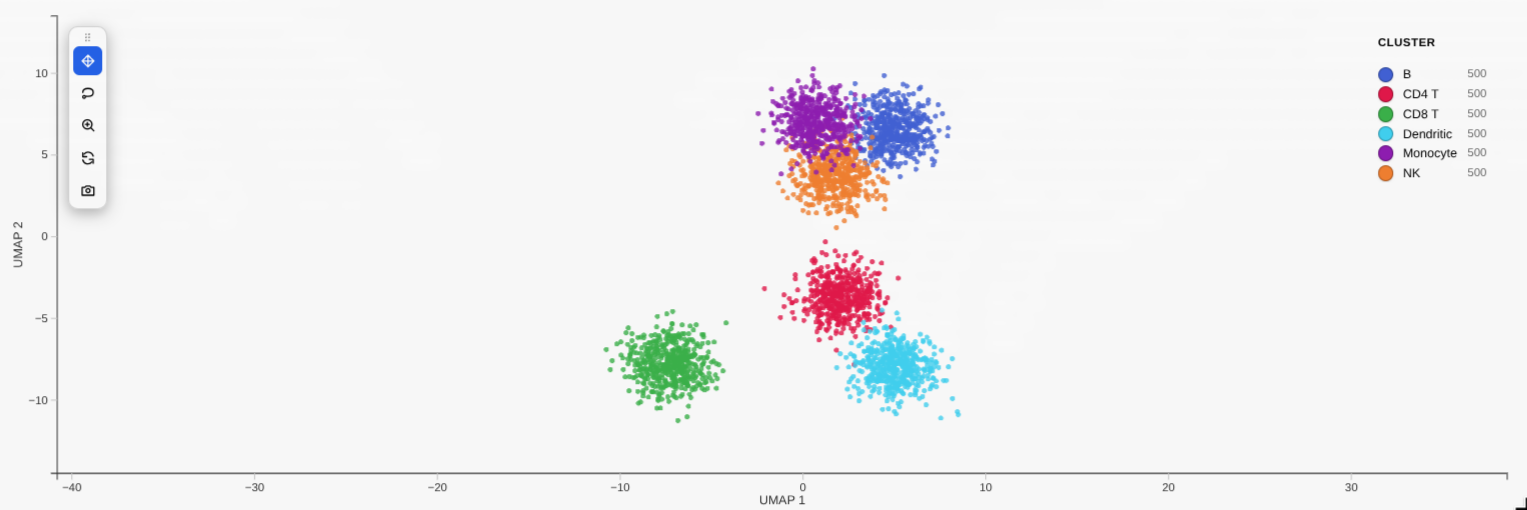
| `assets/umap-categorical.png` | UMAP coloured by a cluster column, **frosted legend visible** in a corner | `rs.scatterplot(adata, x="X_umap", color_by="louvain")` |
|
|
13
|
+
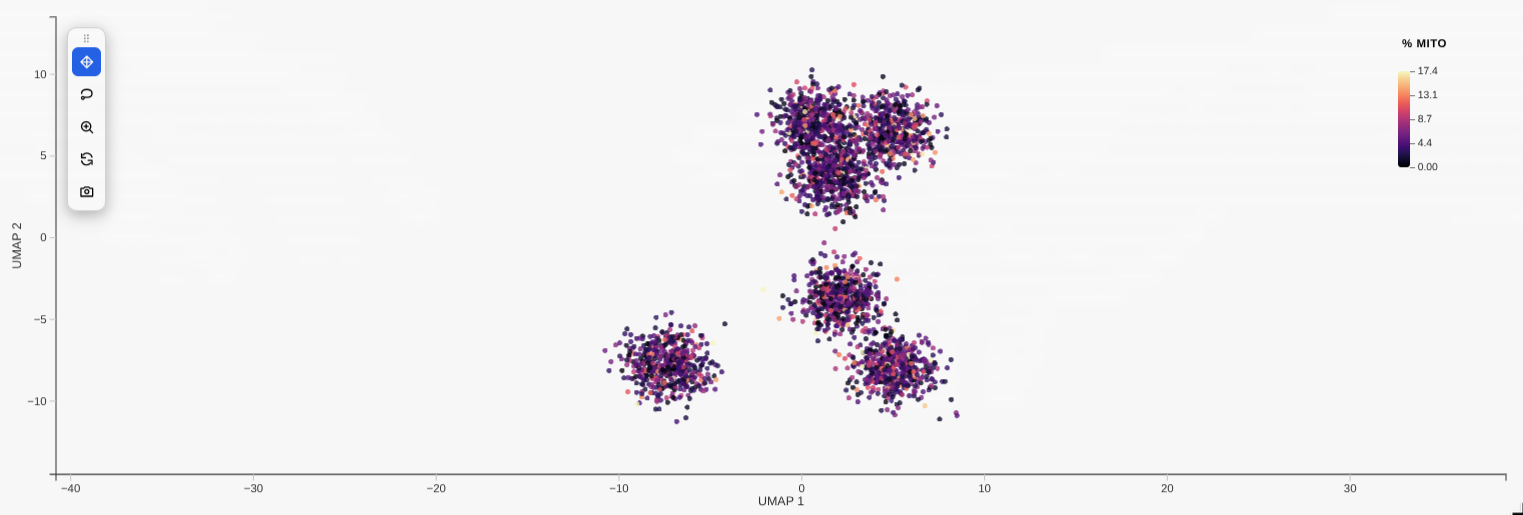
| `assets/umap-continuous.png` | Same UMAP coloured by a gene, **colour bar visible** | `rs.scatterplot(adata, x="X_umap", color_by="CST3", continuous_palette="viridis", vmax="p99")` |
|
|
14
|
+
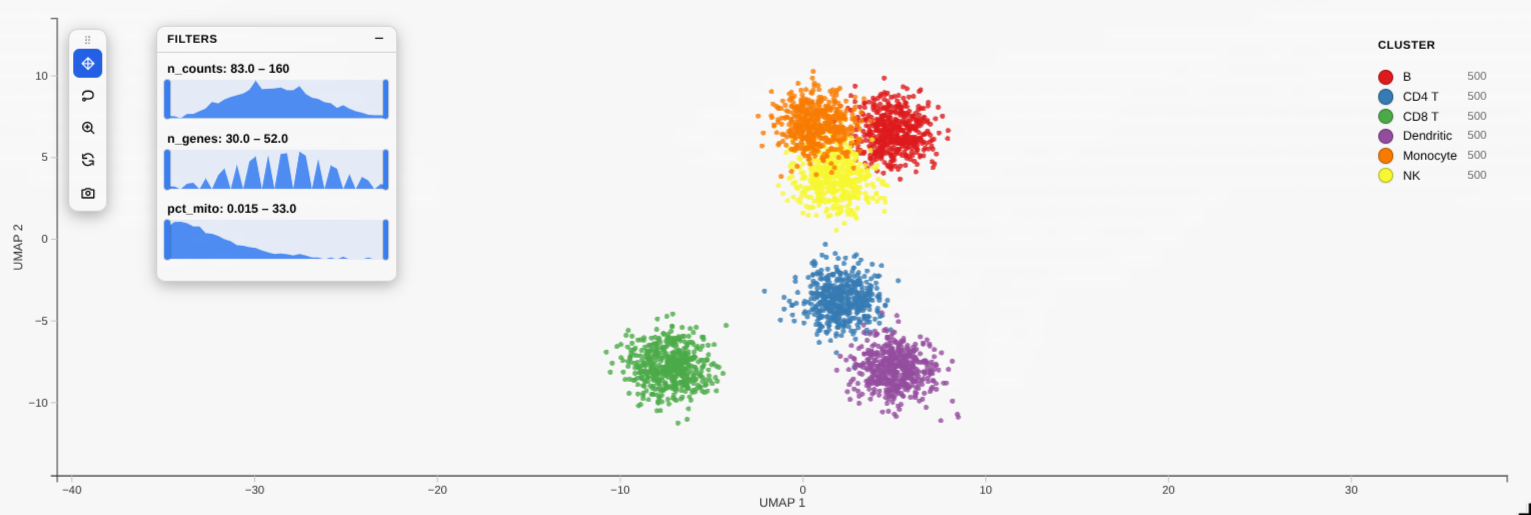
| `assets/filter-sliders.png` | The `filter_by` panel: a histogram with the dual-handle range brush, some points dimmed | `rs.scatterplot(adata, x="X_umap", color_by="louvain", filter_by=["n_genes"])` then drag a handle in |
|
|
15
|
+
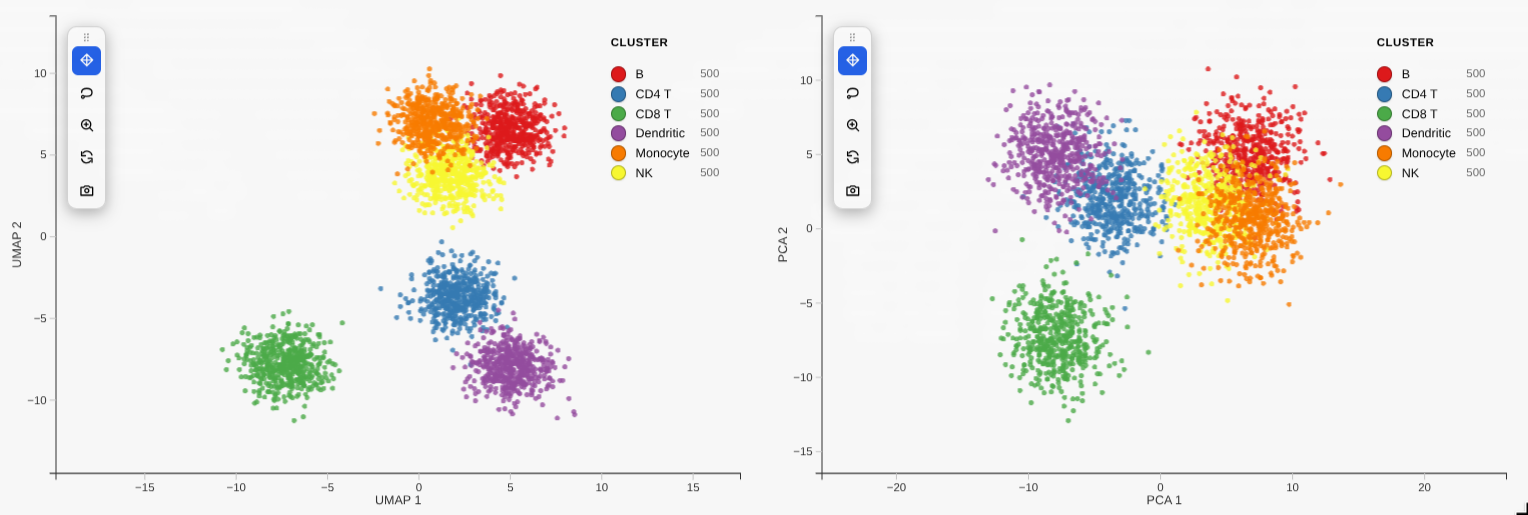
| `assets/linked-grid.png` | Two embeddings side by side, one zoomed (to prove the camera is synced) | `compose([scatterplot(adata, x="X_umap", color_by="louvain"), scatterplot(adata, x="X_pca", color_by="louvain")])` |
|
|
16
|
+
|
|
17
|
+
Capture the canvas region only (not the whole browser chrome). ~1400 px wide is
|
|
18
|
+
plenty; PNG, not JPG, so the points stay crisp.
|
|
19
|
+
|
|
20
|
+
## Hero animation (GIF)
|
|
21
|
+
|
|
22
|
+
`assets/demo.gif` — one ~8–12 s clip, in this order:
|
|
23
|
+
|
|
24
|
+
1. Pan and zoom (scroll) around the UMAP.
|
|
25
|
+
2. Drag the legend to another corner, then click a category to filter it out;
|
|
26
|
+
shift-click a second to extend.
|
|
27
|
+
3. Switch to the lasso tool and circle a cluster.
|
|
28
|
+
|
|
29
|
+
Keep it short and loopable. Target ≤ ~4 MB so it loads fast on PyPI/GitHub.
|
|
30
|
+
|
|
31
|
+
### Recording → GIF (Linux/Wayland)
|
|
32
|
+
|
|
33
|
+
```bash
|
|
34
|
+
# record a region to mp4 (pick the plot area)
|
|
35
|
+
wf-recorder -g "$(slurp)" -f demo.mp4
|
|
36
|
+
# trim if needed: ffmpeg -ss 2 -t 10 -i demo.mp4 -c copy demo_cut.mp4
|
|
37
|
+
# mp4 -> small GIF (high-quality palette, ~12 fps, 760 px wide to match README)
|
|
38
|
+
ffmpeg -i demo.mp4 -vf "fps=12,scale=760:-1:flags=lanczos,palettegen" -y pal.png
|
|
39
|
+
ffmpeg -i demo.mp4 -i pal.png -lavfi "fps=12,scale=760:-1:flags=lanczos[x];[x][1:v]paletteuse" -y assets/demo.gif
|
|
40
|
+
```
|
|
41
|
+
|
|
42
|
+
> Tip: an `.mp4` is far smaller than a GIF. If you'd rather embed video, drag the
|
|
43
|
+
> `.mp4` into the GitHub README via the web editor (GitHub hosts it) — but PyPI
|
|
44
|
+
> only renders images, so keep `demo.gif` for the PyPI page.
|
|
@@ -0,0 +1,36 @@
|
|
|
1
|
+
#!/usr/bin/env Rscript
|
|
2
|
+
# Regenerate src/reglscatterpy/_palettes.py from R so the Python package
|
|
3
|
+
# uses palettes byte-identical to reglScatterplotR (viridisLite + RColorBrewer).
|
|
4
|
+
#
|
|
5
|
+
# Run from the reglscatterpy repo root: Rscript data-raw/make_palettes.R
|
|
6
|
+
|
|
7
|
+
cont <- c("viridis", "magma", "plasma", "inferno", "cividis", "turbo")
|
|
8
|
+
fns <- list(
|
|
9
|
+
viridis = viridisLite::viridis, magma = viridisLite::magma,
|
|
10
|
+
plasma = viridisLite::plasma, inferno = viridisLite::inferno,
|
|
11
|
+
cividis = viridisLite::cividis, turbo = viridisLite::turbo
|
|
12
|
+
)
|
|
13
|
+
qual <- c("Set1", "Set2", "Set3", "Dark2", "Paired", "Accent", "Pastel1", "Pastel2")
|
|
14
|
+
|
|
15
|
+
out <- "src/reglscatterpy/_palettes.py"
|
|
16
|
+
con <- file(out, "w")
|
|
17
|
+
writeLines(c(
|
|
18
|
+
"# Auto-generated from R (viridisLite + RColorBrewer). Do not edit by hand.",
|
|
19
|
+
"# Regenerate via data-raw/make_palettes.R so palettes stay pixel-identical to reglScatterplotR.",
|
|
20
|
+
""
|
|
21
|
+
), con)
|
|
22
|
+
writeLines("CONTINUOUS = {", con)
|
|
23
|
+
for (nm in cont) {
|
|
24
|
+
hx <- substr(fns[[nm]](256L), 1, 7)
|
|
25
|
+
writeLines(sprintf(" %s: [%s],", shQuote(nm), paste0("\"", hx, "\"", collapse = ", ")), con)
|
|
26
|
+
}
|
|
27
|
+
writeLines(c("}", ""), con)
|
|
28
|
+
writeLines("QUALITATIVE = {", con)
|
|
29
|
+
for (nm in qual) {
|
|
30
|
+
mx <- RColorBrewer::brewer.pal.info[nm, "maxcolors"]
|
|
31
|
+
hx <- substr(RColorBrewer::brewer.pal(mx, nm), 1, 7)
|
|
32
|
+
writeLines(sprintf(" %s: [%s],", shQuote(nm), paste0("\"", hx, "\"", collapse = ", ")), con)
|
|
33
|
+
}
|
|
34
|
+
writeLines("}", con)
|
|
35
|
+
close(con)
|
|
36
|
+
cat("wrote", out, "\n")
|