pyretailscience 0.3.2__tar.gz → 0.4.0__tar.gz
This diff represents the content of publicly available package versions that have been released to one of the supported registries. The information contained in this diff is provided for informational purposes only and reflects changes between package versions as they appear in their respective public registries.
- pyretailscience-0.4.0/PKG-INFO +221 -0
- pyretailscience-0.4.0/README.md +192 -0
- pyretailscience-0.4.0/pyproject.toml +151 -0
- pyretailscience-0.4.0/pyretailscience/cross_shop.py +258 -0
- {pyretailscience-0.3.2 → pyretailscience-0.4.0}/pyretailscience/customer.py +142 -146
- pyretailscience-0.4.0/pyretailscience/gain_loss.py +324 -0
- pyretailscience-0.4.0/pyretailscience/options.py +504 -0
- pyretailscience-0.4.0/pyretailscience/plots/bar.py +370 -0
- pyretailscience-0.4.0/pyretailscience/plots/histogram.py +270 -0
- pyretailscience-0.4.0/pyretailscience/plots/line.py +126 -0
- pyretailscience-0.4.0/pyretailscience/product_association.py +308 -0
- {pyretailscience-0.3.2 → pyretailscience-0.4.0}/pyretailscience/range_planning.py +64 -107
- pyretailscience-0.4.0/pyretailscience/revenue_tree.py +628 -0
- pyretailscience-0.4.0/pyretailscience/segmentation.py +403 -0
- {pyretailscience-0.3.2 → pyretailscience-0.4.0}/pyretailscience/standard_graphs.py +179 -48
- pyretailscience-0.4.0/pyretailscience/style/__init__.py +1 -0
- pyretailscience-0.4.0/pyretailscience/style/graph_utils.py +361 -0
- {pyretailscience-0.3.2 → pyretailscience-0.4.0}/pyretailscience/style/tailwind.py +72 -13
- pyretailscience-0.3.2/PKG-INFO +0 -99
- pyretailscience-0.3.2/README.md +0 -71
- pyretailscience-0.3.2/pyproject.toml +0 -49
- pyretailscience-0.3.2/pyretailscience/data/cli.py +0 -46
- pyretailscience-0.3.2/pyretailscience/data/contracts.py +0 -408
- pyretailscience-0.3.2/pyretailscience/data/simulation.py +0 -452
- pyretailscience-0.3.2/pyretailscience/segmentation.py +0 -282
- pyretailscience-0.3.2/pyretailscience/style/graph_utils.py +0 -128
- {pyretailscience-0.3.2 → pyretailscience-0.4.0}/LICENSE +0 -0
- {pyretailscience-0.3.2 → pyretailscience-0.4.0}/pyretailscience/__init__.py +0 -0
- {pyretailscience-0.3.2 → pyretailscience-0.4.0}/pyretailscience/assets/fonts/Poppins-Bold.ttf +0 -0
- {pyretailscience-0.3.2 → pyretailscience-0.4.0}/pyretailscience/assets/fonts/Poppins-LightItalic.ttf +0 -0
- {pyretailscience-0.3.2 → pyretailscience-0.4.0}/pyretailscience/assets/fonts/Poppins-Medium.ttf +0 -0
- {pyretailscience-0.3.2 → pyretailscience-0.4.0}/pyretailscience/assets/fonts/Poppins-Regular.ttf +0 -0
- {pyretailscience-0.3.2 → pyretailscience-0.4.0}/pyretailscience/assets/fonts/Poppins-SemiBold.ttf +0 -0
- {pyretailscience-0.3.2/pyretailscience/data → pyretailscience-0.4.0/pyretailscience/plots}/__init__.py +0 -0
|
@@ -0,0 +1,221 @@
|
|
|
1
|
+
Metadata-Version: 2.3
|
|
2
|
+
Name: pyretailscience
|
|
3
|
+
Version: 0.4.0
|
|
4
|
+
Summary: Retail Data Science Tools
|
|
5
|
+
License: Elastic-2.0
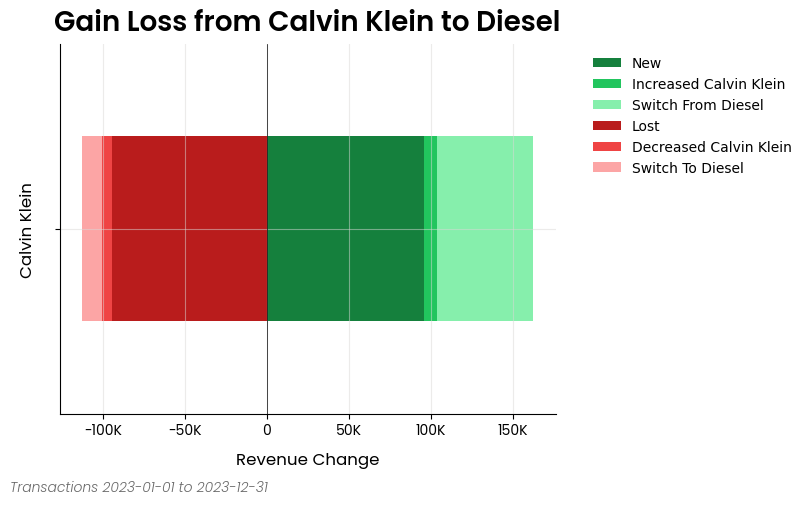
|
|
6
|
+
Author: Murray Vanwyk
|
|
7
|
+
Author-email: 2493311+mvanwyk@users.noreply.github.com
|
|
8
|
+
Requires-Python: >=3.10,<3.13
|
|
9
|
+
Classifier: License :: Other/Proprietary License
|
|
10
|
+
Classifier: Programming Language :: Python :: 3
|
|
11
|
+
Classifier: Programming Language :: Python :: 3.10
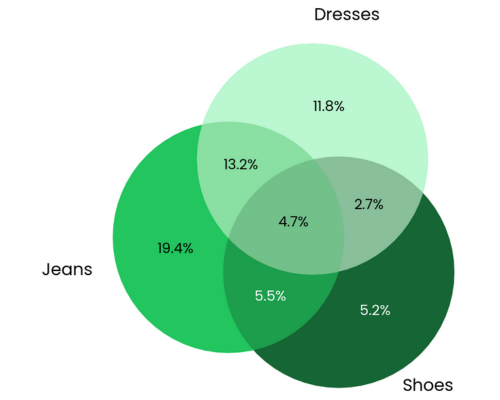
|
|
12
|
+
Classifier: Programming Language :: Python :: 3.11
|
|
13
|
+
Classifier: Programming Language :: Python :: 3.12
|
|
14
|
+
Requires-Dist: duckdb (>=1.0.0,<2.0.0)
|
|
15
|
+
Requires-Dist: graphviz (>=0.20.3,<0.21.0)
|
|
16
|
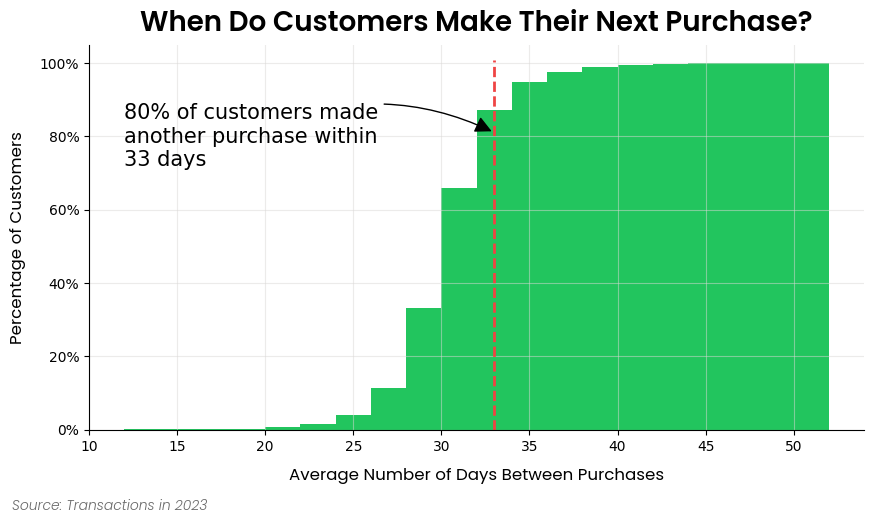
+
Requires-Dist: ibis-framework[duckdb] (>=9.5.0,<10.0.0)
|
|
17
|
+
Requires-Dist: loguru (>=0.7.2,<0.8.0)
|
|
18
|
+
Requires-Dist: matplotlib (>=3.9.1,<4.0.0)
|
|
19
|
+
Requires-Dist: matplotlib-set-diagrams (>=0.0.2,<0.1.0)
|
|
20
|
+
Requires-Dist: numpy (>=1.26.3,<2.0.0)
|
|
21
|
+
Requires-Dist: pandas (>=2.1.4,<3.0.0)
|
|
22
|
+
Requires-Dist: pyarrow (>=14.0.2,<15.0.0)
|
|
23
|
+
Requires-Dist: scikit-learn (>=1.4.2,<2.0.0)
|
|
24
|
+
Requires-Dist: scipy (>=1.13.0,<2.0.0)
|
|
25
|
+
Requires-Dist: toml (>=0.10.2,<0.11.0)
|
|
26
|
+
Requires-Dist: tqdm (>=4.66.1,<5.0.0)
|
|
27
|
+
Description-Content-Type: text/markdown
|
|
28
|
+
|
|
29
|
+

|
|
30
|
+
|
|
31
|
+
# PyRetailScience
|
|
32
|
+
|
|
33
|
+
⚡ Rapid bespoke and deep dive retail analytics ⚡
|
|
34
|
+
|
|
35
|
+
PyRetailScience equips you with a wide array of retail analytical capabilities, from segmentations to gain-loss analysis. Leave the mundane to us and elevate your role from data janitor to insights virtuoso.
|
|
36
|
+
|
|
37
|
+
## Installation
|
|
38
|
+
|
|
39
|
+
To get the latest release:
|
|
40
|
+
|
|
41
|
+
```bash
|
|
42
|
+
pip install pyretailscience
|
|
43
|
+
```
|
|
44
|
+
|
|
45
|
+
Alternatively, if you want the very latest version of the package you can install it from GitHub:
|
|
46
|
+
|
|
47
|
+
```bash
|
|
48
|
+
pip install git+https://github.com/Data-Simply/pyretailscience.git
|
|
49
|
+
```
|
|
50
|
+
|
|
51
|
+
## Features
|
|
52
|
+
|
|
53
|
+
- **Tailored for Retail**: Leverage pre-built functions designed specifically for retail analytics. From customer segmentations to gains loss analysis, PyRetailScience provides over a dozen building blocks you need to tackle retail-specific challenges efficiently and effectively.
|
|
54
|
+
|
|
55
|
+
|
|
56
|
+
|
|
57
|
+
- **Reliable Results**: Built with extensive unit testing and best practices, PyRetailScience ensures the accuracy and reliability of your analyses. Confidently present your findings, knowing they're backed by a robust, well-tested framework.
|
|
58
|
+
|
|
59
|
+
- **Professional Charts**: Say goodbye to hours of tweaking chart styles. PyRetailScience delivers beautifully standardized visualizations that are presentation-ready with just a few lines of code. Impress stakeholders and save time with our pre-built, customizable chart templates.
|
|
60
|
+
|
|
61
|
+
|
|
62
|
+
|
|
63
|
+
- **Workflow Automation**: PyRetailScience streamlines your workflow by automating common retail analytics tasks. Easily loop analyses over different dimensions like product categories or countries, and seamlessly use the output of one analysis as input for another. Spend less time on data manipulation and more on generating valuable insights.
|
|
64
|
+
|
|
65
|
+
## Examples
|
|
66
|
+
|
|
67
|
+
### Gains Loss Analysis
|
|
68
|
+
|
|
69
|
+
Here is an excerpt from the gain loss analysis example [notebook](https://pyretailscience.datasimply.co/examples/gain_loss/)
|
|
70
|
+
|
|
71
|
+
```python
|
|
72
|
+
from pyretailscience.gain_loss import GainLoss
|
|
73
|
+
|
|
74
|
+
gl = GainLoss(
|
|
75
|
+
df,
|
|
76
|
+
# Flag the rows of period 1
|
|
77
|
+
p1_index=time_period_1,
|
|
78
|
+
# Flag the rows of period 2
|
|
79
|
+
p2_index=time_period_2,
|
|
80
|
+
# Flag which rows are part of the focus group.
|
|
81
|
+
# Namely, which rows are Calvin Klein sales
|
|
82
|
+
focus_group_index=df["brand_name"] == "Calvin Klein",
|
|
83
|
+
focus_group_name="Calvin Klein",
|
|
84
|
+
# Flag which rows are part of the comparison group.
|
|
85
|
+
# Namely, which rows are Diesel sales
|
|
86
|
+
comparison_group_index=df["brand_name"] == "Diesel",
|
|
87
|
+
comparison_group_name="Diesel",
|
|
88
|
+
# Finally we specifiy that we want to calculate
|
|
89
|
+
# the gain/loss in total revenue
|
|
90
|
+
value_col="total_price",
|
|
91
|
+
)
|
|
92
|
+
# Ok now let's plot the result
|
|
93
|
+
gl.plot(
|
|
94
|
+
x_label="Revenue Change",
|
|
95
|
+
source_text="Transactions 2023-01-01 to 2023-12-31",
|
|
96
|
+
move_legend_outside=True,
|
|
97
|
+
)
|
|
98
|
+
plt.show()
|
|
99
|
+
```
|
|
100
|
+
|
|
101
|
+
|
|
102
|
+
|
|
103
|
+
### Cross Shop Analysis
|
|
104
|
+
|
|
105
|
+
Here is an excerpt from the cross shop analysis example [notebook](https://pyretailscience.datasimply.co/examples/cross_shop/)
|
|
106
|
+
|
|
107
|
+
```python
|
|
108
|
+
from pyretailscience import cross_shop
|
|
109
|
+
|
|
110
|
+
cs = cross_shop.CrossShop(
|
|
111
|
+
df,
|
|
112
|
+
group_1_idx=df["category_1_name"] == "Jeans",
|
|
113
|
+
group_2_idx=df["category_1_name"] == "Shoes",
|
|
114
|
+
group_3_idx=df["category_1_name"] == "Dresses",
|
|
115
|
+
labels=["Jeans", "Shoes", "Dresses"],
|
|
116
|
+
)
|
|
117
|
+
cs.plot(
|
|
118
|
+
title="Jeans are a popular cross-shopping category with dresses",
|
|
119
|
+
source_text="Source: Transactions 2023-01-01 to 2023-12-31",
|
|
120
|
+
figsize=(6, 6),
|
|
121
|
+
)
|
|
122
|
+
plt.show()
|
|
123
|
+
# Let's see which customers were in which groups
|
|
124
|
+
display(cs.cross_shop_df.head())
|
|
125
|
+
# And the totals for all groups
|
|
126
|
+
display(cs.cross_shop_table_df)
|
|
127
|
+
```
|
|
128
|
+
|
|
129
|
+

|
|
130
|
+
|
|
131
|
+
### Customer Retention Analysis
|
|
132
|
+
|
|
133
|
+
Here is an excerpt from the customer retention analysis example [notebook](https://pyretailscience.datasimply.co/examples/retention/)
|
|
134
|
+
|
|
135
|
+
```python
|
|
136
|
+
ax = dbp.plot(
|
|
137
|
+
figsize=(10, 5),
|
|
138
|
+
bins=20,
|
|
139
|
+
cumlative=True,
|
|
140
|
+
draw_percentile_line=True,
|
|
141
|
+
percentile_line=0.8,
|
|
142
|
+
source_text="Source: Transactions in 2023",
|
|
143
|
+
title="When Do Customers Make Their Next Purchase?",
|
|
144
|
+
)
|
|
145
|
+
|
|
146
|
+
# Let's dress up the chart a bit of text and get rid of the legend
|
|
147
|
+
churn_period = dbp.purchases_percentile(0.8)
|
|
148
|
+
ax.annotate(
|
|
149
|
+
f"80% of customers made\nanother purchase within\n{round(churn_period)} days",
|
|
150
|
+
xy=(churn_period, 0.81),
|
|
151
|
+
xytext=(dbp.purchase_dist_s.min(), 0.8),
|
|
152
|
+
fontsize=15,
|
|
153
|
+
ha="left",
|
|
154
|
+
va="center",
|
|
155
|
+
arrowprops=dict(facecolor="black", arrowstyle="-|>", connectionstyle="arc3,rad=-0.25", mutation_scale=25),
|
|
156
|
+
)
|
|
157
|
+
ax.legend().set_visible(False)
|
|
158
|
+
plt.show()
|
|
159
|
+
```
|
|
160
|
+
|
|
161
|
+
|
|
162
|
+
|
|
163
|
+
## Documentation
|
|
164
|
+
|
|
165
|
+
Please see [here](https://pyretailscience.datasimply.co/) for full documentation, which includes:
|
|
166
|
+
|
|
167
|
+
- [Analysis Modules](https://pyretailscience.datasimply.co/analysis_modules/): Overview of the framework and the structure of the docs.
|
|
168
|
+
- [Examples](https://pyretailscience.datasimply.co/examples/retention/): If you're looking to build something specific or are more of a hands-on learner, check out our examples. This is the best place to get started.
|
|
169
|
+
- [API Reference](https://pyretailscience.datasimply.co/api/gain_loss/): Thorough documentation of every class and method.
|
|
170
|
+
|
|
171
|
+
## Contributing
|
|
172
|
+
|
|
173
|
+
We welcome contributions from the community to enhance and improve PyRetailScience. To contribute, please follow these steps:
|
|
174
|
+
|
|
175
|
+
1. Fork the repository.
|
|
176
|
+
2. Create a new branch for your feature or bug fix.
|
|
177
|
+
3. Make your changes and commit them with clear messages.
|
|
178
|
+
4. Push your changes to your fork.
|
|
179
|
+
5. Open a pull request to the main repository's `main` branch.
|
|
180
|
+
|
|
181
|
+
Please make sure to follow the existing coding style and provide unit tests for new features.
|
|
182
|
+
|
|
183
|
+
## Contact / Support
|
|
184
|
+
|
|
185
|
+
This repository is supported by Data simply.
|
|
186
|
+
|
|
187
|
+
If you are interested in seeing what Data Simply can do for you, then please email [email us](mailto:murray@datasimply.co).
|
|
188
|
+
We work with companies at a variety of scales and with varying levels of data and retail analytics sophistication, to
|
|
189
|
+
help them build, scale or streamline their analysis capabilities.
|
|
190
|
+
|
|
191
|
+
## Contributors
|
|
192
|
+
|
|
193
|
+
<a href="https://github.com/Data-Simply/pyretailscience/graphs/contributors">
|
|
194
|
+
<img src="https://contrib.rocks/image?repo=Data-Simply/pyretailscience" />
|
|
195
|
+
</a>
|
|
196
|
+
|
|
197
|
+
Made with [contrib.rocks](https://contrib.rocks).
|
|
198
|
+
|
|
199
|
+
## Acknowledgements
|
|
200
|
+
|
|
201
|
+
Built with expertise doing analytics and data science for scale-ups to multi-nationals, including:
|
|
202
|
+
|
|
203
|
+
- Loblaws
|
|
204
|
+
- Dominos
|
|
205
|
+
- Sainbury's
|
|
206
|
+
- IKI
|
|
207
|
+
- Migros
|
|
208
|
+
- Sephora
|
|
209
|
+
- Nectar
|
|
210
|
+
- Metro
|
|
211
|
+
- Coles
|
|
212
|
+
- GANNI
|
|
213
|
+
- Mindful Chef
|
|
214
|
+
- Auchan
|
|
215
|
+
- Attraction Tickets Direct
|
|
216
|
+
- Roman Originals
|
|
217
|
+
|
|
218
|
+
## License
|
|
219
|
+
|
|
220
|
+
This project is licensed under the Elastic License 2.0 - see the [LICENSE](LICENSE) file for details.
|
|
221
|
+
|
|
@@ -0,0 +1,192 @@
|
|
|
1
|
+

|
|
2
|
+
|
|
3
|
+
# PyRetailScience
|
|
4
|
+
|
|
5
|
+
⚡ Rapid bespoke and deep dive retail analytics ⚡
|
|
6
|
+
|
|
7
|
+
PyRetailScience equips you with a wide array of retail analytical capabilities, from segmentations to gain-loss analysis. Leave the mundane to us and elevate your role from data janitor to insights virtuoso.
|
|
8
|
+
|
|
9
|
+
## Installation
|
|
10
|
+
|
|
11
|
+
To get the latest release:
|
|
12
|
+
|
|
13
|
+
```bash
|
|
14
|
+
pip install pyretailscience
|
|
15
|
+
```
|
|
16
|
+
|
|
17
|
+
Alternatively, if you want the very latest version of the package you can install it from GitHub:
|
|
18
|
+
|
|
19
|
+
```bash
|
|
20
|
+
pip install git+https://github.com/Data-Simply/pyretailscience.git
|
|
21
|
+
```
|
|
22
|
+
|
|
23
|
+
## Features
|
|
24
|
+
|
|
25
|
+
- **Tailored for Retail**: Leverage pre-built functions designed specifically for retail analytics. From customer segmentations to gains loss analysis, PyRetailScience provides over a dozen building blocks you need to tackle retail-specific challenges efficiently and effectively.
|
|
26
|
+
|
|
27
|
+

|
|
28
|
+
|
|
29
|
+
- **Reliable Results**: Built with extensive unit testing and best practices, PyRetailScience ensures the accuracy and reliability of your analyses. Confidently present your findings, knowing they're backed by a robust, well-tested framework.
|
|
30
|
+
|
|
31
|
+
- **Professional Charts**: Say goodbye to hours of tweaking chart styles. PyRetailScience delivers beautifully standardized visualizations that are presentation-ready with just a few lines of code. Impress stakeholders and save time with our pre-built, customizable chart templates.
|
|
32
|
+
|
|
33
|
+

|
|
34
|
+
|
|
35
|
+
- **Workflow Automation**: PyRetailScience streamlines your workflow by automating common retail analytics tasks. Easily loop analyses over different dimensions like product categories or countries, and seamlessly use the output of one analysis as input for another. Spend less time on data manipulation and more on generating valuable insights.
|
|
36
|
+
|
|
37
|
+
## Examples
|
|
38
|
+
|
|
39
|
+
### Gains Loss Analysis
|
|
40
|
+
|
|
41
|
+
Here is an excerpt from the gain loss analysis example [notebook](https://pyretailscience.datasimply.co/examples/gain_loss/)
|
|
42
|
+
|
|
43
|
+
```python
|
|
44
|
+
from pyretailscience.gain_loss import GainLoss
|
|
45
|
+
|
|
46
|
+
gl = GainLoss(
|
|
47
|
+
df,
|
|
48
|
+
# Flag the rows of period 1
|
|
49
|
+
p1_index=time_period_1,
|
|
50
|
+
# Flag the rows of period 2
|
|
51
|
+
p2_index=time_period_2,
|
|
52
|
+
# Flag which rows are part of the focus group.
|
|
53
|
+
# Namely, which rows are Calvin Klein sales
|
|
54
|
+
focus_group_index=df["brand_name"] == "Calvin Klein",
|
|
55
|
+
focus_group_name="Calvin Klein",
|
|
56
|
+
# Flag which rows are part of the comparison group.
|
|
57
|
+
# Namely, which rows are Diesel sales
|
|
58
|
+
comparison_group_index=df["brand_name"] == "Diesel",
|
|
59
|
+
comparison_group_name="Diesel",
|
|
60
|
+
# Finally we specifiy that we want to calculate
|
|
61
|
+
# the gain/loss in total revenue
|
|
62
|
+
value_col="total_price",
|
|
63
|
+
)
|
|
64
|
+
# Ok now let's plot the result
|
|
65
|
+
gl.plot(
|
|
66
|
+
x_label="Revenue Change",
|
|
67
|
+
source_text="Transactions 2023-01-01 to 2023-12-31",
|
|
68
|
+
move_legend_outside=True,
|
|
69
|
+
)
|
|
70
|
+
plt.show()
|
|
71
|
+
```
|
|
72
|
+
|
|
73
|
+

|
|
74
|
+
|
|
75
|
+
### Cross Shop Analysis
|
|
76
|
+
|
|
77
|
+
Here is an excerpt from the cross shop analysis example [notebook](https://pyretailscience.datasimply.co/examples/cross_shop/)
|
|
78
|
+
|
|
79
|
+
```python
|
|
80
|
+
from pyretailscience import cross_shop
|
|
81
|
+
|
|
82
|
+
cs = cross_shop.CrossShop(
|
|
83
|
+
df,
|
|
84
|
+
group_1_idx=df["category_1_name"] == "Jeans",
|
|
85
|
+
group_2_idx=df["category_1_name"] == "Shoes",
|
|
86
|
+
group_3_idx=df["category_1_name"] == "Dresses",
|
|
87
|
+
labels=["Jeans", "Shoes", "Dresses"],
|
|
88
|
+
)
|
|
89
|
+
cs.plot(
|
|
90
|
+
title="Jeans are a popular cross-shopping category with dresses",
|
|
91
|
+
source_text="Source: Transactions 2023-01-01 to 2023-12-31",
|
|
92
|
+
figsize=(6, 6),
|
|
93
|
+
)
|
|
94
|
+
plt.show()
|
|
95
|
+
# Let's see which customers were in which groups
|
|
96
|
+
display(cs.cross_shop_df.head())
|
|
97
|
+
# And the totals for all groups
|
|
98
|
+
display(cs.cross_shop_table_df)
|
|
99
|
+
```
|
|
100
|
+
|
|
101
|
+

|
|
102
|
+
|
|
103
|
+
### Customer Retention Analysis
|
|
104
|
+
|
|
105
|
+
Here is an excerpt from the customer retention analysis example [notebook](https://pyretailscience.datasimply.co/examples/retention/)
|
|
106
|
+
|
|
107
|
+
```python
|
|
108
|
+
ax = dbp.plot(
|
|
109
|
+
figsize=(10, 5),
|
|
110
|
+
bins=20,
|
|
111
|
+
cumlative=True,
|
|
112
|
+
draw_percentile_line=True,
|
|
113
|
+
percentile_line=0.8,
|
|
114
|
+
source_text="Source: Transactions in 2023",
|
|
115
|
+
title="When Do Customers Make Their Next Purchase?",
|
|
116
|
+
)
|
|
117
|
+
|
|
118
|
+
# Let's dress up the chart a bit of text and get rid of the legend
|
|
119
|
+
churn_period = dbp.purchases_percentile(0.8)
|
|
120
|
+
ax.annotate(
|
|
121
|
+
f"80% of customers made\nanother purchase within\n{round(churn_period)} days",
|
|
122
|
+
xy=(churn_period, 0.81),
|
|
123
|
+
xytext=(dbp.purchase_dist_s.min(), 0.8),
|
|
124
|
+
fontsize=15,
|
|
125
|
+
ha="left",
|
|
126
|
+
va="center",
|
|
127
|
+
arrowprops=dict(facecolor="black", arrowstyle="-|>", connectionstyle="arc3,rad=-0.25", mutation_scale=25),
|
|
128
|
+
)
|
|
129
|
+
ax.legend().set_visible(False)
|
|
130
|
+
plt.show()
|
|
131
|
+
```
|
|
132
|
+
|
|
133
|
+

|
|
134
|
+
|
|
135
|
+
## Documentation
|
|
136
|
+
|
|
137
|
+
Please see [here](https://pyretailscience.datasimply.co/) for full documentation, which includes:
|
|
138
|
+
|
|
139
|
+
- [Analysis Modules](https://pyretailscience.datasimply.co/analysis_modules/): Overview of the framework and the structure of the docs.
|
|
140
|
+
- [Examples](https://pyretailscience.datasimply.co/examples/retention/): If you're looking to build something specific or are more of a hands-on learner, check out our examples. This is the best place to get started.
|
|
141
|
+
- [API Reference](https://pyretailscience.datasimply.co/api/gain_loss/): Thorough documentation of every class and method.
|
|
142
|
+
|
|
143
|
+
## Contributing
|
|
144
|
+
|
|
145
|
+
We welcome contributions from the community to enhance and improve PyRetailScience. To contribute, please follow these steps:
|
|
146
|
+
|
|
147
|
+
1. Fork the repository.
|
|
148
|
+
2. Create a new branch for your feature or bug fix.
|
|
149
|
+
3. Make your changes and commit them with clear messages.
|
|
150
|
+
4. Push your changes to your fork.
|
|
151
|
+
5. Open a pull request to the main repository's `main` branch.
|
|
152
|
+
|
|
153
|
+
Please make sure to follow the existing coding style and provide unit tests for new features.
|
|
154
|
+
|
|
155
|
+
## Contact / Support
|
|
156
|
+
|
|
157
|
+
This repository is supported by Data simply.
|
|
158
|
+
|
|
159
|
+
If you are interested in seeing what Data Simply can do for you, then please email [email us](mailto:murray@datasimply.co).
|
|
160
|
+
We work with companies at a variety of scales and with varying levels of data and retail analytics sophistication, to
|
|
161
|
+
help them build, scale or streamline their analysis capabilities.
|
|
162
|
+
|
|
163
|
+
## Contributors
|
|
164
|
+
|
|
165
|
+
<a href="https://github.com/Data-Simply/pyretailscience/graphs/contributors">
|
|
166
|
+
<img src="https://contrib.rocks/image?repo=Data-Simply/pyretailscience" />
|
|
167
|
+
</a>
|
|
168
|
+
|
|
169
|
+
Made with [contrib.rocks](https://contrib.rocks).
|
|
170
|
+
|
|
171
|
+
## Acknowledgements
|
|
172
|
+
|
|
173
|
+
Built with expertise doing analytics and data science for scale-ups to multi-nationals, including:
|
|
174
|
+
|
|
175
|
+
- Loblaws
|
|
176
|
+
- Dominos
|
|
177
|
+
- Sainbury's
|
|
178
|
+
- IKI
|
|
179
|
+
- Migros
|
|
180
|
+
- Sephora
|
|
181
|
+
- Nectar
|
|
182
|
+
- Metro
|
|
183
|
+
- Coles
|
|
184
|
+
- GANNI
|
|
185
|
+
- Mindful Chef
|
|
186
|
+
- Auchan
|
|
187
|
+
- Attraction Tickets Direct
|
|
188
|
+
- Roman Originals
|
|
189
|
+
|
|
190
|
+
## License
|
|
191
|
+
|
|
192
|
+
This project is licensed under the Elastic License 2.0 - see the [LICENSE](LICENSE) file for details.
|
|
@@ -0,0 +1,151 @@
|
|
|
1
|
+
[tool.poetry]
|
|
2
|
+
name = "pyretailscience"
|
|
3
|
+
version = "0.4.0"
|
|
4
|
+
description = "Retail Data Science Tools"
|
|
5
|
+
authors = ["Murray Vanwyk <2493311+mvanwyk@users.noreply.github.com>"]
|
|
6
|
+
readme = "README.md"
|
|
7
|
+
license = "Elastic-2.0"
|
|
8
|
+
|
|
9
|
+
[tool.poetry.dependencies]
|
|
10
|
+
python = ">=3.10,<3.13"
|
|
11
|
+
pandas = "^2.1.4"
|
|
12
|
+
pyarrow = "^14.0.2"
|
|
13
|
+
matplotlib = "^3.9.1"
|
|
14
|
+
numpy = "^1.26.3"
|
|
15
|
+
loguru = "^0.7.2"
|
|
16
|
+
tqdm = "^4.66.1"
|
|
17
|
+
scipy = "^1.13.0"
|
|
18
|
+
scikit-learn = "^1.4.2"
|
|
19
|
+
matplotlib-set-diagrams = "~0.0.2"
|
|
20
|
+
toml = "^0.10.2"
|
|
21
|
+
duckdb = "^1.0.0"
|
|
22
|
+
graphviz = "^0.20.3"
|
|
23
|
+
ibis-framework = {extras = ["duckdb"], version = "^9.5.0"}
|
|
24
|
+
|
|
25
|
+
[tool.poetry.group.dev.dependencies]
|
|
26
|
+
pytest = "^8.0.0"
|
|
27
|
+
pytest-cov = "^4.1.0"
|
|
28
|
+
nbstripout = "^0.7.1"
|
|
29
|
+
ruff = "^0.4.8"
|
|
30
|
+
pre-commit ="^3.6.2"
|
|
31
|
+
pytest-mock = "^3.14.0"
|
|
32
|
+
|
|
33
|
+
[tool.poetry.group.examples.dependencies]
|
|
34
|
+
jupyterlab = "^4.2.5"
|
|
35
|
+
tqdm = "^4.66.1"
|
|
36
|
+
|
|
37
|
+
[tool.poetry.group.docs.dependencies]
|
|
38
|
+
mkdocs-material = "^9.5.4"
|
|
39
|
+
mkdocstrings = {extras = ["python"], version = "^0.24.0"}
|
|
40
|
+
mkdocs = "^1.5.3"
|
|
41
|
+
mkdocs-jupyter = "^0.24.6"
|
|
42
|
+
|
|
43
|
+
[build-system]
|
|
44
|
+
requires = ["poetry-core"]
|
|
45
|
+
build-backend = "poetry.core.masonry.api"
|
|
46
|
+
|
|
47
|
+
[tool.pytest.ini_options]
|
|
48
|
+
addopts = "--cov=pyretailscience --cov-report=term-missing --cov-branch"
|
|
49
|
+
|
|
50
|
+
[tool.coverage.run]
|
|
51
|
+
branch = true
|
|
52
|
+
source = ["pyretailscience"]
|
|
53
|
+
|
|
54
|
+
[tool.coverage.report]
|
|
55
|
+
show_missing = true
|
|
56
|
+
skip_covered = true
|
|
57
|
+
|
|
58
|
+
[tool.ruff]
|
|
59
|
+
target-version = "py310"
|
|
60
|
+
line-length=120
|
|
61
|
+
show-fixes = true
|
|
62
|
+
|
|
63
|
+
[tool.ruff.lint]
|
|
64
|
+
ignore = [
|
|
65
|
+
"ANN101",
|
|
66
|
+
"ANN102",
|
|
67
|
+
"EM101",
|
|
68
|
+
"TRY003", # Disable until we start creating proper exception classes
|
|
69
|
+
"PT011", # Disable until we start creating proper exception classes
|
|
70
|
+
"PTH123", # Not using open() to open files
|
|
71
|
+
"SLF001", # Ibis makes a lot of use of the ibis._[column] which triggers this
|
|
72
|
+
]
|
|
73
|
+
select = [
|
|
74
|
+
"A", # Builtins
|
|
75
|
+
"ANN", # Annotations
|
|
76
|
+
"ARG", # Unused arguments
|
|
77
|
+
"B", # Bugbear
|
|
78
|
+
"BLE", # Blind except
|
|
79
|
+
"C4", # Comprehensions
|
|
80
|
+
"C90", # mccabe
|
|
81
|
+
"COM", # Commas
|
|
82
|
+
"D", # Pydocstyle
|
|
83
|
+
"D1", # Undocumented public elements
|
|
84
|
+
"D2", # Docstring conventions
|
|
85
|
+
"D3", # Triple double quotes
|
|
86
|
+
"D4", # Docstring text format
|
|
87
|
+
"DTZ", # Datetimes
|
|
88
|
+
"EM", # Error messages
|
|
89
|
+
"ERA", # Commented-out code
|
|
90
|
+
"EXE", # Executable
|
|
91
|
+
"F", # Pyflakes
|
|
92
|
+
"FA", # __future__ annotations
|
|
93
|
+
"FLY", # F-strings
|
|
94
|
+
"G", # Logging format
|
|
95
|
+
"I", # Isort
|
|
96
|
+
"ICN", # Import conventions
|
|
97
|
+
"INP", # Disallow PEP-420 (Implicit namespace packages)
|
|
98
|
+
"INT", # gettext
|
|
99
|
+
"ISC", # Implicit str concat
|
|
100
|
+
"N", # PEP-8 Naming
|
|
101
|
+
"NPY", # Numpy
|
|
102
|
+
"PERF", # Unnecessary performance costs
|
|
103
|
+
"PGH", # Pygrep hooks
|
|
104
|
+
"PIE", # Unnecessary code
|
|
105
|
+
"PL", # Pylint
|
|
106
|
+
"PT", # Pytest
|
|
107
|
+
"PTH", # Use Pathlib
|
|
108
|
+
"PYI", # Stub files
|
|
109
|
+
"Q", # Quotes
|
|
110
|
+
"RET", # Return
|
|
111
|
+
"RUF", # Ruff
|
|
112
|
+
"RSE", # Raise
|
|
113
|
+
"S", # Bandit
|
|
114
|
+
"SIM", # Code simplification
|
|
115
|
+
"SLF", # Private member access
|
|
116
|
+
"SLOT", # __slots__
|
|
117
|
+
"T10", # Debugger
|
|
118
|
+
"T20", # Print
|
|
119
|
+
"TCH", # Type checking
|
|
120
|
+
"TID", # Tidy imports
|
|
121
|
+
"TRY", # Exception handling
|
|
122
|
+
"UP", # Pyupgrade
|
|
123
|
+
"W", # Warnings
|
|
124
|
+
"YTT", # sys.version
|
|
125
|
+
]
|
|
126
|
+
|
|
127
|
+
|
|
128
|
+
[tool.ruff.lint.per-file-ignores]
|
|
129
|
+
# https://beta.ruff.rs/docs/rules/
|
|
130
|
+
"__init__.py" = ["F401", "F403", "F405", "D104"]
|
|
131
|
+
"tests/*" = ["ANN", "ARG", "INP001", "S101", "SLF001"]
|
|
132
|
+
"*.ipynb" = ["T201"]
|
|
133
|
+
|
|
134
|
+
[tool.ruff.lint.pylint]
|
|
135
|
+
max-args = 15
|
|
136
|
+
max-branches = 20
|
|
137
|
+
max-returns = 10
|
|
138
|
+
max-statements = 80
|
|
139
|
+
|
|
140
|
+
[tool.ruff.lint.flake8-tidy-imports]
|
|
141
|
+
ban-relative-imports = "all"
|
|
142
|
+
|
|
143
|
+
[tool.ruff.lint.flake8-quotes]
|
|
144
|
+
docstring-quotes = "double"
|
|
145
|
+
multiline-quotes = "double"
|
|
146
|
+
|
|
147
|
+
[tool.ruff.lint.mccabe]
|
|
148
|
+
max-complexity = 10
|
|
149
|
+
|
|
150
|
+
[tool.ruff.lint.pydocstyle]
|
|
151
|
+
convention = "google"
|