pyredshift 1.9__tar.gz
This diff represents the content of publicly available package versions that have been released to one of the supported registries. The information contained in this diff is provided for informational purposes only and reflects changes between package versions as they appear in their respective public registries.
- pyredshift-1.9/LICENSE +21 -0
- pyredshift-1.9/PKG-INFO +167 -0
- pyredshift-1.9/README.md +133 -0
- pyredshift-1.9/pyproject.toml +6 -0
- pyredshift-1.9/pyredshift +297 -0
- pyredshift-1.9/setup.cfg +4 -0
- pyredshift-1.9/setup.py +40 -0
- pyredshift-1.9/src/pyredshift/__init__.py +5 -0
- pyredshift-1.9/src/pyredshift/pyredshift-help.html +121 -0
- pyredshift-1.9/src/pyredshift/pyredshift.lines +79 -0
- pyredshift-1.9/src/pyredshift/redshift.py +1581 -0
- pyredshift-1.9/src/pyredshift.egg-info/PKG-INFO +167 -0
- pyredshift-1.9/src/pyredshift.egg-info/SOURCES.txt +14 -0
- pyredshift-1.9/src/pyredshift.egg-info/dependency_links.txt +1 -0
- pyredshift-1.9/src/pyredshift.egg-info/requires.txt +4 -0
- pyredshift-1.9/src/pyredshift.egg-info/top_level.txt +1 -0
pyredshift-1.9/LICENSE
ADDED
|
@@ -0,0 +1,21 @@
|
|
|
1
|
+
MIT License
|
|
2
|
+
|
|
3
|
+
Copyright (c) 2026 Karl Glazebrook
|
|
4
|
+
|
|
5
|
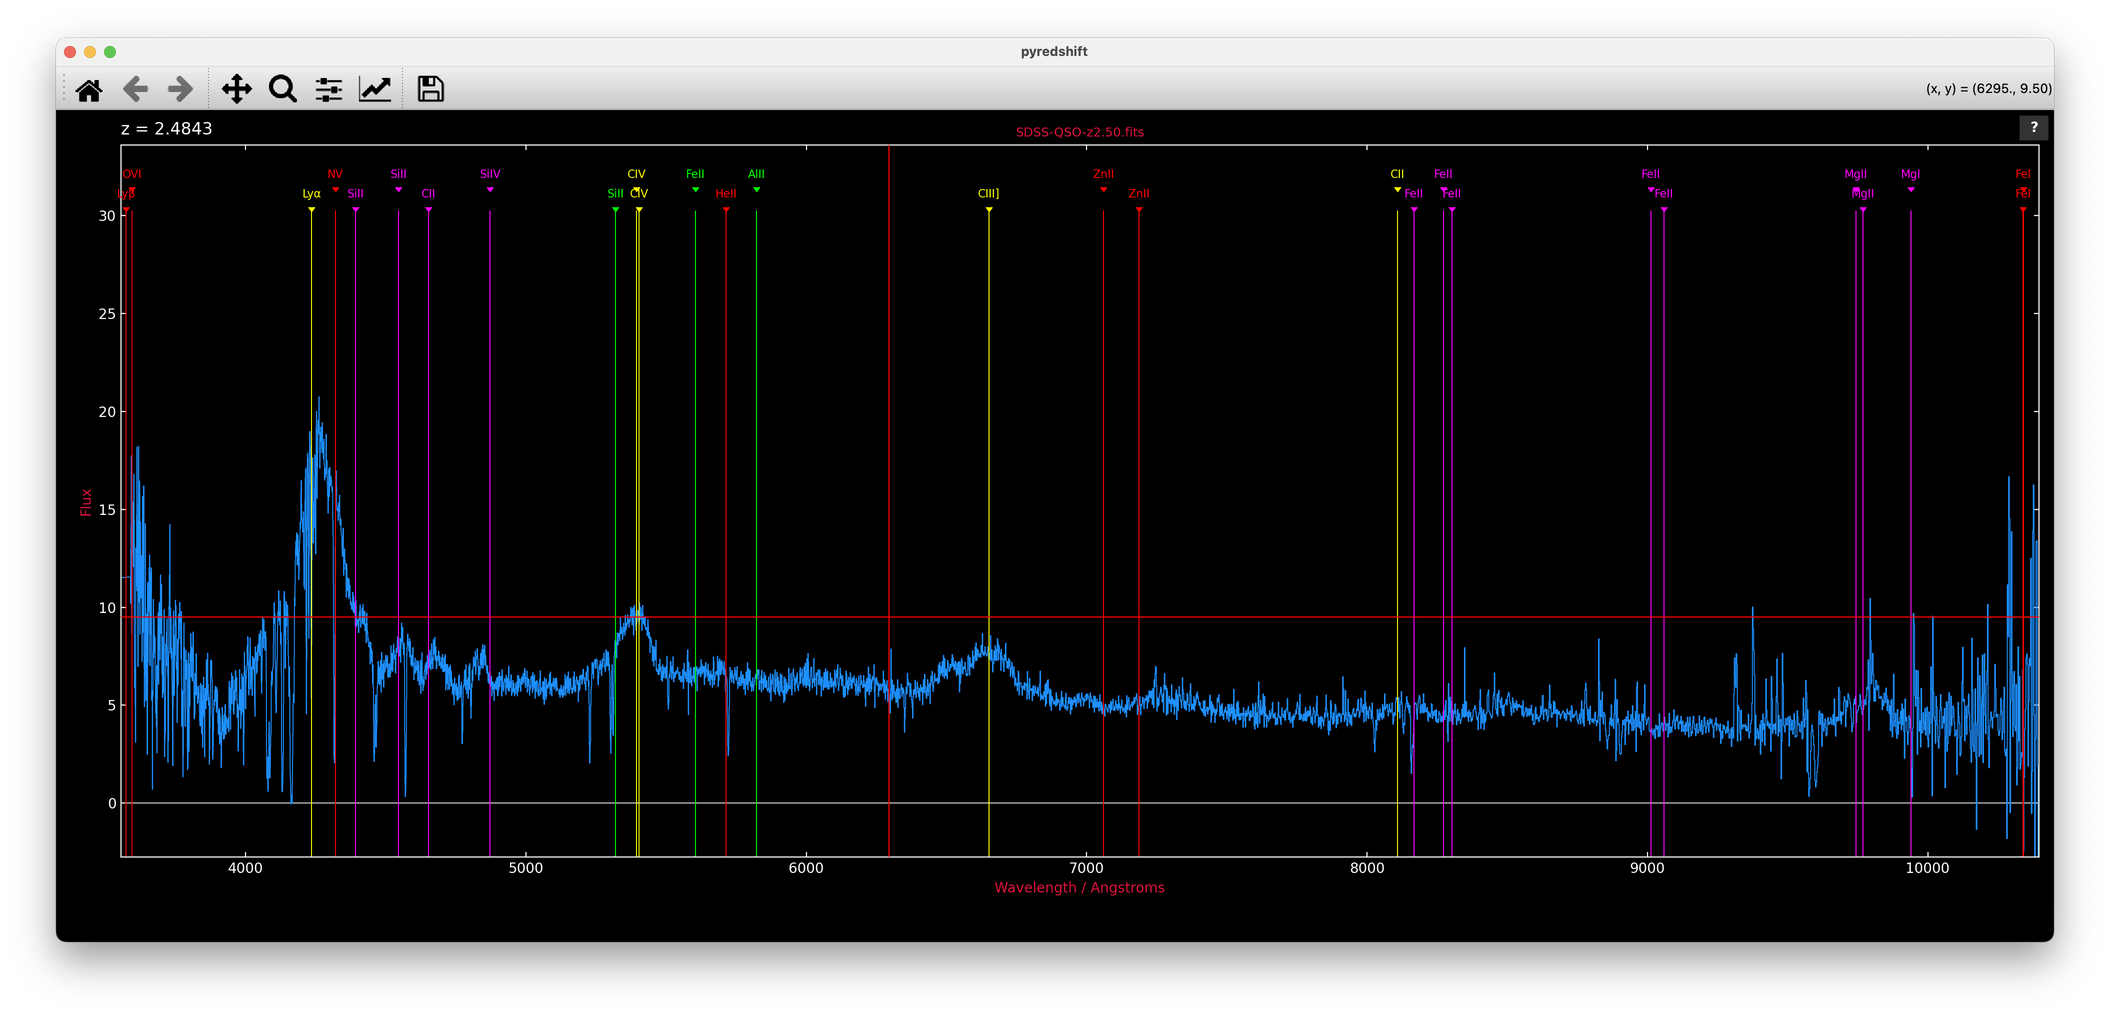
+
Permission is hereby granted, free of charge, to any person obtaining a copy
|
|
6
|
+
of this software and associated documentation files (the "Software"), to deal
|
|
7
|
+
in the Software without restriction, including without limitation the rights
|
|
8
|
+
to use, copy, modify, merge, publish, distribute, sublicense, and/or sell
|
|
9
|
+
copies of the Software, and to permit persons to whom the Software is
|
|
10
|
+
furnished to do so, subject to the following conditions:
|
|
11
|
+
|
|
12
|
+
The above copyright notice and this permission notice shall be included in all
|
|
13
|
+
copies or substantial portions of the Software.
|
|
14
|
+
|
|
15
|
+
THE SOFTWARE IS PROVIDED "AS IS", WITHOUT WARRANTY OF ANY KIND, EXPRESS OR
|
|
16
|
+
IMPLIED, INCLUDING BUT NOT LIMITED TO THE WARRANTIES OF MERCHANTABILITY,
|
|
17
|
+
FITNESS FOR A PARTICULAR PURPOSE AND NONINFRINGEMENT. IN NO EVENT SHALL THE
|
|
18
|
+
AUTHORS OR COPYRIGHT HOLDERS BE LIABLE FOR ANY CLAIM, DAMAGES OR OTHER
|
|
19
|
+
LIABILITY, WHETHER IN AN ACTION OF CONTRACT, TORT OR OTHERWISE, ARISING FROM,
|
|
20
|
+
OUT OF OR IN CONNECTION WITH THE SOFTWARE OR THE USE OR OTHER DEALINGS IN THE
|
|
21
|
+
SOFTWARE.
|
pyredshift-1.9/PKG-INFO
ADDED
|
@@ -0,0 +1,167 @@
|
|
|
1
|
+
Metadata-Version: 2.4
|
|
2
|
+
Name: pyredshift
|
|
3
|
+
Version: 1.9
|
|
4
|
+
Summary: Interactive redshifting of 1D astronomical spectra (Python successor of pdlredshift / redshift.f)
|
|
5
|
+
Home-page: https://github.com/karlglazebrook/pyredshift
|
|
6
|
+
Author: Karl Glazebrook
|
|
7
|
+
License: MIT
|
|
8
|
+
Keywords: astronomy spectroscopy redshift spectra interactive
|
|
9
|
+
Classifier: Development Status :: 5 - Production/Stable
|
|
10
|
+
Classifier: Intended Audience :: Science/Research
|
|
11
|
+
Classifier: Topic :: Scientific/Engineering :: Astronomy
|
|
12
|
+
Classifier: License :: OSI Approved :: MIT License
|
|
13
|
+
Classifier: Programming Language :: Python :: 3
|
|
14
|
+
Classifier: Environment :: MacOS X
|
|
15
|
+
Classifier: Environment :: X11 Applications
|
|
16
|
+
Requires-Python: >=3.9
|
|
17
|
+
Description-Content-Type: text/markdown
|
|
18
|
+
License-File: LICENSE
|
|
19
|
+
Requires-Dist: numpy
|
|
20
|
+
Requires-Dist: matplotlib
|
|
21
|
+
Requires-Dist: astropy
|
|
22
|
+
Requires-Dist: scipy
|
|
23
|
+
Dynamic: author
|
|
24
|
+
Dynamic: classifier
|
|
25
|
+
Dynamic: description
|
|
26
|
+
Dynamic: description-content-type
|
|
27
|
+
Dynamic: home-page
|
|
28
|
+
Dynamic: keywords
|
|
29
|
+
Dynamic: license
|
|
30
|
+
Dynamic: license-file
|
|
31
|
+
Dynamic: requires-dist
|
|
32
|
+
Dynamic: requires-python
|
|
33
|
+
Dynamic: summary
|
|
34
|
+
|
|
35
|
+
# pyredshift
|
|
36
|
+
|
|
37
|
+
Interactive redshifting of 1D astronomical spectra, by eye.
|
|
38
|
+
|
|
39
|
+
`pyredshift` plots a spectrum histogram-style with a full-window crosshair
|
|
40
|
+
cursor and overlays rest-frame line identifications that follow a trial
|
|
41
|
+
redshift. Mark a feature you recognise, and the line labels jump to that
|
|
42
|
+
redshift; refine, zoom, bin, smooth, fit a continuum and measure equivalent
|
|
43
|
+
widths — all from single keypresses. It is the Python descendant of the
|
|
44
|
+
author's venerable `redshift.f` (Fortran/Figaro, 1990s) via `pdlredshift`
|
|
45
|
+
(Perl/PDL/PGPLOT), and deliberately keeps that fast keyboard-driven feel.
|
|
46
|
+
|
|
47
|
+
|
|
48
|
+
|
|
49
|
+
*An SDSS quasar from [Example-Spectra](Example-Spectra/) at z = 2.48 and
|
|
50
|
+
counting, in `--retro` mode: Lyα, CIV and CIII] lined up; the crosshair
|
|
51
|
+
cursor mid-hunt.*
|
|
52
|
+
|
|
53
|
+
## Install
|
|
54
|
+
|
|
55
|
+
```
|
|
56
|
+
pip install git+https://github.com/karlglazebrook/pyredshift
|
|
57
|
+
```
|
|
58
|
+
|
|
59
|
+
or from a checkout:
|
|
60
|
+
|
|
61
|
+
```
|
|
62
|
+
pip install .
|
|
63
|
+
```
|
|
64
|
+
|
|
65
|
+
This installs the `pyredshift` command into the active python's `bin/`
|
|
66
|
+
(e.g. `anaconda3/bin`) and the `pyredshift` package into `site-packages`.
|
|
67
|
+
Requires python ≥ 3.9 with numpy, matplotlib, astropy and scipy.
|
|
68
|
+
|
|
69
|
+
## Usage
|
|
70
|
+
|
|
71
|
+
```
|
|
72
|
+
pyredshift spectrum.fits # format auto-detected
|
|
73
|
+
pyredshift spectrum.fits -f sdss # force a format
|
|
74
|
+
pyredshift spectrum.fits -z 2.19 # start from a known redshift
|
|
75
|
+
pyredshift spectrum.fits --retro # retro PGPLOT-style black background
|
|
76
|
+
pyredshift spectrum.fits --microns # keep micron wavelengths (no A conversion)
|
|
77
|
+
```
|
|
78
|
+
|
|
79
|
+
The file format is auto-detected by inspecting the FITS structure and
|
|
80
|
+
column names/units:
|
|
81
|
+
|
|
82
|
+
| Format | Description |
|
|
83
|
+
|------------|-------------------------------------------------------------------|
|
|
84
|
+
| `fits` | 1D (or 2D — row 1) FITS image with WCS; `CD1_1` overrides `CDELT1`, IRAF/SDSS log-λ flags handled |
|
|
85
|
+
| `sdss` | SDSS binary table (`LOGLAM`/`FLUX`, either case) |
|
|
86
|
+
| `table` | generic binary table with wave+flux columns; `TUNIT` (µm, nm, Å) converted automatically (aliases: `jwst`, `gabe`, `dja`) |
|
|
87
|
+
| `xs` | XSHOOTER 1D table spectrum (nm) |
|
|
88
|
+
| `xs2` | XSHOOTER as a FITS image in extension 1 |
|
|
89
|
+
| `outthere` | OutThere multi-extension grism spectra, stitched and flat-calibrated |
|
|
90
|
+
| `csv` | comma-separated, header rows skipped |
|
|
91
|
+
| `ascii` | 2-column text |
|
|
92
|
+
|
|
93
|
+
Wavelengths that look like microns are converted to Ångstroms; NaNs are
|
|
94
|
+
treated as bad pixels and plot as gaps, with orange markers along the
|
|
95
|
+
bottom of the frame.
|
|
96
|
+
|
|
97
|
+
Real spectra to practice on are included in
|
|
98
|
+
[Example-Spectra](Example-Spectra/) — the true redshifts are hidden in
|
|
99
|
+
their FITS headers.
|
|
100
|
+
|
|
101
|
+
### From a Jupyter notebook
|
|
102
|
+
|
|
103
|
+
The interactive module also works straight from a notebook, given numpy
|
|
104
|
+
arrays:
|
|
105
|
+
|
|
106
|
+
```python
|
|
107
|
+
from pyredshift import redshift as redshift_module
|
|
108
|
+
z = redshift_module.redshift(wave, flux)
|
|
109
|
+
```
|
|
110
|
+
|
|
111
|
+
The interactive window opens *outside* the notebook (inline backends
|
|
112
|
+
cannot deliver events to it) and the cell blocks until you quit with
|
|
113
|
+
`q`; the final annotated view is then embedded in the cell output and
|
|
114
|
+
the redshift returned. Any non-interactive backend (e.g. `%matplotlib
|
|
115
|
+
inline`) is switched to a GUI backend for the session and restored
|
|
116
|
+
afterwards — including if you interrupt the kernel mid-session.
|
|
117
|
+
|
|
118
|
+
**Local kernels only**: the window opens on the machine where the
|
|
119
|
+
kernel runs, so remote kernels (JupyterHub, cloud, ssh without X
|
|
120
|
+
forwarding) cannot work — pyredshift detects this and says so rather
|
|
121
|
+
than hanging or crashing the kernel.
|
|
122
|
+
|
|
123
|
+
## Interaction
|
|
124
|
+
|
|
125
|
+
Press `?` (or click the `?` button) for the full command reference — it
|
|
126
|
+
opens as a themed page in your browser, with the complete line list and a
|
|
127
|
+
short guide in separate tabs. The essentials:
|
|
128
|
+
|
|
129
|
+
- **Identify a line**: put the crosshair on a feature and press `ESC`
|
|
130
|
+
followed by a shortcut key (`a` = Hα, `b` = Hβ, `l` = Lyα, `o` = [OII],
|
|
131
|
+
`c` = CIV ...) — or right-click the feature and pick the line from the
|
|
132
|
+
popup menu, or `g` to type any rest wavelength. Press `ESC ESC` on a
|
|
133
|
+
sharp line to refine the redshift; `=` enters a redshift directly.
|
|
134
|
+
- **Navigate**: drag the mouse for a rubber-band zoom (a purely horizontal
|
|
135
|
+
drag zooms X only), `z`/`u` and `i`/`o` zoom about the cursor, `[` `]`
|
|
136
|
+
pan, `w` whole range, `a` autoscale, `h` home. The matplotlib toolbar
|
|
137
|
+
works too and stays in sync.
|
|
138
|
+
- **Analyse**: `b` bin, `s` smooth, `_` iterative continuum fit,
|
|
139
|
+
`m` equivalent width and line flux, `B` zap artefacts, `p` print to PDF.
|
|
140
|
+
- **Quit**: `q` — the final redshift is reported on the terminal.
|
|
141
|
+
|
|
142
|
+
Line identifications come from `pyredshift.lines` (CSV: wavelength, name,
|
|
143
|
+
label, matplotlib colour, comment — all vacuum wavelengths; a colour may
|
|
144
|
+
be a `light/dark` pair for the two backgrounds), installed
|
|
145
|
+
alongside the module and easy to customise. The window size and aspect
|
|
146
|
+
ratio are remembered between runs in `~/.pyredshift.json`. A template
|
|
147
|
+
spectrum can be overlaid with `t` (searched for in `$DATADIR`,
|
|
148
|
+
`$NEWMODELS/Spectra`, then `~/Templates/Spectra`).
|
|
149
|
+
|
|
150
|
+
## Layout
|
|
151
|
+
|
|
152
|
+
```
|
|
153
|
+
pyredshift the command-line script: format detection and reading
|
|
154
|
+
src/pyredshift/ the interactive module (redshift.py) + data files
|
|
155
|
+
```
|
|
156
|
+
|
|
157
|
+
The script prefers a `src/pyredshift/` found next to it or under the
|
|
158
|
+
current directory, so a development checkout always runs its own code.
|
|
159
|
+
|
|
160
|
+
## Credits
|
|
161
|
+
|
|
162
|
+
Karl Glazebrook, Swinburne University of Technology.
|
|
163
|
+
|
|
164
|
+
Lineage: `redshift.f` (FIGARO/Fortran, ~1992) → `pdlredshift` (Perl/PDL) →
|
|
165
|
+
`pyredshift`. Ported with the assistance of Claude (Anthropic).
|
|
166
|
+
|
|
167
|
+
MIT license — see [LICENSE](LICENSE).
|
pyredshift-1.9/README.md
ADDED
|
@@ -0,0 +1,133 @@
|
|
|
1
|
+
# pyredshift
|
|
2
|
+
|
|
3
|
+
Interactive redshifting of 1D astronomical spectra, by eye.
|
|
4
|
+
|
|
5
|
+
`pyredshift` plots a spectrum histogram-style with a full-window crosshair
|
|
6
|
+
cursor and overlays rest-frame line identifications that follow a trial
|
|
7
|
+
redshift. Mark a feature you recognise, and the line labels jump to that
|
|
8
|
+
redshift; refine, zoom, bin, smooth, fit a continuum and measure equivalent
|
|
9
|
+
widths — all from single keypresses. It is the Python descendant of the
|
|
10
|
+
author's venerable `redshift.f` (Fortran/Figaro, 1990s) via `pdlredshift`
|
|
11
|
+
(Perl/PDL/PGPLOT), and deliberately keeps that fast keyboard-driven feel.
|
|
12
|
+
|
|
13
|
+

|
|
14
|
+
|
|
15
|
+
*An SDSS quasar from [Example-Spectra](Example-Spectra/) at z = 2.48 and
|
|
16
|
+
counting, in `--retro` mode: Lyα, CIV and CIII] lined up; the crosshair
|
|
17
|
+
cursor mid-hunt.*
|
|
18
|
+
|
|
19
|
+
## Install
|
|
20
|
+
|
|
21
|
+
```
|
|
22
|
+
pip install git+https://github.com/karlglazebrook/pyredshift
|
|
23
|
+
```
|
|
24
|
+
|
|
25
|
+
or from a checkout:
|
|
26
|
+
|
|
27
|
+
```
|
|
28
|
+
pip install .
|
|
29
|
+
```
|
|
30
|
+
|
|
31
|
+
This installs the `pyredshift` command into the active python's `bin/`
|
|
32
|
+
(e.g. `anaconda3/bin`) and the `pyredshift` package into `site-packages`.
|
|
33
|
+
Requires python ≥ 3.9 with numpy, matplotlib, astropy and scipy.
|
|
34
|
+
|
|
35
|
+
## Usage
|
|
36
|
+
|
|
37
|
+
```
|
|
38
|
+
pyredshift spectrum.fits # format auto-detected
|
|
39
|
+
pyredshift spectrum.fits -f sdss # force a format
|
|
40
|
+
pyredshift spectrum.fits -z 2.19 # start from a known redshift
|
|
41
|
+
pyredshift spectrum.fits --retro # retro PGPLOT-style black background
|
|
42
|
+
pyredshift spectrum.fits --microns # keep micron wavelengths (no A conversion)
|
|
43
|
+
```
|
|
44
|
+
|
|
45
|
+
The file format is auto-detected by inspecting the FITS structure and
|
|
46
|
+
column names/units:
|
|
47
|
+
|
|
48
|
+
| Format | Description |
|
|
49
|
+
|------------|-------------------------------------------------------------------|
|
|
50
|
+
| `fits` | 1D (or 2D — row 1) FITS image with WCS; `CD1_1` overrides `CDELT1`, IRAF/SDSS log-λ flags handled |
|
|
51
|
+
| `sdss` | SDSS binary table (`LOGLAM`/`FLUX`, either case) |
|
|
52
|
+
| `table` | generic binary table with wave+flux columns; `TUNIT` (µm, nm, Å) converted automatically (aliases: `jwst`, `gabe`, `dja`) |
|
|
53
|
+
| `xs` | XSHOOTER 1D table spectrum (nm) |
|
|
54
|
+
| `xs2` | XSHOOTER as a FITS image in extension 1 |
|
|
55
|
+
| `outthere` | OutThere multi-extension grism spectra, stitched and flat-calibrated |
|
|
56
|
+
| `csv` | comma-separated, header rows skipped |
|
|
57
|
+
| `ascii` | 2-column text |
|
|
58
|
+
|
|
59
|
+
Wavelengths that look like microns are converted to Ångstroms; NaNs are
|
|
60
|
+
treated as bad pixels and plot as gaps, with orange markers along the
|
|
61
|
+
bottom of the frame.
|
|
62
|
+
|
|
63
|
+
Real spectra to practice on are included in
|
|
64
|
+
[Example-Spectra](Example-Spectra/) — the true redshifts are hidden in
|
|
65
|
+
their FITS headers.
|
|
66
|
+
|
|
67
|
+
### From a Jupyter notebook
|
|
68
|
+
|
|
69
|
+
The interactive module also works straight from a notebook, given numpy
|
|
70
|
+
arrays:
|
|
71
|
+
|
|
72
|
+
```python
|
|
73
|
+
from pyredshift import redshift as redshift_module
|
|
74
|
+
z = redshift_module.redshift(wave, flux)
|
|
75
|
+
```
|
|
76
|
+
|
|
77
|
+
The interactive window opens *outside* the notebook (inline backends
|
|
78
|
+
cannot deliver events to it) and the cell blocks until you quit with
|
|
79
|
+
`q`; the final annotated view is then embedded in the cell output and
|
|
80
|
+
the redshift returned. Any non-interactive backend (e.g. `%matplotlib
|
|
81
|
+
inline`) is switched to a GUI backend for the session and restored
|
|
82
|
+
afterwards — including if you interrupt the kernel mid-session.
|
|
83
|
+
|
|
84
|
+
**Local kernels only**: the window opens on the machine where the
|
|
85
|
+
kernel runs, so remote kernels (JupyterHub, cloud, ssh without X
|
|
86
|
+
forwarding) cannot work — pyredshift detects this and says so rather
|
|
87
|
+
than hanging or crashing the kernel.
|
|
88
|
+
|
|
89
|
+
## Interaction
|
|
90
|
+
|
|
91
|
+
Press `?` (or click the `?` button) for the full command reference — it
|
|
92
|
+
opens as a themed page in your browser, with the complete line list and a
|
|
93
|
+
short guide in separate tabs. The essentials:
|
|
94
|
+
|
|
95
|
+
- **Identify a line**: put the crosshair on a feature and press `ESC`
|
|
96
|
+
followed by a shortcut key (`a` = Hα, `b` = Hβ, `l` = Lyα, `o` = [OII],
|
|
97
|
+
`c` = CIV ...) — or right-click the feature and pick the line from the
|
|
98
|
+
popup menu, or `g` to type any rest wavelength. Press `ESC ESC` on a
|
|
99
|
+
sharp line to refine the redshift; `=` enters a redshift directly.
|
|
100
|
+
- **Navigate**: drag the mouse for a rubber-band zoom (a purely horizontal
|
|
101
|
+
drag zooms X only), `z`/`u` and `i`/`o` zoom about the cursor, `[` `]`
|
|
102
|
+
pan, `w` whole range, `a` autoscale, `h` home. The matplotlib toolbar
|
|
103
|
+
works too and stays in sync.
|
|
104
|
+
- **Analyse**: `b` bin, `s` smooth, `_` iterative continuum fit,
|
|
105
|
+
`m` equivalent width and line flux, `B` zap artefacts, `p` print to PDF.
|
|
106
|
+
- **Quit**: `q` — the final redshift is reported on the terminal.
|
|
107
|
+
|
|
108
|
+
Line identifications come from `pyredshift.lines` (CSV: wavelength, name,
|
|
109
|
+
label, matplotlib colour, comment — all vacuum wavelengths; a colour may
|
|
110
|
+
be a `light/dark` pair for the two backgrounds), installed
|
|
111
|
+
alongside the module and easy to customise. The window size and aspect
|
|
112
|
+
ratio are remembered between runs in `~/.pyredshift.json`. A template
|
|
113
|
+
spectrum can be overlaid with `t` (searched for in `$DATADIR`,
|
|
114
|
+
`$NEWMODELS/Spectra`, then `~/Templates/Spectra`).
|
|
115
|
+
|
|
116
|
+
## Layout
|
|
117
|
+
|
|
118
|
+
```
|
|
119
|
+
pyredshift the command-line script: format detection and reading
|
|
120
|
+
src/pyredshift/ the interactive module (redshift.py) + data files
|
|
121
|
+
```
|
|
122
|
+
|
|
123
|
+
The script prefers a `src/pyredshift/` found next to it or under the
|
|
124
|
+
current directory, so a development checkout always runs its own code.
|
|
125
|
+
|
|
126
|
+
## Credits
|
|
127
|
+
|
|
128
|
+
Karl Glazebrook, Swinburne University of Technology.
|
|
129
|
+
|
|
130
|
+
Lineage: `redshift.f` (FIGARO/Fortran, ~1992) → `pdlredshift` (Perl/PDL) →
|
|
131
|
+
`pyredshift`. Ported with the assistance of Claude (Anthropic).
|
|
132
|
+
|
|
133
|
+
MIT license — see [LICENSE](LICENSE).
|
|
@@ -0,0 +1,297 @@
|
|
|
1
|
+
#!/usr/bin/env python3
|
|
2
|
+
"""
|
|
3
|
+
pyredshift - read a 1D spectrum in any of the usual formats and
|
|
4
|
+
redshift it interactively. Python port of the Perl 'pdlredshift'.
|
|
5
|
+
|
|
6
|
+
Usage:
|
|
7
|
+
pyredshift spectrum.fits # format auto-detected
|
|
8
|
+
pyredshift spectrum.fits -f sdss # manual override
|
|
9
|
+
pyredshift spectrum.fits -z 2.19 # start at a known redshift
|
|
10
|
+
|
|
11
|
+
Formats are auto-detected where possible by inspecting the FITS HDUs
|
|
12
|
+
and column names/units, replacing the old mode zoo:
|
|
13
|
+
ascii 2 column ascii file
|
|
14
|
+
csv comma separated, header rows skipped (NIRSPEC ERO data)
|
|
15
|
+
fits 1D (or 2D - row 1 used) FITS image with WCS; handles
|
|
16
|
+
CD1_1 overriding CDELT1 and IRAF/SDSS log-lambda flags
|
|
17
|
+
sdss SDSS binary table (LOGLAM/FLUX, either case)
|
|
18
|
+
table generic binary table with wave+flux columns; TUNIT
|
|
19
|
+
(um, nm, Angstrom...) converted automatically.
|
|
20
|
+
(aliases: jwst, jwst2, gabe, dja)
|
|
21
|
+
xs XSHOOTER 1D table spectrum (WAVE in nm)
|
|
22
|
+
xs2 XSHOOTER as FITS image in extension 1 (Corentin's code)
|
|
23
|
+
outthere OutThere multi-extension grism spectra: F115W/F150W/F200W
|
|
24
|
+
extensions stitched in wavelength order, flux/flat
|
|
25
|
+
calibrated, overlaps trimmed at the filter transitions
|
|
26
|
+
"""
|
|
27
|
+
|
|
28
|
+
import argparse
|
|
29
|
+
import os
|
|
30
|
+
import re
|
|
31
|
+
import sys
|
|
32
|
+
|
|
33
|
+
import numpy as np
|
|
34
|
+
from astropy.io import fits
|
|
35
|
+
from astropy import units as u
|
|
36
|
+
|
|
37
|
+
# Dev override: a src/pyredshift package next to this script, or under the
|
|
38
|
+
# current directory, is picked up in preference to the pip-installed one
|
|
39
|
+
for _p in (os.path.join(os.path.dirname(os.path.abspath(__file__)), "src"),
|
|
40
|
+
os.path.join(os.getcwd(), "src")):
|
|
41
|
+
if os.path.isdir(os.path.join(_p, "pyredshift")):
|
|
42
|
+
sys.path.insert(0, _p)
|
|
43
|
+
from pyredshift import redshift as redshift_module
|
|
44
|
+
|
|
45
|
+
WAVE_COLS = ("wave", "wavelength", "lam", "lambda", "awav", "wav")
|
|
46
|
+
FLUX_COLS = ("flux", "flam", "fnu", "spec", "counts")
|
|
47
|
+
|
|
48
|
+
# Old pdlredshift mode names that the generic table reader now covers
|
|
49
|
+
ALIASES = {"jwst": "table", "jwst2": "table", "gabe": "table", "dja": "table"}
|
|
50
|
+
|
|
51
|
+
|
|
52
|
+
def wave_factor(unit_str):
|
|
53
|
+
"""Conversion factor from a TUNIT string to Angstroms, or None."""
|
|
54
|
+
if not unit_str:
|
|
55
|
+
return None
|
|
56
|
+
try:
|
|
57
|
+
return float((1 * u.Unit(unit_str)).to(u.AA).value)
|
|
58
|
+
except Exception:
|
|
59
|
+
return None
|
|
60
|
+
|
|
61
|
+
|
|
62
|
+
def read_ascii(fname):
|
|
63
|
+
print("Reading file %s as a 2 column ascii file" % fname)
|
|
64
|
+
wav, spec = np.loadtxt(fname, usecols=(0, 1), comments="#", unpack=True)
|
|
65
|
+
return wav, spec, True
|
|
66
|
+
|
|
67
|
+
|
|
68
|
+
def read_csv(fname):
|
|
69
|
+
print("Reading file %s as a CSV table spectrum" % fname)
|
|
70
|
+
# Exclude headers: rows beginning with # or letters
|
|
71
|
+
wav, spec = [], []
|
|
72
|
+
with open(fname) as fh:
|
|
73
|
+
for line in fh:
|
|
74
|
+
if not line.strip() or re.match(r"^#|^\s*[A-Za-z]", line):
|
|
75
|
+
continue
|
|
76
|
+
parts = line.split(",")
|
|
77
|
+
try:
|
|
78
|
+
wav.append(float(parts[0]))
|
|
79
|
+
spec.append(float(parts[1]))
|
|
80
|
+
except (IndexError, ValueError):
|
|
81
|
+
continue
|
|
82
|
+
return np.array(wav), np.array(spec), True
|
|
83
|
+
|
|
84
|
+
|
|
85
|
+
def first_table(hdul):
|
|
86
|
+
for hdu in hdul:
|
|
87
|
+
if getattr(hdu, "columns", None) is not None and hdu.data is not None:
|
|
88
|
+
return hdu
|
|
89
|
+
return None
|
|
90
|
+
|
|
91
|
+
|
|
92
|
+
def first_image(hdul):
|
|
93
|
+
for hdu in hdul:
|
|
94
|
+
if hdu.is_image and hdu.data is not None and hdu.data.size > 1:
|
|
95
|
+
return hdu
|
|
96
|
+
return None
|
|
97
|
+
|
|
98
|
+
|
|
99
|
+
def looks_outthere(hdul):
|
|
100
|
+
n = 0
|
|
101
|
+
for hdu in hdul:
|
|
102
|
+
if getattr(hdu, "columns", None) is None:
|
|
103
|
+
continue
|
|
104
|
+
extname = str(hdu.header.get("EXTNAME", ""))
|
|
105
|
+
if re.match(r"^F\d+W", extname) and "flat" in [c.lower() for c in hdu.columns.names]:
|
|
106
|
+
n += 1
|
|
107
|
+
return n >= 2
|
|
108
|
+
|
|
109
|
+
|
|
110
|
+
def read_table(hdu, hint=""):
|
|
111
|
+
"""Generic FITS table spectrum: find the wave/flux columns whatever
|
|
112
|
+
their case, use TUNIT to fix the wavelength units."""
|
|
113
|
+
low = {c.lower(): c for c in hdu.columns.names}
|
|
114
|
+
|
|
115
|
+
if "loglam" in low: # The particular SDSS format FITS table
|
|
116
|
+
print("as a SDSS table spectrum")
|
|
117
|
+
wav = 10.0 ** np.asarray(hdu.data[low["loglam"]], float).ravel()
|
|
118
|
+
spec = np.asarray(hdu.data[low["flux"]], float).ravel()
|
|
119
|
+
return wav, spec
|
|
120
|
+
|
|
121
|
+
wcol = next((low[n] for n in WAVE_COLS if n in low), None)
|
|
122
|
+
fcol = next((low[n] for n in FLUX_COLS if n in low), None)
|
|
123
|
+
if wcol is None or fcol is None:
|
|
124
|
+
sys.exit("Cannot identify wavelength/flux columns among %s"
|
|
125
|
+
% list(hdu.columns.names))
|
|
126
|
+
print("as a FITS table spectrum (columns %s, %s)" % (wcol, fcol), end="")
|
|
127
|
+
wav = np.asarray(hdu.data[wcol], float).ravel()
|
|
128
|
+
spec = np.asarray(hdu.data[fcol], float).ravel()
|
|
129
|
+
|
|
130
|
+
fac = wave_factor(hdu.columns[wcol].unit)
|
|
131
|
+
if fac is not None and fac != 1.0:
|
|
132
|
+
print(" [%s -> Angstroms]" % hdu.columns[wcol].unit, end="")
|
|
133
|
+
wav = wav * fac
|
|
134
|
+
elif fac is None and "SHOOT" in hint.upper():
|
|
135
|
+
print(" [XSHOOTER nm -> Angstroms]", end="")
|
|
136
|
+
wav = wav * 10.0
|
|
137
|
+
print()
|
|
138
|
+
return wav, spec
|
|
139
|
+
|
|
140
|
+
|
|
141
|
+
def read_image(hdu):
|
|
142
|
+
print("as a FITS image spectrum", end="")
|
|
143
|
+
spec = np.asarray(hdu.data, float)
|
|
144
|
+
h = hdu.header
|
|
145
|
+
if spec.ndim == 2: # Handle 2D case
|
|
146
|
+
print(" found 2D file, assuming row 1", end="")
|
|
147
|
+
spec = spec[0].copy()
|
|
148
|
+
x = np.arange(spec.size, dtype=float)
|
|
149
|
+
wav = x.copy() # In case there is no WCS
|
|
150
|
+
has_wcs = "CRVAL1" in h
|
|
151
|
+
if has_wcs:
|
|
152
|
+
print(" found WCS", end="")
|
|
153
|
+
# See https://www.aanda.org/articles/aa/pdf/2002/45/aah3859.pdf
|
|
154
|
+
delt = h.get("CDELT1", 1.0)
|
|
155
|
+
if "CD1_1" in h:
|
|
156
|
+
delt = h["CD1_1"] # CD1_1 overrides!
|
|
157
|
+
wav = (x - h.get("CRPIX1", 1.0) + 1) * delt + h["CRVAL1"]
|
|
158
|
+
# First is IRAF, second is SDSS convention
|
|
159
|
+
if h.get("DC-FLAG") or h.get("LOGSCALE") == 1:
|
|
160
|
+
print(" log scale", end="")
|
|
161
|
+
wav = 10.0 ** wav
|
|
162
|
+
else:
|
|
163
|
+
print(" linear scale", end="")
|
|
164
|
+
print()
|
|
165
|
+
return wav, spec, has_wcs
|
|
166
|
+
|
|
167
|
+
|
|
168
|
+
def read_outthere(hdul):
|
|
169
|
+
"""Read the F115W/F150W/F200W grism extensions and append them."""
|
|
170
|
+
print("as OutThere multi-extension grism spectra")
|
|
171
|
+
tabs = [hdu for hdu in hdul
|
|
172
|
+
if getattr(hdu, "columns", None) is not None
|
|
173
|
+
and str(hdu.header.get("EXTNAME", "")).startswith("F")]
|
|
174
|
+
tabs.sort(key=lambda hdu: hdu.header["EXTNAME"]) # EXTNAME order == wavelength order
|
|
175
|
+
wav = np.array([])
|
|
176
|
+
spec = np.array([])
|
|
177
|
+
for tab in tabs:
|
|
178
|
+
ext = tab.header["EXTNAME"]
|
|
179
|
+
wave = np.asarray(tab.data["wave"], float).ravel()
|
|
180
|
+
flux = np.asarray(tab.data["flux"], float).ravel()
|
|
181
|
+
flat = np.asarray(tab.data["flat"], float).ravel()
|
|
182
|
+
# Select wavelengths based on filter to avoid overlaps; these
|
|
183
|
+
# transitions are based on where one filter curve exceeds the other
|
|
184
|
+
keep = wave > 0 # Default select all
|
|
185
|
+
if ext == "F115W":
|
|
186
|
+
keep = wave <= 13040
|
|
187
|
+
if ext == "F150W":
|
|
188
|
+
keep = (wave > 13040) & (wave <= 17070)
|
|
189
|
+
if ext == "F200W":
|
|
190
|
+
keep = wave > 17070
|
|
191
|
+
with np.errstate(divide="ignore", invalid="ignore"):
|
|
192
|
+
wav = np.append(wav, wave[keep])
|
|
193
|
+
spec = np.append(spec, flux[keep] / flat[keep])
|
|
194
|
+
return wav, spec
|
|
195
|
+
|
|
196
|
+
|
|
197
|
+
def read_spectrum(fname, fmt=None):
|
|
198
|
+
if not os.path.exists(fname):
|
|
199
|
+
sys.exit("File %s not found" % fname)
|
|
200
|
+
fmt = (fmt or "").lower()
|
|
201
|
+
fmt = ALIASES.get(fmt, fmt)
|
|
202
|
+
|
|
203
|
+
if fmt == "ascii":
|
|
204
|
+
return read_ascii(fname)
|
|
205
|
+
if fmt == "csv":
|
|
206
|
+
return read_csv(fname)
|
|
207
|
+
|
|
208
|
+
try:
|
|
209
|
+
hdul = fits.open(fname, memmap=False)
|
|
210
|
+
except Exception:
|
|
211
|
+
hdul = None
|
|
212
|
+
|
|
213
|
+
if hdul is None: # Not FITS: csv or plain ascii
|
|
214
|
+
if fmt:
|
|
215
|
+
sys.exit("%s is not a FITS file, but format '%s' was requested"
|
|
216
|
+
% (fname, fmt))
|
|
217
|
+
with open(fname) as fh:
|
|
218
|
+
for line in fh:
|
|
219
|
+
if line.strip() and not line.startswith("#"):
|
|
220
|
+
if "," in line or fname.lower().endswith(".csv"):
|
|
221
|
+
return read_csv(fname)
|
|
222
|
+
return read_ascii(fname)
|
|
223
|
+
sys.exit("%s appears to be empty" % fname)
|
|
224
|
+
|
|
225
|
+
with hdul:
|
|
226
|
+
print("Reading file %s " % fname, end="")
|
|
227
|
+
instrume = str(hdul[0].header.get("INSTRUME", ""))
|
|
228
|
+
has_wcs = True # tables always carry real wavelengths
|
|
229
|
+
|
|
230
|
+
if fmt in ("table", "sdss"):
|
|
231
|
+
wav, spec = read_table(first_table(hdul), instrume)
|
|
232
|
+
elif fmt == "xs":
|
|
233
|
+
print("as an XSHOOTER 1D table spectrum")
|
|
234
|
+
tab = hdul[1]
|
|
235
|
+
wav = np.asarray(tab.data["WAVE"], float).ravel() * 10
|
|
236
|
+
spec = np.asarray(tab.data["FLUX"], float).ravel()
|
|
237
|
+
elif fmt == "xs2":
|
|
238
|
+
wav, spec, has_wcs = read_image(hdul[1])
|
|
239
|
+
wav = wav * 10000.0
|
|
240
|
+
elif fmt == "outthere":
|
|
241
|
+
wav, spec = read_outthere(hdul)
|
|
242
|
+
elif fmt == "fits":
|
|
243
|
+
wav, spec, has_wcs = read_image(first_image(hdul))
|
|
244
|
+
elif fmt == "": # Auto-detect from the HDU structure
|
|
245
|
+
if looks_outthere(hdul):
|
|
246
|
+
wav, spec = read_outthere(hdul)
|
|
247
|
+
else:
|
|
248
|
+
tab = first_table(hdul)
|
|
249
|
+
if tab is not None:
|
|
250
|
+
wav, spec = read_table(tab, instrume)
|
|
251
|
+
else:
|
|
252
|
+
img = first_image(hdul)
|
|
253
|
+
if img is None:
|
|
254
|
+
sys.exit("No spectrum found in FITS file")
|
|
255
|
+
wav, spec, has_wcs = read_image(img)
|
|
256
|
+
else:
|
|
257
|
+
sys.exit("Unknown format '%s' (see pyredshift -h)" % fmt)
|
|
258
|
+
|
|
259
|
+
spec = np.asarray(spec, float)
|
|
260
|
+
spec[~np.isfinite(spec)] = np.nan # NaNs plot as gaps downstream
|
|
261
|
+
return np.asarray(wav, float), spec, has_wcs
|
|
262
|
+
|
|
263
|
+
|
|
264
|
+
def main():
|
|
265
|
+
ap = argparse.ArgumentParser(
|
|
266
|
+
prog="pyredshift",
|
|
267
|
+
description="Interactive redshifting of 1D spectra (port of pdlredshift).",
|
|
268
|
+
epilog="Formats: ascii csv fits sdss table (=jwst,jwst2,gabe,dja) "
|
|
269
|
+
"xs xs2 outthere. Default is auto-detection.")
|
|
270
|
+
ap.add_argument("file", help="spectrum file (FITS, CSV or 2-column ascii)")
|
|
271
|
+
ap.add_argument("-f", "--format", default=None, metavar="FORMAT",
|
|
272
|
+
help="force the input format instead of auto-detecting")
|
|
273
|
+
ap.add_argument("-z", "--redshift", type=float, default=None,
|
|
274
|
+
help="initial redshift guess")
|
|
275
|
+
ap.add_argument("--retro", action="store_true",
|
|
276
|
+
help="retro PGPLOT-style black background")
|
|
277
|
+
ap.add_argument("--microns", action="store_true",
|
|
278
|
+
help="keep micron wavelengths (micron-mode display) "
|
|
279
|
+
"instead of converting to Angstroms")
|
|
280
|
+
ap.add_argument("--dark", dest="retro", action="store_true",
|
|
281
|
+
help=argparse.SUPPRESS) # deprecated alias for --retro
|
|
282
|
+
args = ap.parse_args()
|
|
283
|
+
|
|
284
|
+
wav, spec, has_wcs = read_spectrum(args.file, args.format)
|
|
285
|
+
|
|
286
|
+
if np.nanmax(wav) < 100 and has_wcs and not args.microns:
|
|
287
|
+
print(" Detected microns -> Angstroms (--microns to keep)")
|
|
288
|
+
wav = wav * 10000.0
|
|
289
|
+
|
|
290
|
+
z = redshift_module.redshift(wav, spec, args.redshift,
|
|
291
|
+
os.path.basename(args.file), dark=args.retro)
|
|
292
|
+
if z is not None:
|
|
293
|
+
print("Final redshift = %.6g" % z)
|
|
294
|
+
|
|
295
|
+
|
|
296
|
+
if __name__ == "__main__":
|
|
297
|
+
main()
|
pyredshift-1.9/setup.cfg
ADDED
pyredshift-1.9/setup.py
ADDED
|
@@ -0,0 +1,40 @@
|
|
|
1
|
+
from setuptools import setup
|
|
2
|
+
|
|
3
|
+
# pip install . (from this directory)
|
|
4
|
+
#
|
|
5
|
+
# Installs:
|
|
6
|
+
# the pyredshift package (redshift.py + data files pyredshift.lines,
|
|
7
|
+
# pyredshift-help.html) -> site-packages/pyredshift/
|
|
8
|
+
# the pyredshift script -> the bin/ of whichever python runs the install
|
|
9
|
+
# (e.g. anaconda3/bin), with the shebang rewritten to that python.
|
|
10
|
+
#
|
|
11
|
+
# The package source lives in src/ (a file and a directory cannot share
|
|
12
|
+
# the name 'pyredshift' at the top level).
|
|
13
|
+
|
|
14
|
+
setup(
|
|
15
|
+
name="pyredshift",
|
|
16
|
+
version="1.9",
|
|
17
|
+
description="Interactive redshifting of 1D astronomical spectra "
|
|
18
|
+
"(Python successor of pdlredshift / redshift.f)",
|
|
19
|
+
long_description=open("README.md").read(),
|
|
20
|
+
long_description_content_type="text/markdown",
|
|
21
|
+
author="Karl Glazebrook",
|
|
22
|
+
url="https://github.com/karlglazebrook/pyredshift",
|
|
23
|
+
license="MIT",
|
|
24
|
+
classifiers=[
|
|
25
|
+
"Development Status :: 5 - Production/Stable",
|
|
26
|
+
"Intended Audience :: Science/Research",
|
|
27
|
+
"Topic :: Scientific/Engineering :: Astronomy",
|
|
28
|
+
"License :: OSI Approved :: MIT License",
|
|
29
|
+
"Programming Language :: Python :: 3",
|
|
30
|
+
"Environment :: MacOS X",
|
|
31
|
+
"Environment :: X11 Applications",
|
|
32
|
+
],
|
|
33
|
+
keywords="astronomy spectroscopy redshift spectra interactive",
|
|
34
|
+
packages=["pyredshift"],
|
|
35
|
+
package_dir={"": "src"},
|
|
36
|
+
package_data={"pyredshift": ["pyredshift.lines", "pyredshift-help.html"]},
|
|
37
|
+
scripts=["pyredshift"],
|
|
38
|
+
install_requires=["numpy", "matplotlib", "astropy", "scipy"],
|
|
39
|
+
python_requires=">=3.9",
|
|
40
|
+
)
|