pyCirclizely 1.0.0__tar.gz
This diff represents the content of publicly available package versions that have been released to one of the supported registries. The information contained in this diff is provided for informational purposes only and reflects changes between package versions as they appear in their respective public registries.
- pycirclizely-1.0.0/.gitattributes +1 -0
- pycirclizely-1.0.0/.github/workflows/ci.yml +40 -0
- pycirclizely-1.0.0/.gitignore +8 -0
- pycirclizely-1.0.0/.pre-commit-config.yaml +112 -0
- pycirclizely-1.0.0/CITATION.cff +0 -0
- pycirclizely-1.0.0/LICENSE +22 -0
- pycirclizely-1.0.0/PKG-INFO +329 -0
- pycirclizely-1.0.0/README.md +310 -0
- pycirclizely-1.0.0/docs/api-docs/circos.md +3 -0
- pycirclizely-1.0.0/docs/api-docs/sector.md +3 -0
- pycirclizely-1.0.0/docs/api-docs/track.md +3 -0
- pycirclizely-1.0.0/docs/api-docs/treeviz.md +3 -0
- pycirclizely-1.0.0/docs/api-docs/utils.md +18 -0
- pycirclizely-1.0.0/docs/chord_diagram.ipynb +331 -0
- pycirclizely-1.0.0/docs/circos_plot_euk.ipynb +457 -0
- pycirclizely-1.0.0/docs/circos_plot_prok.ipynb +448 -0
- pycirclizely-1.0.0/docs/comparative_genomics.ipynb +347 -0
- pycirclizely-1.0.0/docs/getting_started.ipynb +534 -0
- pycirclizely-1.0.0/docs/images/example01.png +0 -0
- pycirclizely-1.0.0/docs/images/example02.png +0 -0
- pycirclizely-1.0.0/docs/images/example03.png +0 -0
- pycirclizely-1.0.0/docs/images/example04.png +0 -0
- pycirclizely-1.0.0/docs/images/example05.png +0 -0
- pycirclizely-1.0.0/docs/images/example06.png +0 -0
- pycirclizely-1.0.0/docs/images/pyCirclizely_gallery.png +0 -0
- pycirclizely-1.0.0/docs/index.md +42 -0
- pycirclizely-1.0.0/docs/phylogenetic_tree.ipynb +901 -0
- pycirclizely-1.0.0/docs/plot_api_example.ipynb +1291 -0
- pycirclizely-1.0.0/docs/plot_tips.ipynb +443 -0
- pycirclizely-1.0.0/docs/radar_chart.ipynb +201 -0
- pycirclizely-1.0.0/mkdocs.yml +93 -0
- pycirclizely-1.0.0/mypy.ini +2 -0
- pycirclizely-1.0.0/pyproject.toml +117 -0
- pycirclizely-1.0.0/requirements-dev.lock +382 -0
- pycirclizely-1.0.0/requirements.lock +36 -0
- pycirclizely-1.0.0/src/pycirclizely/__init__.py +7 -0
- pycirclizely-1.0.0/src/pycirclizely/circos.py +914 -0
- pycirclizely-1.0.0/src/pycirclizely/config.py +220 -0
- pycirclizely-1.0.0/src/pycirclizely/impl/chord.py +92 -0
- pycirclizely-1.0.0/src/pycirclizely/impl/radar.py +189 -0
- pycirclizely-1.0.0/src/pycirclizely/parser/__init__.py +14 -0
- pycirclizely-1.0.0/src/pycirclizely/parser/bed.py +52 -0
- pycirclizely-1.0.0/src/pycirclizely/parser/genbank.py +367 -0
- pycirclizely-1.0.0/src/pycirclizely/parser/gff.py +414 -0
- pycirclizely-1.0.0/src/pycirclizely/parser/matrix.py +184 -0
- pycirclizely-1.0.0/src/pycirclizely/parser/table.py +174 -0
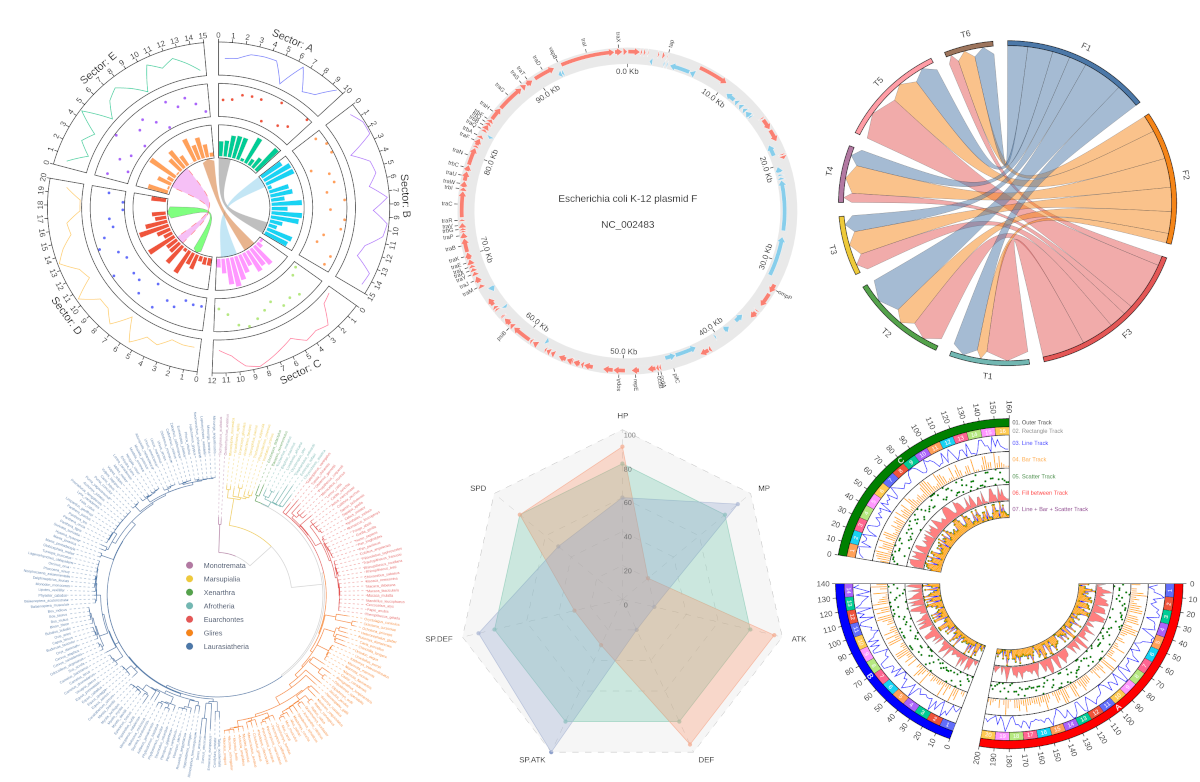
- pycirclizely-1.0.0/src/pycirclizely/patches.py +337 -0
- pycirclizely-1.0.0/src/pycirclizely/sector.py +350 -0
- pycirclizely-1.0.0/src/pycirclizely/track.py +1431 -0
- pycirclizely-1.0.0/src/pycirclizely/tree.py +680 -0
- pycirclizely-1.0.0/src/pycirclizely/types.py +21 -0
- pycirclizely-1.0.0/src/pycirclizely/utils/__init__.py +34 -0
- pycirclizely-1.0.0/src/pycirclizely/utils/color.py +216 -0
- pycirclizely-1.0.0/src/pycirclizely/utils/dataset.py +198 -0
- pycirclizely-1.0.0/src/pycirclizely/utils/example_data/images/python_logo.png +0 -0
- pycirclizely-1.0.0/src/pycirclizely/utils/example_data/trees/alphabet.nwk +1 -0
- pycirclizely-1.0.0/src/pycirclizely/utils/example_data/trees/large_example.nwk +1 -0
- pycirclizely-1.0.0/src/pycirclizely/utils/example_data/trees/medium_example.nwk +1 -0
- pycirclizely-1.0.0/src/pycirclizely/utils/example_data/trees/small_example.nwk +1 -0
- pycirclizely-1.0.0/src/pycirclizely/utils/helper.py +100 -0
- pycirclizely-1.0.0/src/pycirclizely/utils/hover_formatter.py +201 -0
- pycirclizely-1.0.0/src/pycirclizely/utils/plot.py +193 -0
- pycirclizely-1.0.0/tests/__init__.py +0 -0
- pycirclizely-1.0.0/tests/conftest.py +116 -0
- pycirclizely-1.0.0/tests/parser/__init__.py +0 -0
- pycirclizely-1.0.0/tests/parser/test_genbank.py +74 -0
- pycirclizely-1.0.0/tests/parser/test_gff.py +56 -0
- pycirclizely-1.0.0/tests/parser/test_matrix.py +156 -0
- pycirclizely-1.0.0/tests/parser/test_table.py +123 -0
- pycirclizely-1.0.0/tests/test_circos.py +84 -0
- pycirclizely-1.0.0/tests/test_plot.py +725 -0
- pycirclizely-1.0.0/tests/test_sector.py +94 -0
- pycirclizely-1.0.0/tests/test_track.py +43 -0
- pycirclizely-1.0.0/tests/testdata/eukaryote/hg38/hg38_chr.bed +25 -0
- pycirclizely-1.0.0/tests/testdata/eukaryote/hg38/hg38_cytoband.tsv +864 -0
- pycirclizely-1.0.0/tests/testdata/eukaryote/hg38/hg38_genomic_link.tsv +5990 -0
- pycirclizely-1.0.0/tests/testdata/prokaryote/enterobacteria_phage.gbk +2415 -0
- pycirclizely-1.0.0/tests/testdata/prokaryote/enterobacteria_phage.gff +184 -0
- pycirclizely-1.0.0/tests/testdata/prokaryote/mycoplasma_alvi.gbk.gz +0 -0
- pycirclizely-1.0.0/tests/testdata/prokaryote/mycoplasma_alvi.gff.gz +0 -0
- pycirclizely-1.0.0/tests/testdata/prokaryote/mycoplasma_alvi_nocomment.gff.gz +0 -0
- pycirclizely-1.0.0/tests/utils/__init__.py +0 -0
- pycirclizely-1.0.0/tests/utils/test_dataset.py +55 -0
- pycirclizely-1.0.0/tests/utils/test_helper.py +81 -0
|
@@ -0,0 +1 @@
|
|
|
1
|
+
*.ipynb linguist-documentation
|
|
@@ -0,0 +1,40 @@
|
|
|
1
|
+
---
|
|
2
|
+
name: CI
|
|
3
|
+
on:
|
|
4
|
+
push:
|
|
5
|
+
branches: [main, develop]
|
|
6
|
+
paths: [src/**, tests/**, .github/workflows/ci.yml, .pre-commit-config.yaml]
|
|
7
|
+
pull_request:
|
|
8
|
+
branches: [main, develop]
|
|
9
|
+
paths: [src/**, tests/**, .github/workflows/ci.yml, .pre-commit-config.yaml]
|
|
10
|
+
workflow_dispatch:
|
|
11
|
+
|
|
12
|
+
jobs:
|
|
13
|
+
CI:
|
|
14
|
+
runs-on: ubuntu-latest
|
|
15
|
+
strategy:
|
|
16
|
+
matrix:
|
|
17
|
+
python-version: ['3.10', '3.11', '3.12', '3.13']
|
|
18
|
+
steps:
|
|
19
|
+
- name: Checkout code
|
|
20
|
+
uses: actions/checkout@v4
|
|
21
|
+
|
|
22
|
+
- name: Install Rye
|
|
23
|
+
run: |
|
|
24
|
+
curl -sSf https://rye.astral.sh/get | RYE_INSTALL_OPTION="--yes" bash
|
|
25
|
+
echo "$HOME/.rye/shims" >> $GITHUB_PATH
|
|
26
|
+
|
|
27
|
+
- name: Set up Python ${{ matrix.python-version }}
|
|
28
|
+
run: |
|
|
29
|
+
rye pin ${{ matrix.python-version }}
|
|
30
|
+
rye sync
|
|
31
|
+
|
|
32
|
+
- name: Install pre-commit
|
|
33
|
+
run: rye add pre-commit
|
|
34
|
+
|
|
35
|
+
- name: Run pre-commit hooks
|
|
36
|
+
run: rye run pre-commit run --all-files
|
|
37
|
+
|
|
38
|
+
- name: Run tests (without coverage)
|
|
39
|
+
run: |
|
|
40
|
+
rye run pytest
|
|
@@ -0,0 +1,112 @@
|
|
|
1
|
+
---
|
|
2
|
+
repos:
|
|
3
|
+
- repo: https://github.com/pre-commit/pre-commit-hooks
|
|
4
|
+
rev: v5.0.0
|
|
5
|
+
hooks:
|
|
6
|
+
- id: check-added-large-files
|
|
7
|
+
exclude: \.png$
|
|
8
|
+
args: [--maxkb=50]
|
|
9
|
+
- id: check-case-conflict
|
|
10
|
+
- id: check-json
|
|
11
|
+
- id: check-merge-conflict
|
|
12
|
+
- id: check-symlinks
|
|
13
|
+
- id: check-toml
|
|
14
|
+
- id: check-yaml
|
|
15
|
+
- id: debug-statements
|
|
16
|
+
- id: fix-byte-order-marker
|
|
17
|
+
- id: mixed-line-ending
|
|
18
|
+
- id: name-tests-test
|
|
19
|
+
args: [--pytest-test-first]
|
|
20
|
+
exclude: helper
|
|
21
|
+
files: test/.*py
|
|
22
|
+
|
|
23
|
+
- repo: https://github.com/psf/black
|
|
24
|
+
rev: 24.4.2 # Updated to match your pyproject.toml
|
|
25
|
+
hooks:
|
|
26
|
+
- id: black
|
|
27
|
+
- id: black-jupyter
|
|
28
|
+
types_or: [jupyter]
|
|
29
|
+
|
|
30
|
+
- repo: https://github.com/gitleaks/gitleaks
|
|
31
|
+
rev: v8.24.2
|
|
32
|
+
hooks:
|
|
33
|
+
- id: gitleaks
|
|
34
|
+
|
|
35
|
+
- repo: https://github.com/PyCQA/isort
|
|
36
|
+
rev: 6.0.1
|
|
37
|
+
hooks:
|
|
38
|
+
- id: isort
|
|
39
|
+
|
|
40
|
+
- repo: https://github.com/executablebooks/mdformat
|
|
41
|
+
rev: 0.7.22
|
|
42
|
+
hooks:
|
|
43
|
+
- id: mdformat
|
|
44
|
+
|
|
45
|
+
- repo: https://github.com/pre-commit/mirrors-mypy
|
|
46
|
+
rev: v1.15.0
|
|
47
|
+
hooks:
|
|
48
|
+
- id: mypy
|
|
49
|
+
args: [] #to avoid default --ignore-missing-imports
|
|
50
|
+
additional_dependencies:
|
|
51
|
+
- biopython==1.85
|
|
52
|
+
- numpy==2.0.*
|
|
53
|
+
- pandas==2.2.*
|
|
54
|
+
- pandas-stubs
|
|
55
|
+
- plotly==5.24.*
|
|
56
|
+
- plotly-stubs
|
|
57
|
+
- pytest
|
|
58
|
+
- python-dateutil==2.9.*
|
|
59
|
+
- pytz==2025.2
|
|
60
|
+
- six==1.17.*
|
|
61
|
+
- tzdata==2025.2
|
|
62
|
+
- webcolors==24.11.*
|
|
63
|
+
- webcolors-stubs
|
|
64
|
+
|
|
65
|
+
- repo: https://github.com/nbQA-dev/nbQA
|
|
66
|
+
rev: 1.9.1
|
|
67
|
+
hooks:
|
|
68
|
+
- id: nbqa-black
|
|
69
|
+
- id: nbqa-isort
|
|
70
|
+
- id: nbqa-mypy
|
|
71
|
+
args: [--config-file=mypy.ini, --allow-untyped-defs, --allow-untyped-globals]
|
|
72
|
+
additional_dependencies:
|
|
73
|
+
- mypy==1.15.0
|
|
74
|
+
- biopython==1.85
|
|
75
|
+
- numpy==2.0.*
|
|
76
|
+
- pandas==2.2.*
|
|
77
|
+
- pandas-stubs
|
|
78
|
+
- plotly==5.24.*
|
|
79
|
+
- plotly-stubs
|
|
80
|
+
- pygenomeviz==1.5.*
|
|
81
|
+
- pytest
|
|
82
|
+
- python-dateutil==2.9.*
|
|
83
|
+
- pytz==2025.2
|
|
84
|
+
- six==1.17.*
|
|
85
|
+
- tzdata==2025.2
|
|
86
|
+
- webcolors
|
|
87
|
+
- webcolors-stubs
|
|
88
|
+
|
|
89
|
+
- repo: https://github.com/srstevenson/nb-clean
|
|
90
|
+
rev: 4.0.1
|
|
91
|
+
hooks:
|
|
92
|
+
# https://github.com/srstevenson/nb-clean/issues/323
|
|
93
|
+
- id: nb-clean
|
|
94
|
+
entry: nb-clean check --preserve-execution-counts --preserve-notebook-metadata
|
|
95
|
+
|
|
96
|
+
- repo: https://github.com/astral-sh/ruff-pre-commit
|
|
97
|
+
rev: v0.11.6
|
|
98
|
+
hooks:
|
|
99
|
+
- id: ruff
|
|
100
|
+
args: [--fix]
|
|
101
|
+
|
|
102
|
+
- repo: https://github.com/jendrikseipp/vulture
|
|
103
|
+
rev: v2.14
|
|
104
|
+
hooks:
|
|
105
|
+
- id: vulture
|
|
106
|
+
args: [--min-confidence, '100', src/]
|
|
107
|
+
|
|
108
|
+
- repo: https://github.com/jumanjihouse/pre-commit-hook-yamlfmt
|
|
109
|
+
rev: 0.2.3
|
|
110
|
+
hooks:
|
|
111
|
+
- id: yamlfmt
|
|
112
|
+
args: [--offset, '2', --mapping, '2', --sequence, '4', --width, '94']
|
|
File without changes
|
|
@@ -0,0 +1,22 @@
|
|
|
1
|
+
MIT License
|
|
2
|
+
|
|
3
|
+
Copyright (c) 2022 moshi
|
|
4
|
+
Copyright (c) 2025 Avatar Cognition (modifications)
|
|
5
|
+
|
|
6
|
+
Permission is hereby granted, free of charge, to any person obtaining a copy
|
|
7
|
+
of this software and associated documentation files (the “Software”), to deal
|
|
8
|
+
in the Software without restriction, including without limitation the rights
|
|
9
|
+
to use, copy, modify, merge, publish, distribute, sublicense, and/or sell
|
|
10
|
+
copies of the Software, and to permit persons to whom the Software is
|
|
11
|
+
furnished to do so, subject to the following conditions:
|
|
12
|
+
|
|
13
|
+
The above copyright notice and this permission notice shall be included in
|
|
14
|
+
all copies or substantial portions of the Software.
|
|
15
|
+
|
|
16
|
+
THE SOFTWARE IS PROVIDED “AS IS”, WITHOUT WARRANTY OF ANY KIND, EXPRESS OR
|
|
17
|
+
IMPLIED, INCLUDING BUT NOT LIMITED TO THE WARRANTIES OF MERCHANTABILITY,
|
|
18
|
+
FITNESS FOR A PARTICULAR PURPOSE AND NONINFRINGEMENT. IN NO EVENT SHALL THE
|
|
19
|
+
AUTHORS OR COPYRIGHT HOLDERS BE LIABLE FOR ANY CLAIM, DAMAGES OR OTHER
|
|
20
|
+
LIABILITY, WHETHER IN AN ACTION OF CONTRACT, TORT OR OTHERWISE, ARISING FROM,
|
|
21
|
+
OUT OF OR IN CONNECTION WITH THE SOFTWARE OR THE USE OR OTHER DEALINGS IN
|
|
22
|
+
THE SOFTWARE.
|
|
@@ -0,0 +1,329 @@
|
|
|
1
|
+
Metadata-Version: 2.3
|
|
2
|
+
Name: pyCirclizely
|
|
3
|
+
Version: 1.0.0
|
|
4
|
+
Summary: Circular visualization in Python, plotly implemented
|
|
5
|
+
Project-URL: repository, https://github.com/Avatar-Cognition/pyCirclizely
|
|
6
|
+
Author-email: mirodriguezgal <miguel.rodriguezgal@gmail.com>
|
|
7
|
+
License: MIT
|
|
8
|
+
Keywords: bioinformatics,chord-diagram,circos,plotly,visualization
|
|
9
|
+
Classifier: Intended Audience :: Science/Research
|
|
10
|
+
Classifier: Programming Language :: Python :: 3
|
|
11
|
+
Classifier: Topic :: Scientific/Engineering :: Bio-Informatics
|
|
12
|
+
Requires-Python: >=3.10
|
|
13
|
+
Requires-Dist: biopython>=1.80
|
|
14
|
+
Requires-Dist: numpy>=1.21
|
|
15
|
+
Requires-Dist: pandas>=1.3.5
|
|
16
|
+
Requires-Dist: plotly==5.24.0
|
|
17
|
+
Requires-Dist: webcolors>=24.11
|
|
18
|
+
Description-Content-Type: text/markdown
|
|
19
|
+
|
|
20
|
+
# pyCirclizely: Circular visualization in Python, plotly implemented
|
|
21
|
+
|
|
22
|
+

|
|
23
|
+

|
|
24
|
+

|
|
25
|
+
[](https://github.com/Avatar-Cognition/pyCirclizely/actions/workflows/ci.yml)
|
|
26
|
+
|
|
27
|
+
## Table of contents
|
|
28
|
+
|
|
29
|
+
- [pyCirclizely: Circular visualization in Python, plotly implemented](#pycirclizely-circular-visualization-in-python-plotly-implemented)
|
|
30
|
+
- [Table of contents](#table-of-contents)
|
|
31
|
+
- [Overview](#overview)
|
|
32
|
+
- [Installation](#installation)
|
|
33
|
+
- [API Usage](#api-usage)
|
|
34
|
+
- [Code Example](#code-example)
|
|
35
|
+
- [1. Circos Plot](#1-circos-plot)
|
|
36
|
+
- [2. Circos Plot (Genomics)](#2-circos-plot-genomics)
|
|
37
|
+
- [3. Chord Diagram](#3-chord-diagram)
|
|
38
|
+
- [4. Phylogenetic Tree](#4-phylogenetic-tree)
|
|
39
|
+
- [5. Radar Chart](#5-radar-chart)
|
|
40
|
+
- [Not Implemented Features](#not-implemented-features)
|
|
41
|
+
|
|
42
|
+
## Overview
|
|
43
|
+
|
|
44
|
+
pyCirclizely is a circular visualization python package refactored from [pyCirclize](https://github.com/moshi4/pyCirclize) to use plotly instead of matplotlib, which in turn was inspired by [circlize](https://github.com/jokergoo/circlize) and [pyCircos](https://github.com/ponnhide/pyCircos).
|
|
45
|
+
|
|
46
|
+
It includes useful genome and phylogenetic tree visualization methods for the bioinformatics field. More detailed documentation is available [here](https://Avatar-Cognition.github.io/pyCirclizely/).
|
|
47
|
+
|
|
48
|
+
\
|
|
49
|
+
**Fig.1 pyCirclizely example plot gallery**
|
|
50
|
+
|
|
51
|
+
## Installation
|
|
52
|
+
|
|
53
|
+
`Python 3.10 or later` is required for installation.
|
|
54
|
+
|
|
55
|
+
**Install PyPI package:**
|
|
56
|
+
|
|
57
|
+
```
|
|
58
|
+
pip install pycirclizely
|
|
59
|
+
```
|
|
60
|
+
|
|
61
|
+
**Install conda-forge package:**
|
|
62
|
+
|
|
63
|
+
```
|
|
64
|
+
conda install -c conda-forge pycirclizely
|
|
65
|
+
```
|
|
66
|
+
|
|
67
|
+
## API Usage
|
|
68
|
+
|
|
69
|
+
API usage is described in each of the following sections in the [document](https://Avatar-Cognition.github.io/pyCirclizely/).
|
|
70
|
+
|
|
71
|
+
- [Getting Started](https://Avatar-Cognition.github.io/pyCirclizely/getting_started/)
|
|
72
|
+
- [Plot API Example](https://Avatar-Cognition.github.io/pyCirclizely/plot_api_example/)
|
|
73
|
+
- [Chord Diagram](https://Avatar-Cognition.github.io/pyCirclizely/chord_diagram/)
|
|
74
|
+
- [Radar Chart](https://Avatar-Cognition.github.io/pyCirclizely/radar_chart/)
|
|
75
|
+
- [Circos Genomics Plot (Prokaryotes)](https://Avatar-Cognition.github.io/pyCirclizely/circos_plot_prok/)
|
|
76
|
+
- [Circos Genomics Plot (Eukaryotes)](https://Avatar-Cognition.github.io/pyCirclizely/circos_plot_euk/)
|
|
77
|
+
- [Comparative Genomics](https://Avatar-Cognition.github.io/pyCirclizely/comparative_genomics/)
|
|
78
|
+
- [Phylogenetic Tree](https://Avatar-Cognition.github.io/pyCirclizely/phylogenetic_tree/)
|
|
79
|
+
- [Plot Tips](https://Avatar-Cognition.github.io/pyCirclizely/plot_tips/)
|
|
80
|
+
|
|
81
|
+
## Code Example
|
|
82
|
+
|
|
83
|
+
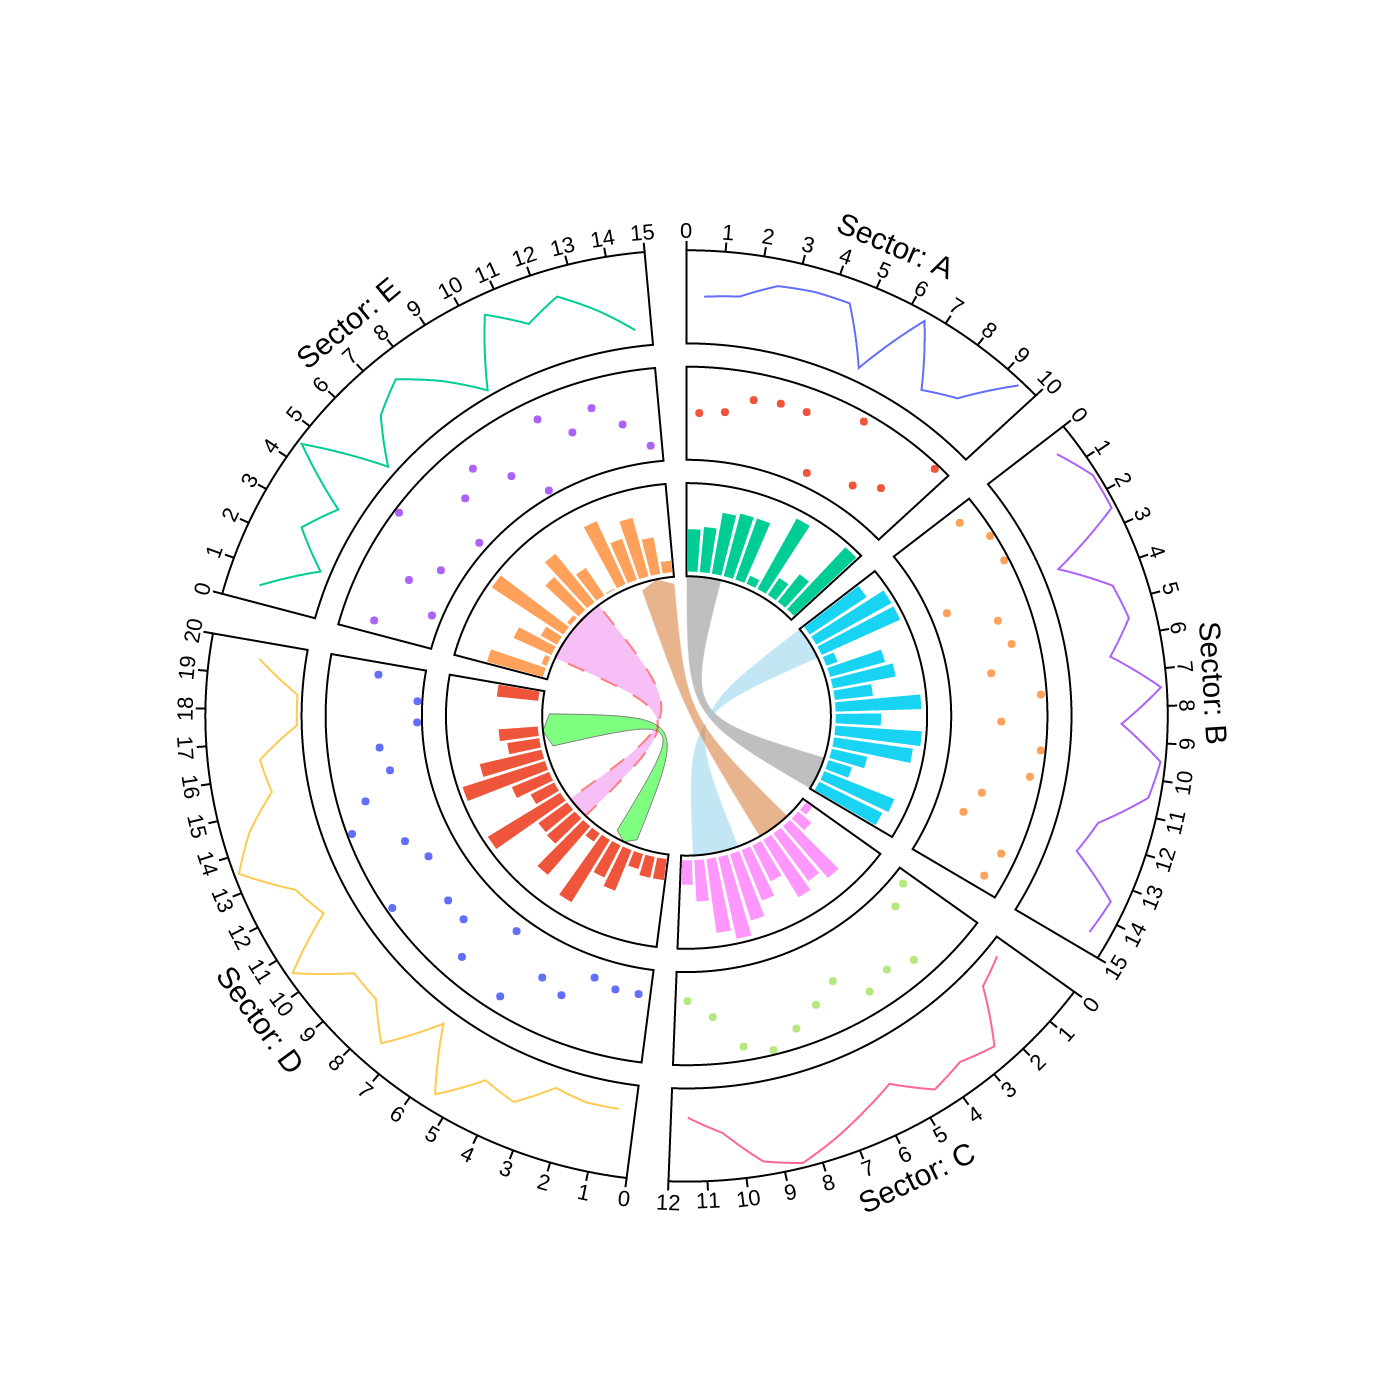
### 1. Circos Plot
|
|
84
|
+
|
|
85
|
+
```python
|
|
86
|
+
from pycirclizely import Circos
|
|
87
|
+
import numpy as np
|
|
88
|
+
np.random.seed(0)
|
|
89
|
+
|
|
90
|
+
# Initialize Circos sectors
|
|
91
|
+
sectors = {"A": 10, "B": 15, "C": 12, "D": 20, "E": 15}
|
|
92
|
+
circos = Circos(sectors, space=5)
|
|
93
|
+
|
|
94
|
+
for sector in circos.sectors:
|
|
95
|
+
# Plot sector name
|
|
96
|
+
sector.text(f"Sector: {sector.name}", r=110, font=dict(size=15))
|
|
97
|
+
# Create x positions & random y values
|
|
98
|
+
x = np.arange(sector.start, sector.end) + 0.5
|
|
99
|
+
y = np.random.randint(0, 100, len(x))
|
|
100
|
+
# Plot lines
|
|
101
|
+
track1 = sector.add_track((80, 100), r_pad_ratio=0.1)
|
|
102
|
+
track1.xticks_by_interval(interval=1)
|
|
103
|
+
track1.axis()
|
|
104
|
+
track1.line(x, y)
|
|
105
|
+
# Plot points
|
|
106
|
+
track2 = sector.add_track((55, 75), r_pad_ratio=0.1)
|
|
107
|
+
track2.axis()
|
|
108
|
+
track2.scatter(x, y)
|
|
109
|
+
# Plot bars
|
|
110
|
+
track3 = sector.add_track((30, 50), r_pad_ratio=0.1)
|
|
111
|
+
track3.axis()
|
|
112
|
+
track3.bar(x, y)
|
|
113
|
+
|
|
114
|
+
# Plot links
|
|
115
|
+
circos.link(("A", 0, 3), ("B", 15, 12))
|
|
116
|
+
circos.link(("B", 0, 3), ("C", 7, 11), fillcolor="skyblue")
|
|
117
|
+
circos.link(("C", 2, 5), ("E", 15, 12), fillcolor="chocolate", direction=1)
|
|
118
|
+
circos.link(
|
|
119
|
+
("D", 3, 5), ("D", 18, 15), fillcolor="lime",
|
|
120
|
+
line=dict(color="black", width=0.5), direction=2,
|
|
121
|
+
)
|
|
122
|
+
circos.link(
|
|
123
|
+
("D", 8, 10), ("E", 2, 8), fillcolor="violet",
|
|
124
|
+
line=dict(color="red", width=1.0, dash="dash"),
|
|
125
|
+
)
|
|
126
|
+
|
|
127
|
+
fig = circos.plotfig()
|
|
128
|
+
fig.write_image("example01.png", format="png")
|
|
129
|
+
```
|
|
130
|
+
|
|
131
|
+
|
|
132
|
+
|
|
133
|
+
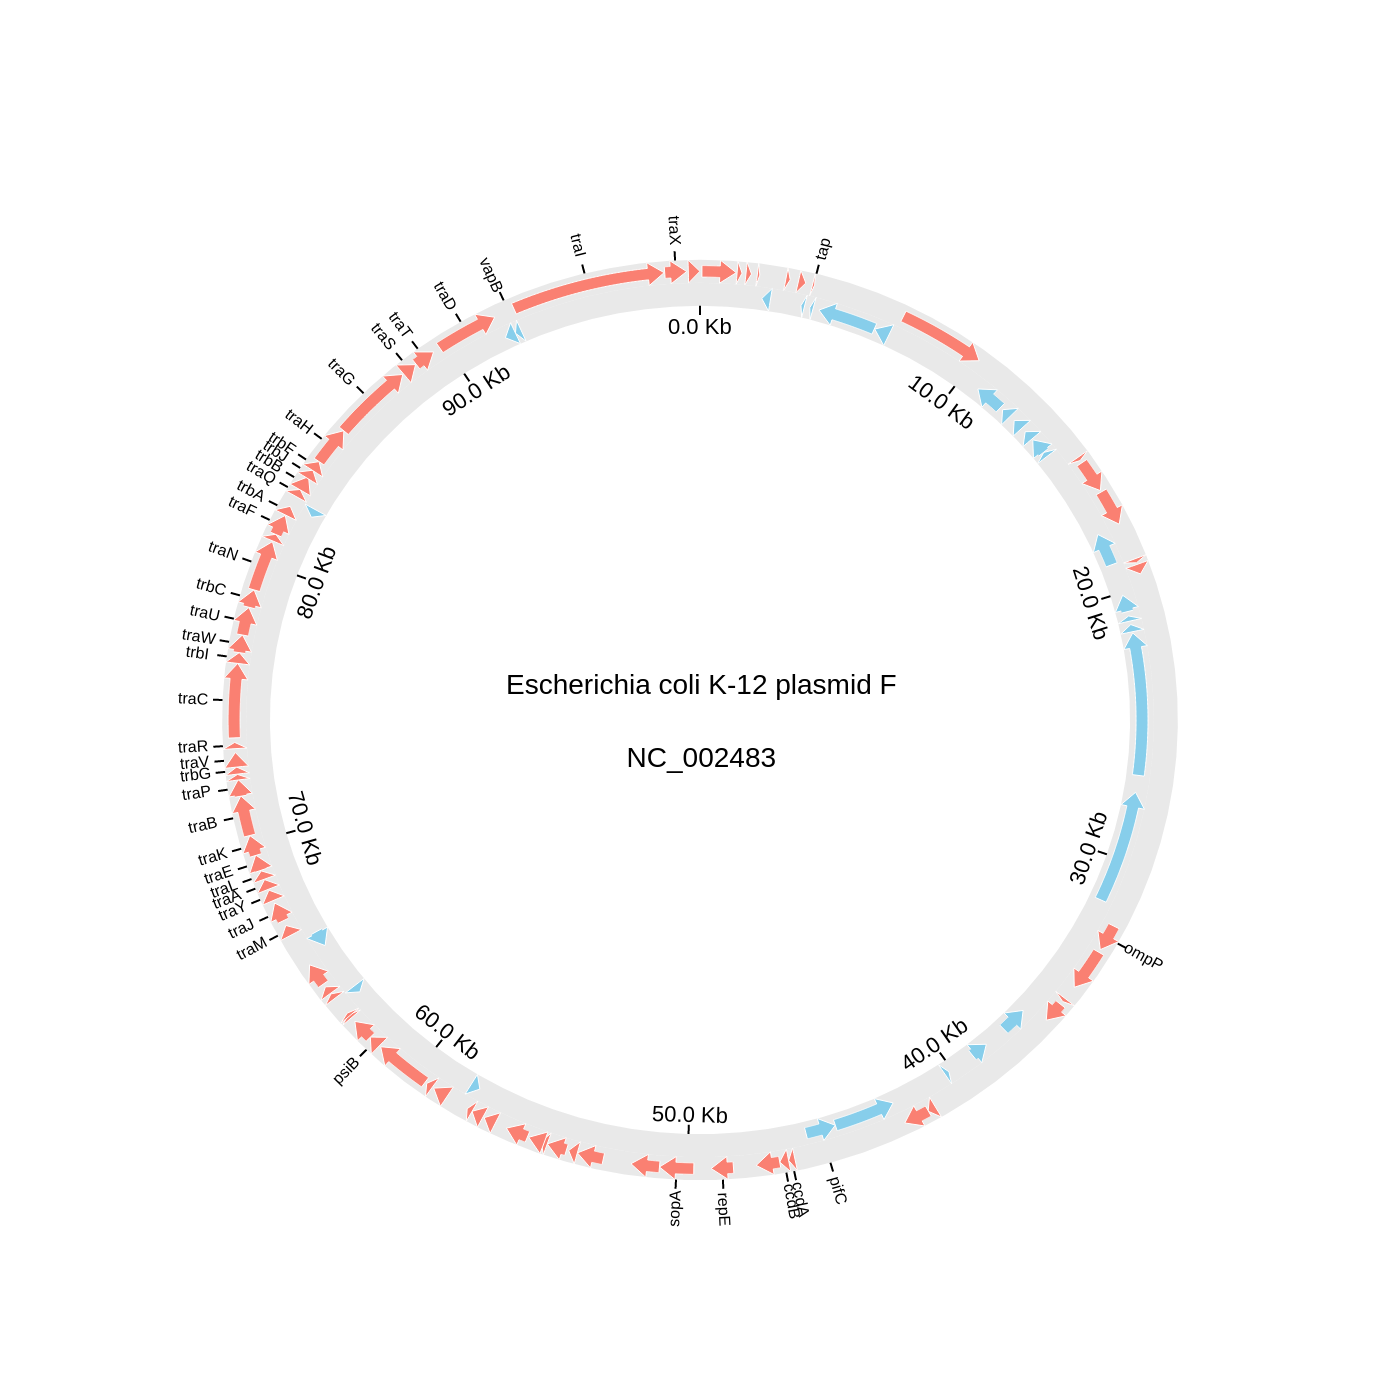
### 2. Circos Plot (Genomics)
|
|
134
|
+
|
|
135
|
+
```python
|
|
136
|
+
from pycirclizely import Circos
|
|
137
|
+
from pycirclizely.utils import fetch_genbank_by_accid
|
|
138
|
+
from pycirclizely.parser import Genbank
|
|
139
|
+
|
|
140
|
+
# Download `NC_002483` E.coli plasmid genbank
|
|
141
|
+
gbk_fetch_data = fetch_genbank_by_accid("NC_002483")
|
|
142
|
+
gbk = Genbank(gbk_fetch_data)
|
|
143
|
+
|
|
144
|
+
# Initialize Circos instance with genome size
|
|
145
|
+
sectors = gbk.get_seqid2size()
|
|
146
|
+
space = 0 if len(sectors) == 1 else 2
|
|
147
|
+
circos = Circos(sectors, space=space)
|
|
148
|
+
circos.text(f"Escherichia coli K-12 plasmid F<br><br>{gbk.name}", font=dict(size=14))
|
|
149
|
+
|
|
150
|
+
seqid2features = gbk.get_seqid2features(feature_type="CDS")
|
|
151
|
+
for sector in circos.sectors:
|
|
152
|
+
# Setup track for features plot
|
|
153
|
+
f_cds_track = sector.add_track((95, 100))
|
|
154
|
+
f_cds_track.axis(fillcolor="lightgrey", line=dict(width=0), opacity=0.5)
|
|
155
|
+
r_cds_track = sector.add_track((90, 95))
|
|
156
|
+
r_cds_track.axis(fillcolor="lightgrey", line=dict(width=0), opacity=0.5)
|
|
157
|
+
# Plot forward/reverse strand CDS
|
|
158
|
+
features = seqid2features[sector.name]
|
|
159
|
+
for feature in features:
|
|
160
|
+
if feature.location.strand == 1:
|
|
161
|
+
f_cds_track.genomic_features(
|
|
162
|
+
feature, plotstyle="arrow", fillcolor="salmon", line=dict(width=0.5)
|
|
163
|
+
)
|
|
164
|
+
else:
|
|
165
|
+
r_cds_track.genomic_features(
|
|
166
|
+
feature, plotstyle="arrow", fillcolor="skyblue", line=dict(width=0.5)
|
|
167
|
+
)
|
|
168
|
+
# Plot 'gene' qualifier label if exists
|
|
169
|
+
labels, label_pos_list = [], []
|
|
170
|
+
for feature in features:
|
|
171
|
+
start = int(feature.location.start)
|
|
172
|
+
end = int(feature.location.end)
|
|
173
|
+
label_pos = (start + end) / 2
|
|
174
|
+
gene_name = feature.qualifiers.get("gene", [None])[0]
|
|
175
|
+
if gene_name is not None:
|
|
176
|
+
labels.append(gene_name)
|
|
177
|
+
label_pos_list.append(label_pos)
|
|
178
|
+
f_cds_track.xticks(
|
|
179
|
+
label_pos_list, labels, label_orientation="vertical", text_kws=dict(font=dict(size=8))
|
|
180
|
+
)
|
|
181
|
+
|
|
182
|
+
# Plot xticks (interval = 10 Kb)
|
|
183
|
+
r_cds_track.xticks_by_interval(
|
|
184
|
+
10000, outer=False, label_formatter=lambda v: f"{v/1000:.1f} Kb"
|
|
185
|
+
)
|
|
186
|
+
|
|
187
|
+
fig = circos.plotfig()
|
|
188
|
+
fig.write_image("example02.png", format="png")
|
|
189
|
+
```
|
|
190
|
+
|
|
191
|
+
|
|
192
|
+
|
|
193
|
+
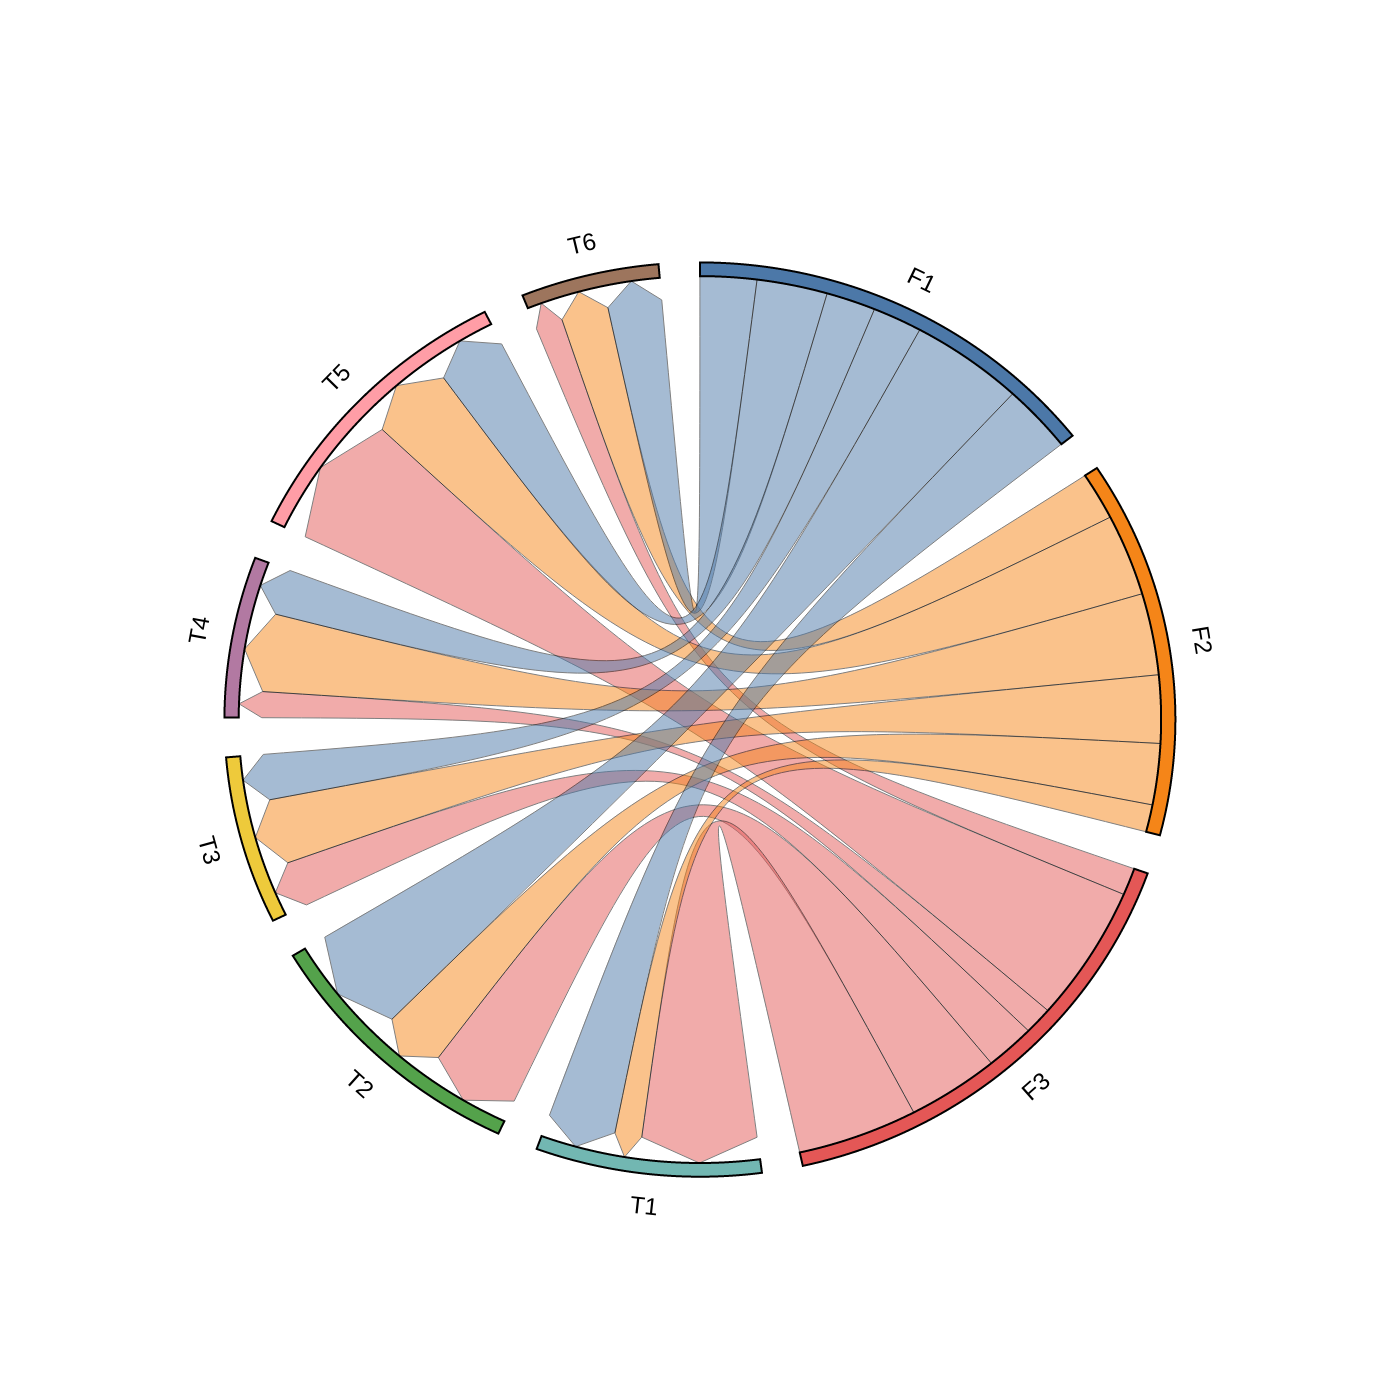
### 3. Chord Diagram
|
|
194
|
+
|
|
195
|
+
```python
|
|
196
|
+
from pycirclizely import Circos
|
|
197
|
+
import pandas as pd
|
|
198
|
+
|
|
199
|
+
# Create matrix dataframe (3 x 6)
|
|
200
|
+
row_names = ["F1", "F2", "F3"]
|
|
201
|
+
col_names = ["T1", "T2", "T3", "T4", "T5", "T6"]
|
|
202
|
+
matrix_data = [
|
|
203
|
+
[10, 16, 7, 7, 10, 8],
|
|
204
|
+
[4, 9, 10, 12, 12, 7],
|
|
205
|
+
[17, 13, 7, 4, 20, 4],
|
|
206
|
+
]
|
|
207
|
+
matrix_df = pd.DataFrame(matrix_data, index=row_names, columns=col_names)
|
|
208
|
+
|
|
209
|
+
# Initialize Circos instance for chord diagram plot
|
|
210
|
+
circos = Circos.chord_diagram(
|
|
211
|
+
matrix_df,
|
|
212
|
+
space=5,
|
|
213
|
+
cmap="T10",
|
|
214
|
+
label_kws=dict(font=dict(size=12)),
|
|
215
|
+
link_kws=dict(line=dict(color="black", width=0.5), direction=1),
|
|
216
|
+
)
|
|
217
|
+
|
|
218
|
+
fig = circos.plotfig()
|
|
219
|
+
fig.write_image("example03.png", format="png")
|
|
220
|
+
```
|
|
221
|
+
|
|
222
|
+
|
|
223
|
+
|
|
224
|
+
### 4. Phylogenetic Tree
|
|
225
|
+
|
|
226
|
+
```python
|
|
227
|
+
from plotly import graph_objects as go
|
|
228
|
+
from pycirclizely import Circos
|
|
229
|
+
from pycirclizely.utils import load_example_tree_file, ColorCycler
|
|
230
|
+
|
|
231
|
+
# Initialize Circos from phylogenetic tree
|
|
232
|
+
tree_file = load_example_tree_file("large_example.nwk")
|
|
233
|
+
circos, tv = Circos.initialize_from_tree(
|
|
234
|
+
tree_file,
|
|
235
|
+
r_lim=(30, 100),
|
|
236
|
+
leaf_label_size=5,
|
|
237
|
+
line_kws=dict(line=dict(color="lightgrey", width=1.0)),
|
|
238
|
+
)
|
|
239
|
+
|
|
240
|
+
# Define group-species dict for tree annotation
|
|
241
|
+
# In this example, set minimum species list to specify group's MRCA node
|
|
242
|
+
group_name2species_list = dict(
|
|
243
|
+
Monotremata=["Tachyglossus_aculeatus", "Ornithorhynchus_anatinus"],
|
|
244
|
+
Marsupialia=["Monodelphis_domestica", "Vombatus_ursinus"],
|
|
245
|
+
Xenarthra=["Choloepus_didactylus", "Dasypus_novemcinctus"],
|
|
246
|
+
Afrotheria=["Trichechus_manatus", "Chrysochloris_asiatica"],
|
|
247
|
+
Euarchontes=["Galeopterus_variegatus", "Theropithecus_gelada"],
|
|
248
|
+
Glires=["Oryctolagus_cuniculus", "Microtus_oregoni"],
|
|
249
|
+
Laurasiatheria=["Talpa_occidentalis", "Mirounga_leonina"],
|
|
250
|
+
)
|
|
251
|
+
# Set tree line color & label color
|
|
252
|
+
color_cycler = ColorCycler("T10")
|
|
253
|
+
groups = list(group_name2species_list.keys())
|
|
254
|
+
colors = color_cycler.get_colors(len(groups))[::-1]
|
|
255
|
+
group_name2color = {name: color for name, color in zip(groups, colors)}
|
|
256
|
+
for group_name, species_list in group_name2species_list.items():
|
|
257
|
+
color = group_name2color[group_name]
|
|
258
|
+
tv.set_node_line_props(
|
|
259
|
+
species_list, line=dict(color=color), apply_label_color=True
|
|
260
|
+
)
|
|
261
|
+
|
|
262
|
+
# Plot figure & set legend on center
|
|
263
|
+
fig = circos.plotfig()
|
|
264
|
+
for group_name, color in group_name2color.items():
|
|
265
|
+
# Use a dummy trace to create a legend entry
|
|
266
|
+
fig.add_trace(
|
|
267
|
+
go.Scatter(
|
|
268
|
+
x=[None],
|
|
269
|
+
y=None,
|
|
270
|
+
mode="markers",
|
|
271
|
+
marker=dict(color=color, size=10),
|
|
272
|
+
name=group_name,
|
|
273
|
+
showlegend=True,
|
|
274
|
+
)
|
|
275
|
+
)
|
|
276
|
+
|
|
277
|
+
fig.update_layout(
|
|
278
|
+
legend=dict(
|
|
279
|
+
x=0.5,
|
|
280
|
+
y=0.47,
|
|
281
|
+
xanchor="center",
|
|
282
|
+
yanchor="middle",
|
|
283
|
+
font=dict(size=10),
|
|
284
|
+
bgcolor="rgba(255,255,255,0.0)",
|
|
285
|
+
)
|
|
286
|
+
)
|
|
287
|
+
|
|
288
|
+
fig.write_image("example04.png", format="png", scale=2)
|
|
289
|
+
```
|
|
290
|
+
|
|
291
|
+
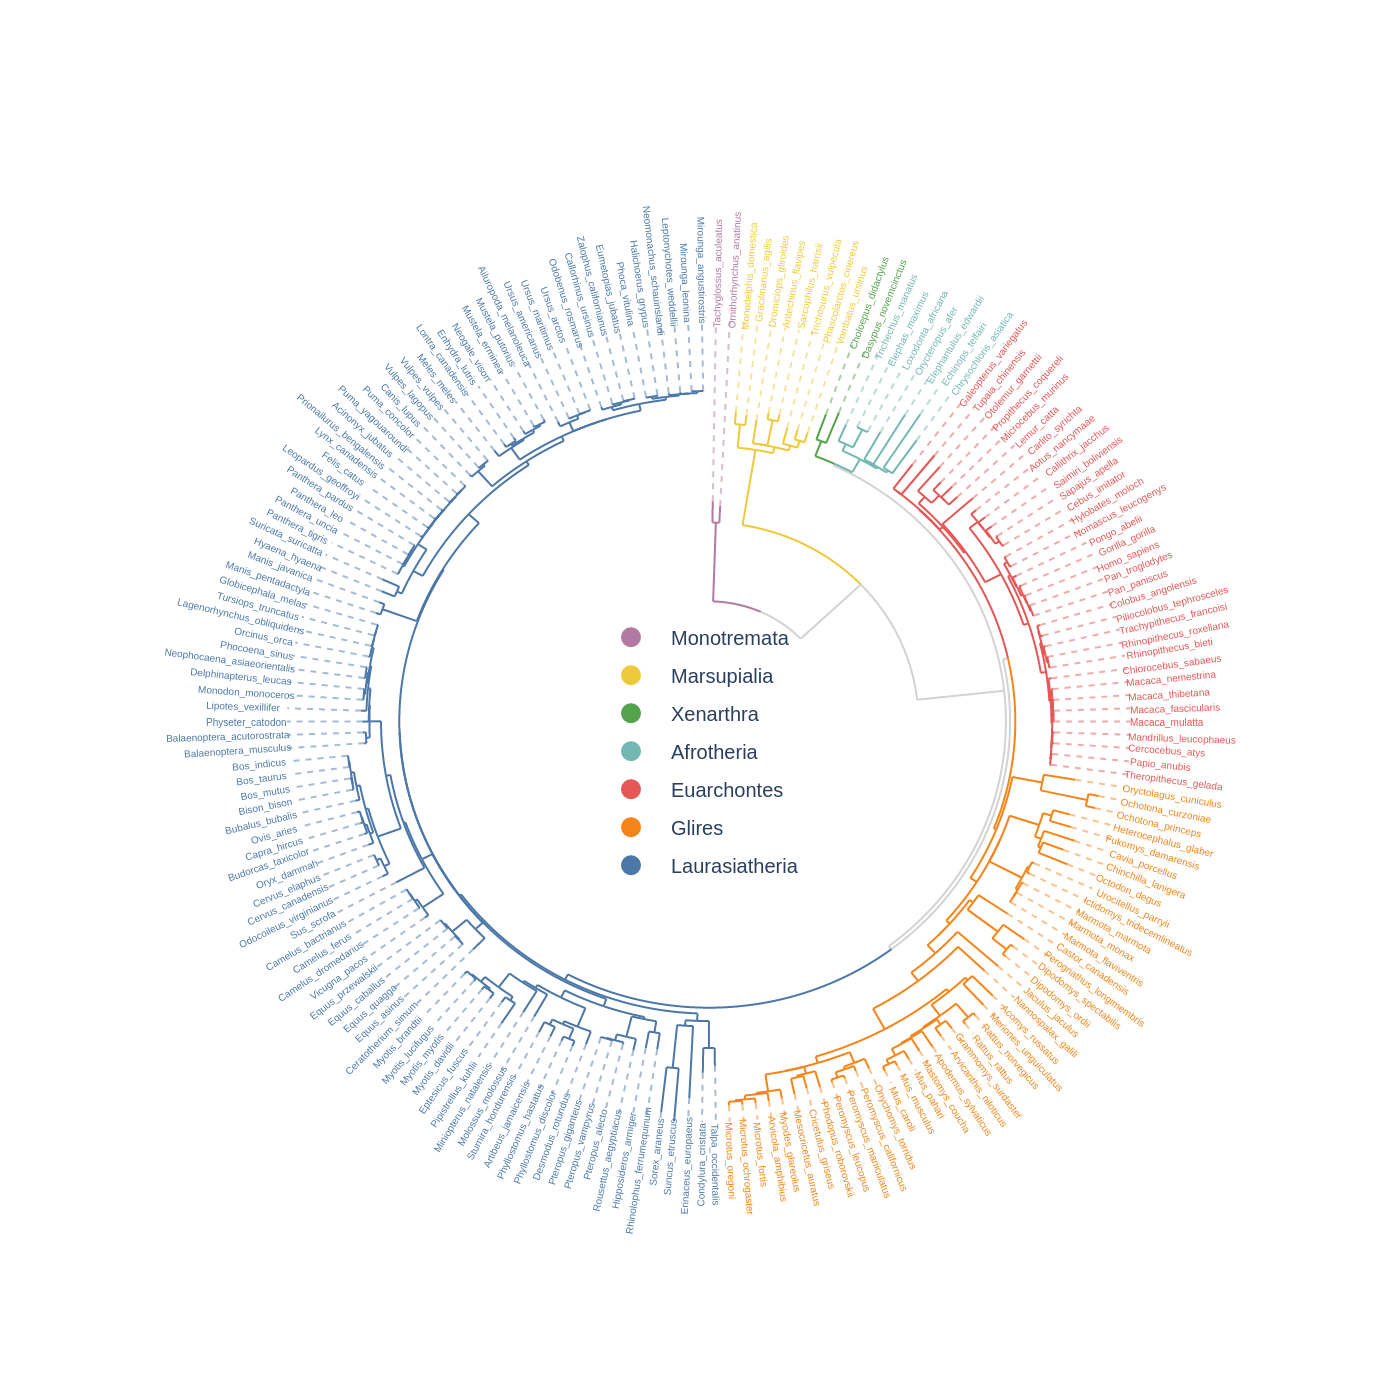
|
|
292
|
+
|
|
293
|
+
### 5. Radar Chart
|
|
294
|
+
|
|
295
|
+
```python
|
|
296
|
+
from pycirclizely import Circos
|
|
297
|
+
import pandas as pd
|
|
298
|
+
|
|
299
|
+
# Create RPG jobs parameter dataframe (3 jobs, 7 parameters)
|
|
300
|
+
df = pd.DataFrame(
|
|
301
|
+
data=[
|
|
302
|
+
[80, 80, 80, 80, 80, 80, 80],
|
|
303
|
+
[90, 20, 95, 95, 30, 30, 80],
|
|
304
|
+
[60, 90, 20, 20, 100, 90, 50],
|
|
305
|
+
],
|
|
306
|
+
index=["Hero", "Warrior", "Wizard"],
|
|
307
|
+
columns=["HP", "MP", "ATK", "DEF", "SP.ATK", "SP.DEF", "SPD"],
|
|
308
|
+
)
|
|
309
|
+
|
|
310
|
+
# Initialize Circos instance for radar chart plot
|
|
311
|
+
circos = Circos.radar_chart(
|
|
312
|
+
df,
|
|
313
|
+
vmax=100,
|
|
314
|
+
marker_size=6,
|
|
315
|
+
grid_interval_ratio=0.2,
|
|
316
|
+
)
|
|
317
|
+
|
|
318
|
+
# Plot figure & set legend on upper right
|
|
319
|
+
fig = circos.plotfig()
|
|
320
|
+
fig.write_image("example05.png", format="png", scale=2)
|
|
321
|
+
```
|
|
322
|
+
|
|
323
|
+
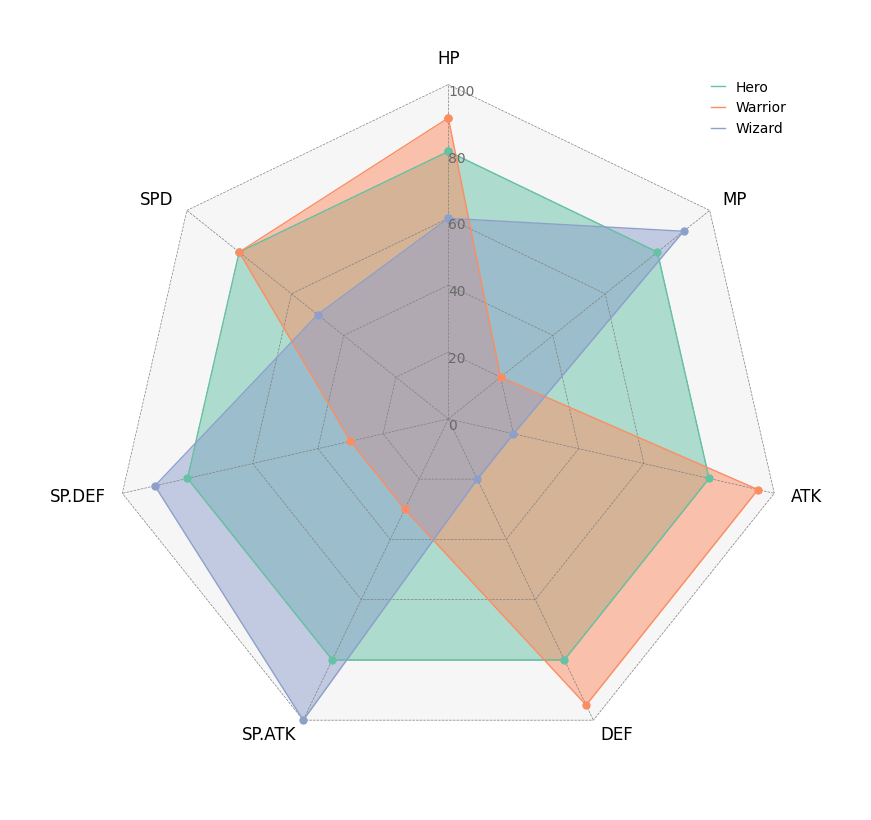
|
|
324
|
+
|
|
325
|
+
## Not Implemented Features
|
|
326
|
+
|
|
327
|
+
Further features to be implemented are the plotly built-in subplot and legend (complementary to the hover text) framework in the package.
|
|
328
|
+
|
|
329
|
+
Moreover, support for other types of hover info besides hover text will improve the user-plot interaction.
|