progress-table 3.0.1__tar.gz → 3.1.0__tar.gz
This diff represents the content of publicly available package versions that have been released to one of the supported registries. The information contained in this diff is provided for informational purposes only and reflects changes between package versions as they appear in their respective public registries.
- {progress_table-3.0.1 → progress_table-3.1.0}/.gitignore +2 -0
- {progress_table-3.0.1 → progress_table-3.1.0}/PKG-INFO +11 -10
- {progress_table-3.0.1 → progress_table-3.1.0}/README.md +2 -1
- progress_table-3.1.0/docs/README.md +133 -0
- progress_table-3.1.0/docs/advanced-usage.md +290 -0
- progress_table-3.1.0/docs/integrations.md +114 -0
- progress_table-3.1.0/docs/v3-notice.md +52 -0
- progress_table-3.1.0/examples/brown2d.py +115 -0
- progress_table-3.1.0/examples/download_v1.py +92 -0
- progress_table-3.1.0/examples/download_v2.py +96 -0
- progress_table-3.1.0/examples/tictactoe.py +85 -0
- progress_table-3.1.0/examples/training.py +138 -0
- {progress_table-3.0.1 → progress_table-3.1.0}/progress_table/__init__.py +1 -1
- {progress_table-3.0.1 → progress_table-3.1.0}/progress_table/progress_table.py +41 -18
- {progress_table-3.0.1 → progress_table-3.1.0}/progress_table/styles.py +0 -2
- {progress_table-3.0.1 → progress_table-3.1.0}/pyproject.toml +20 -5
- {progress_table-3.0.1 → progress_table-3.1.0}/LICENSE.txt +0 -0
- {progress_table-3.0.1 → progress_table-3.1.0}/progress_table/common.py +0 -0
|
@@ -1,6 +1,6 @@
|
|
|
1
1
|
Metadata-Version: 2.4
|
|
2
2
|
Name: progress-table
|
|
3
|
-
Version: 3.0
|
|
3
|
+
Version: 3.1.0
|
|
4
4
|
Summary: Display progress as a pretty table in the command line.
|
|
5
5
|
Project-URL: Home, https://github.com/gahaalt/progress-table
|
|
6
6
|
Project-URL: Documentation, https://github.com/sjmikler/progress-table/blob/main/docs
|
|
@@ -34,7 +34,8 @@ Description-Content-Type: text/markdown
|
|
|
34
34
|
# Progress Table
|
|
35
35
|
|
|
36
36
|
[](https://pypi.org/project/progress-table)
|
|
37
|
-
[](https://
|
|
37
|
+
[](https://github.com/sjmikler/progress-table/blob/main/LICENSE.txt)
|
|
38
|
+
[](https://codecov.io/gh/sjmikler/progress-table)
|
|
38
39
|
|
|
39
40
|
Lightweight utility to display the progress of your process as a pretty table in the command line.
|
|
40
41
|
|
|
@@ -45,11 +46,11 @@ Lightweight utility to display the progress of your process as a pretty table in
|
|
|
45
46
|
|
|
46
47
|
### Change this:
|
|
47
48
|
|
|
48
|
-

|
|
49
|
+
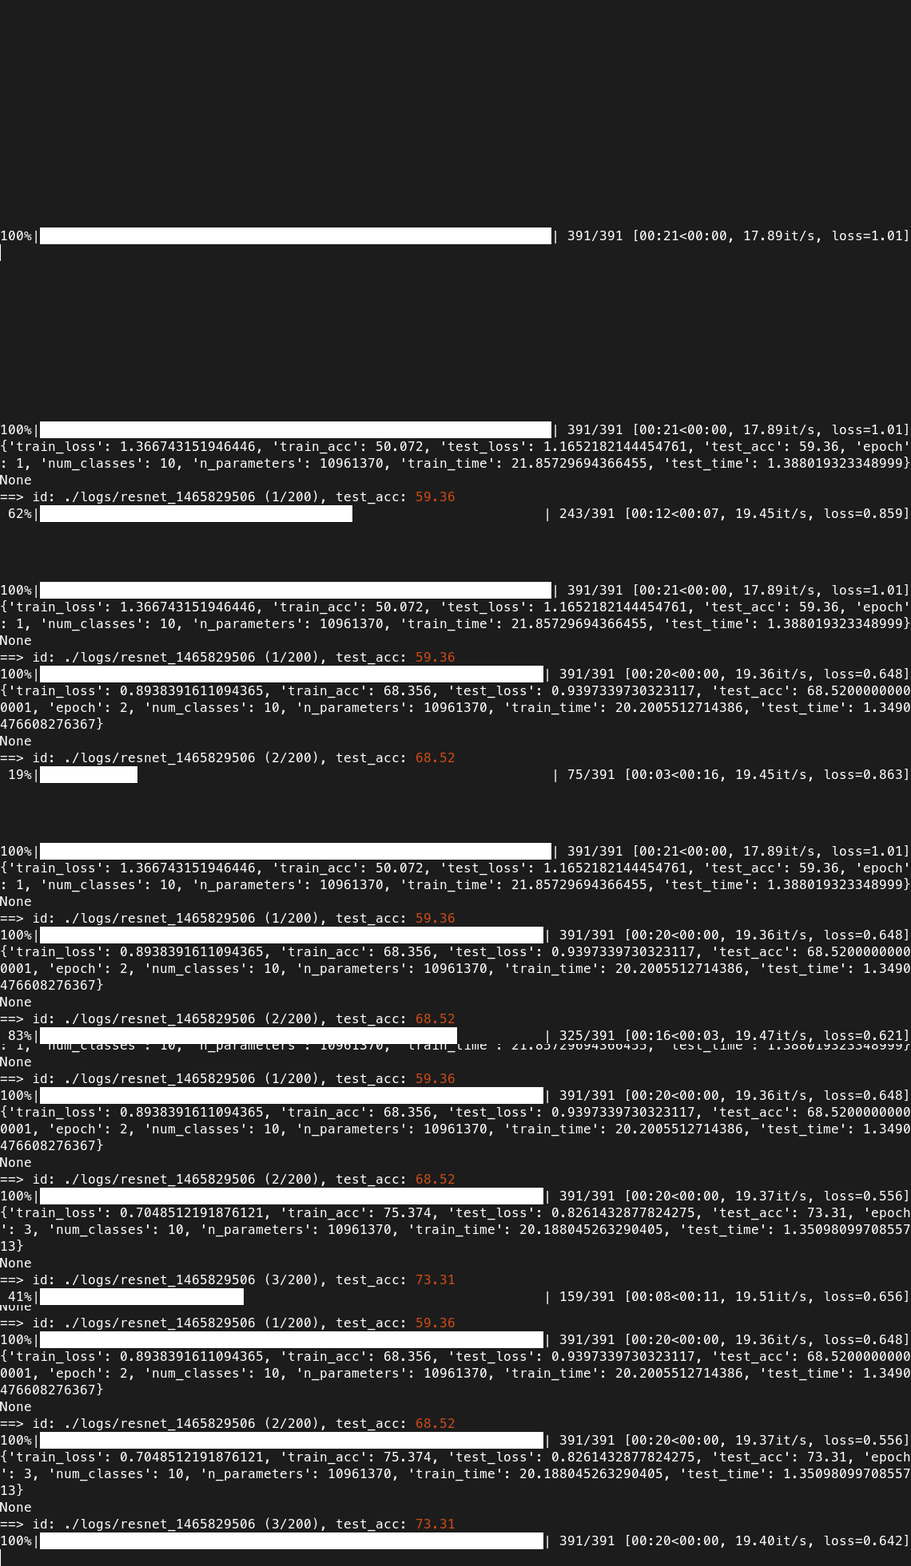
|
|
49
50
|
|
|
50
51
|
### Into this:
|
|
51
52
|
|
|
52
|
-

|
|
53
|
+
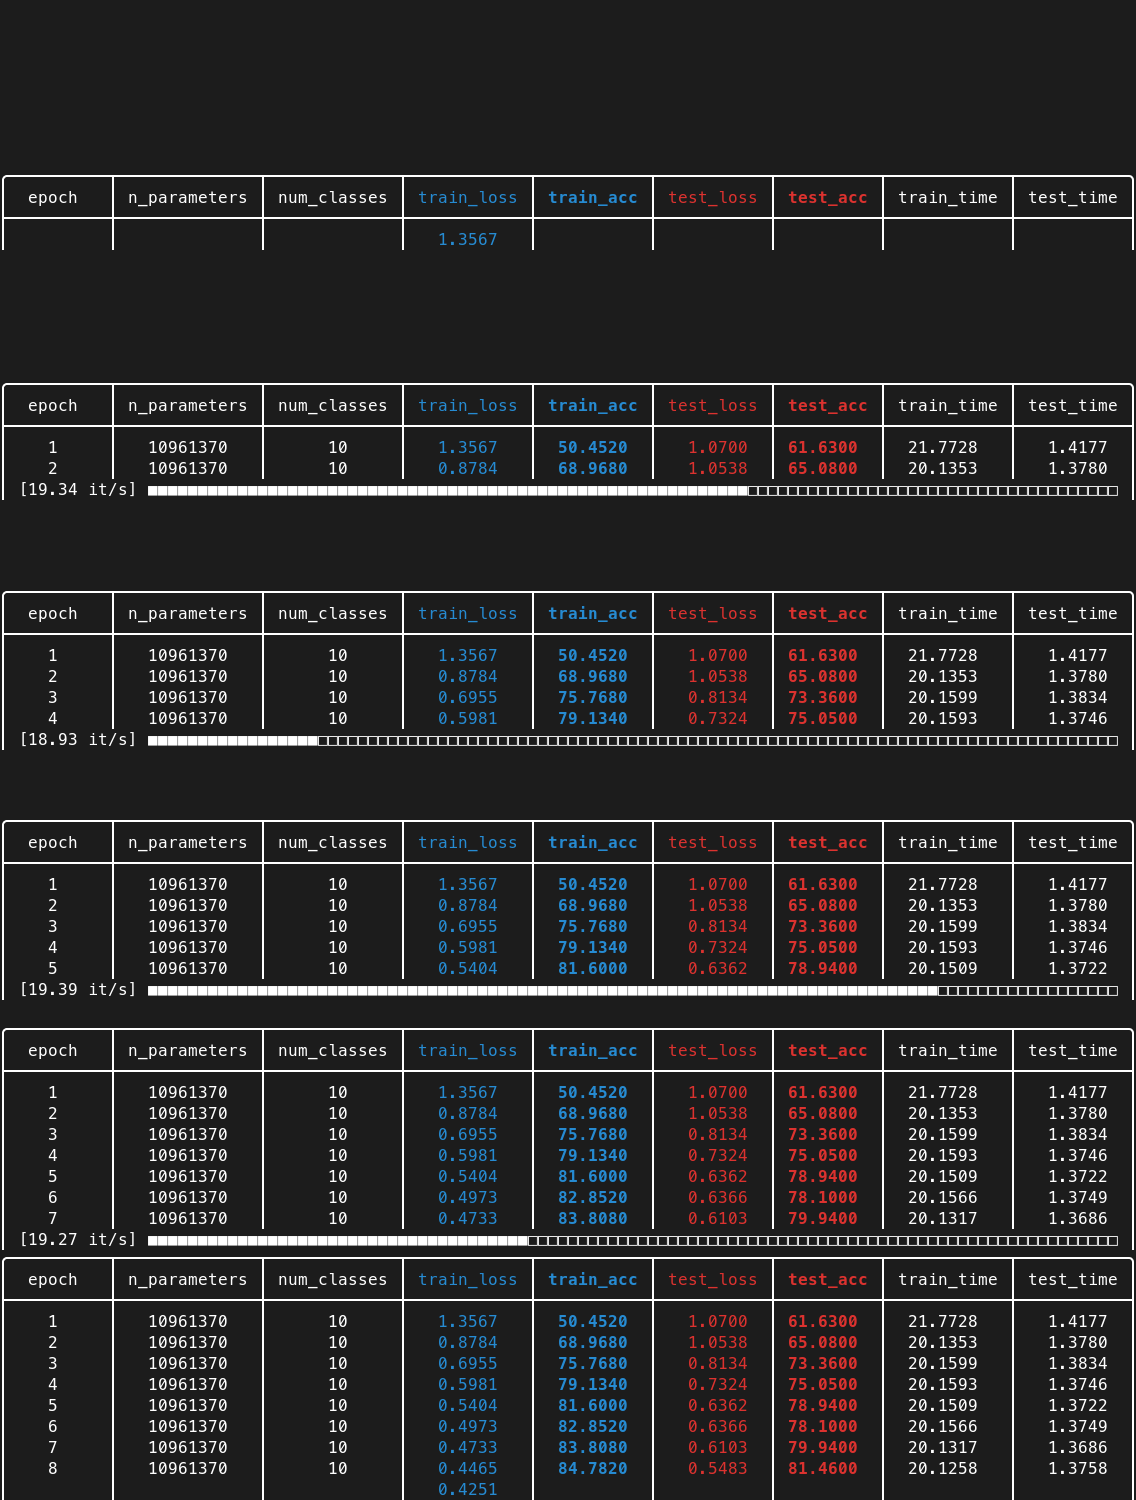
|
|
53
54
|
|
|
54
55
|
## Examples
|
|
55
56
|
|
|
@@ -57,19 +58,19 @@ From `examples/` directory:
|
|
|
57
58
|
|
|
58
59
|
* Neural network training
|
|
59
60
|
|
|
60
|
-

|
|
61
|
+
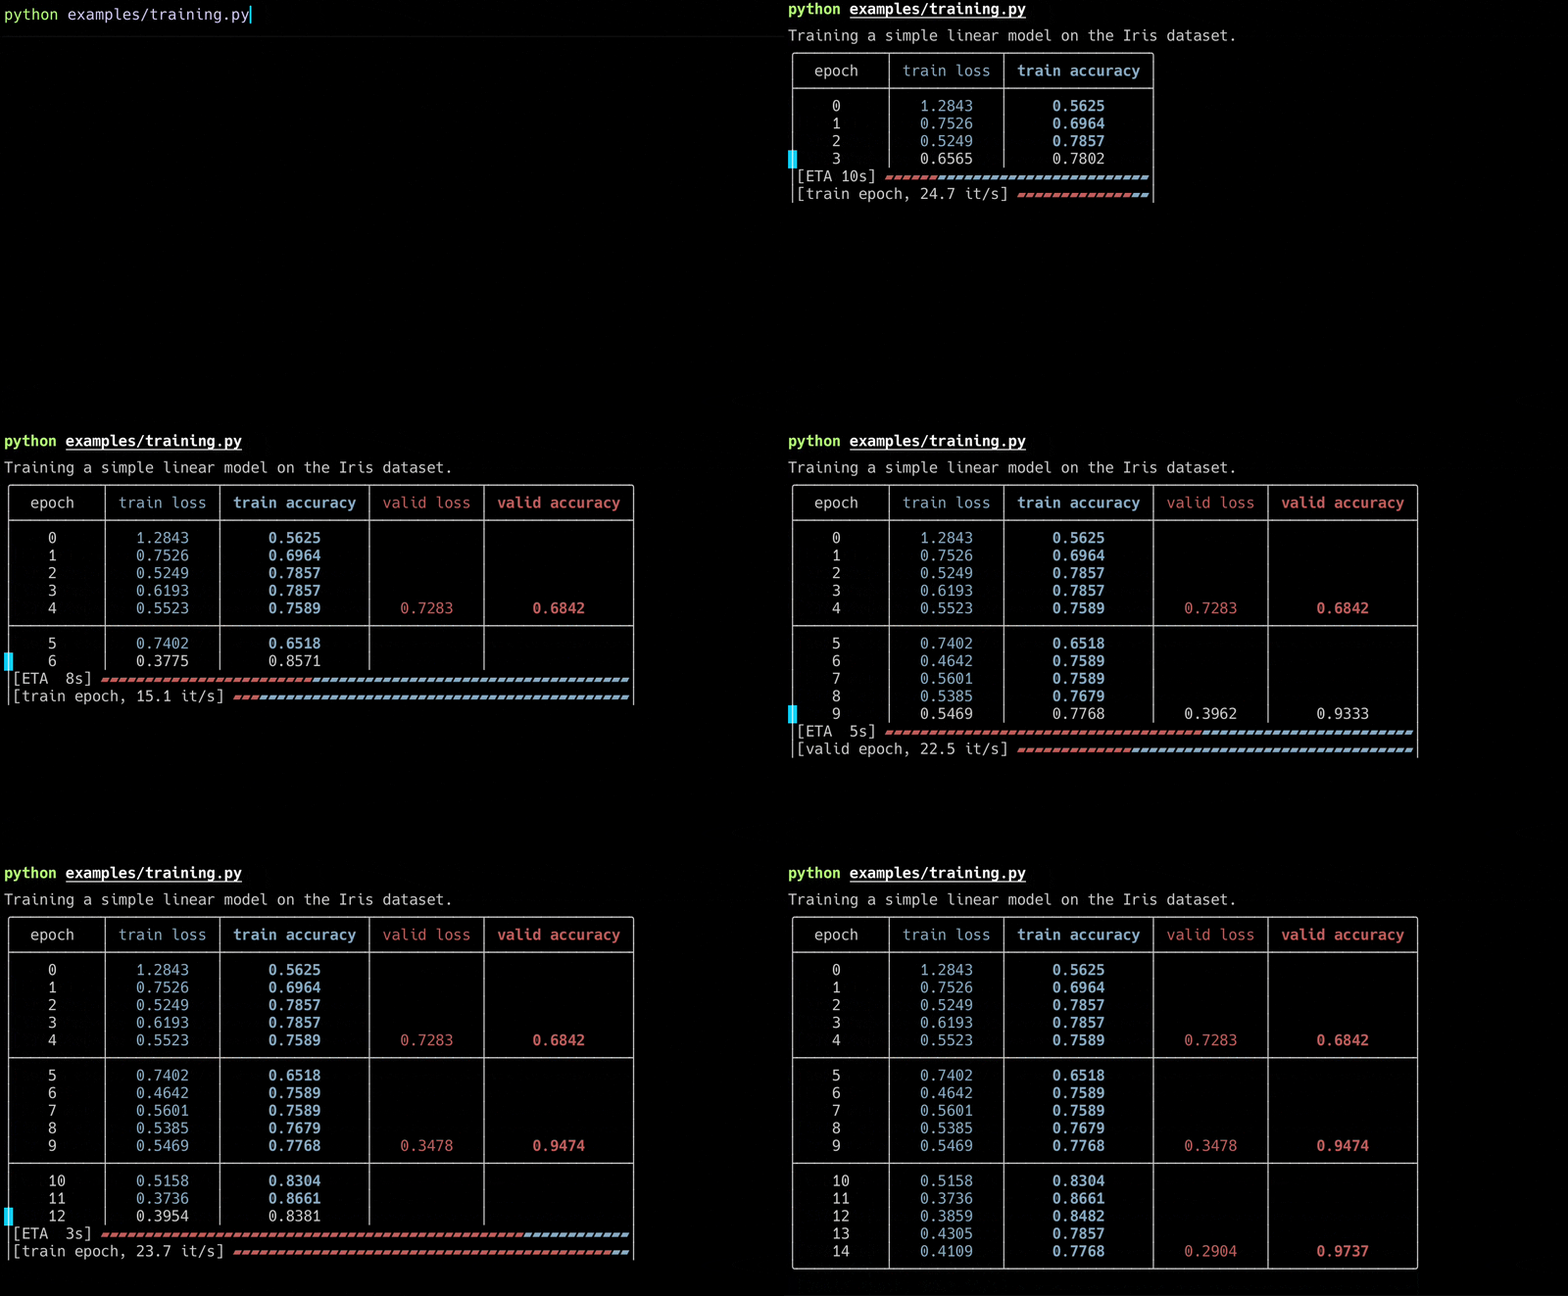
|
|
61
62
|
|
|
62
63
|
* Progress of multi-threaded downloads
|
|
63
64
|
|
|
64
|
-

|
|
65
|
+
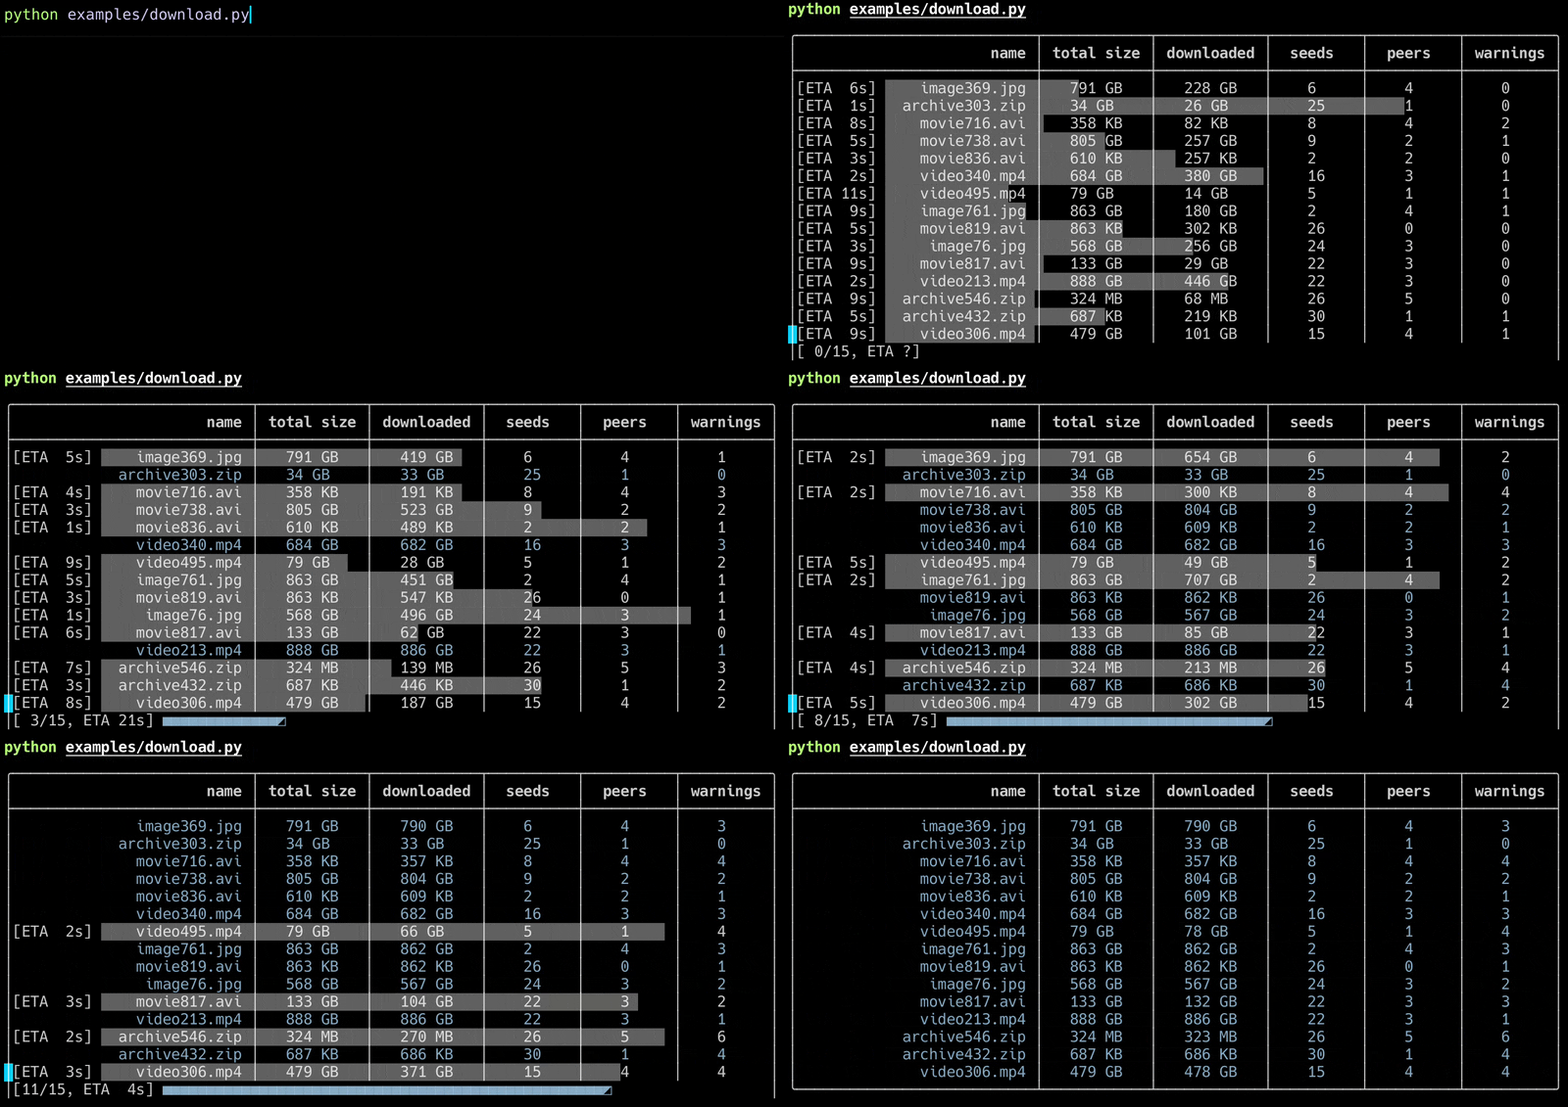
|
|
65
66
|
|
|
66
67
|
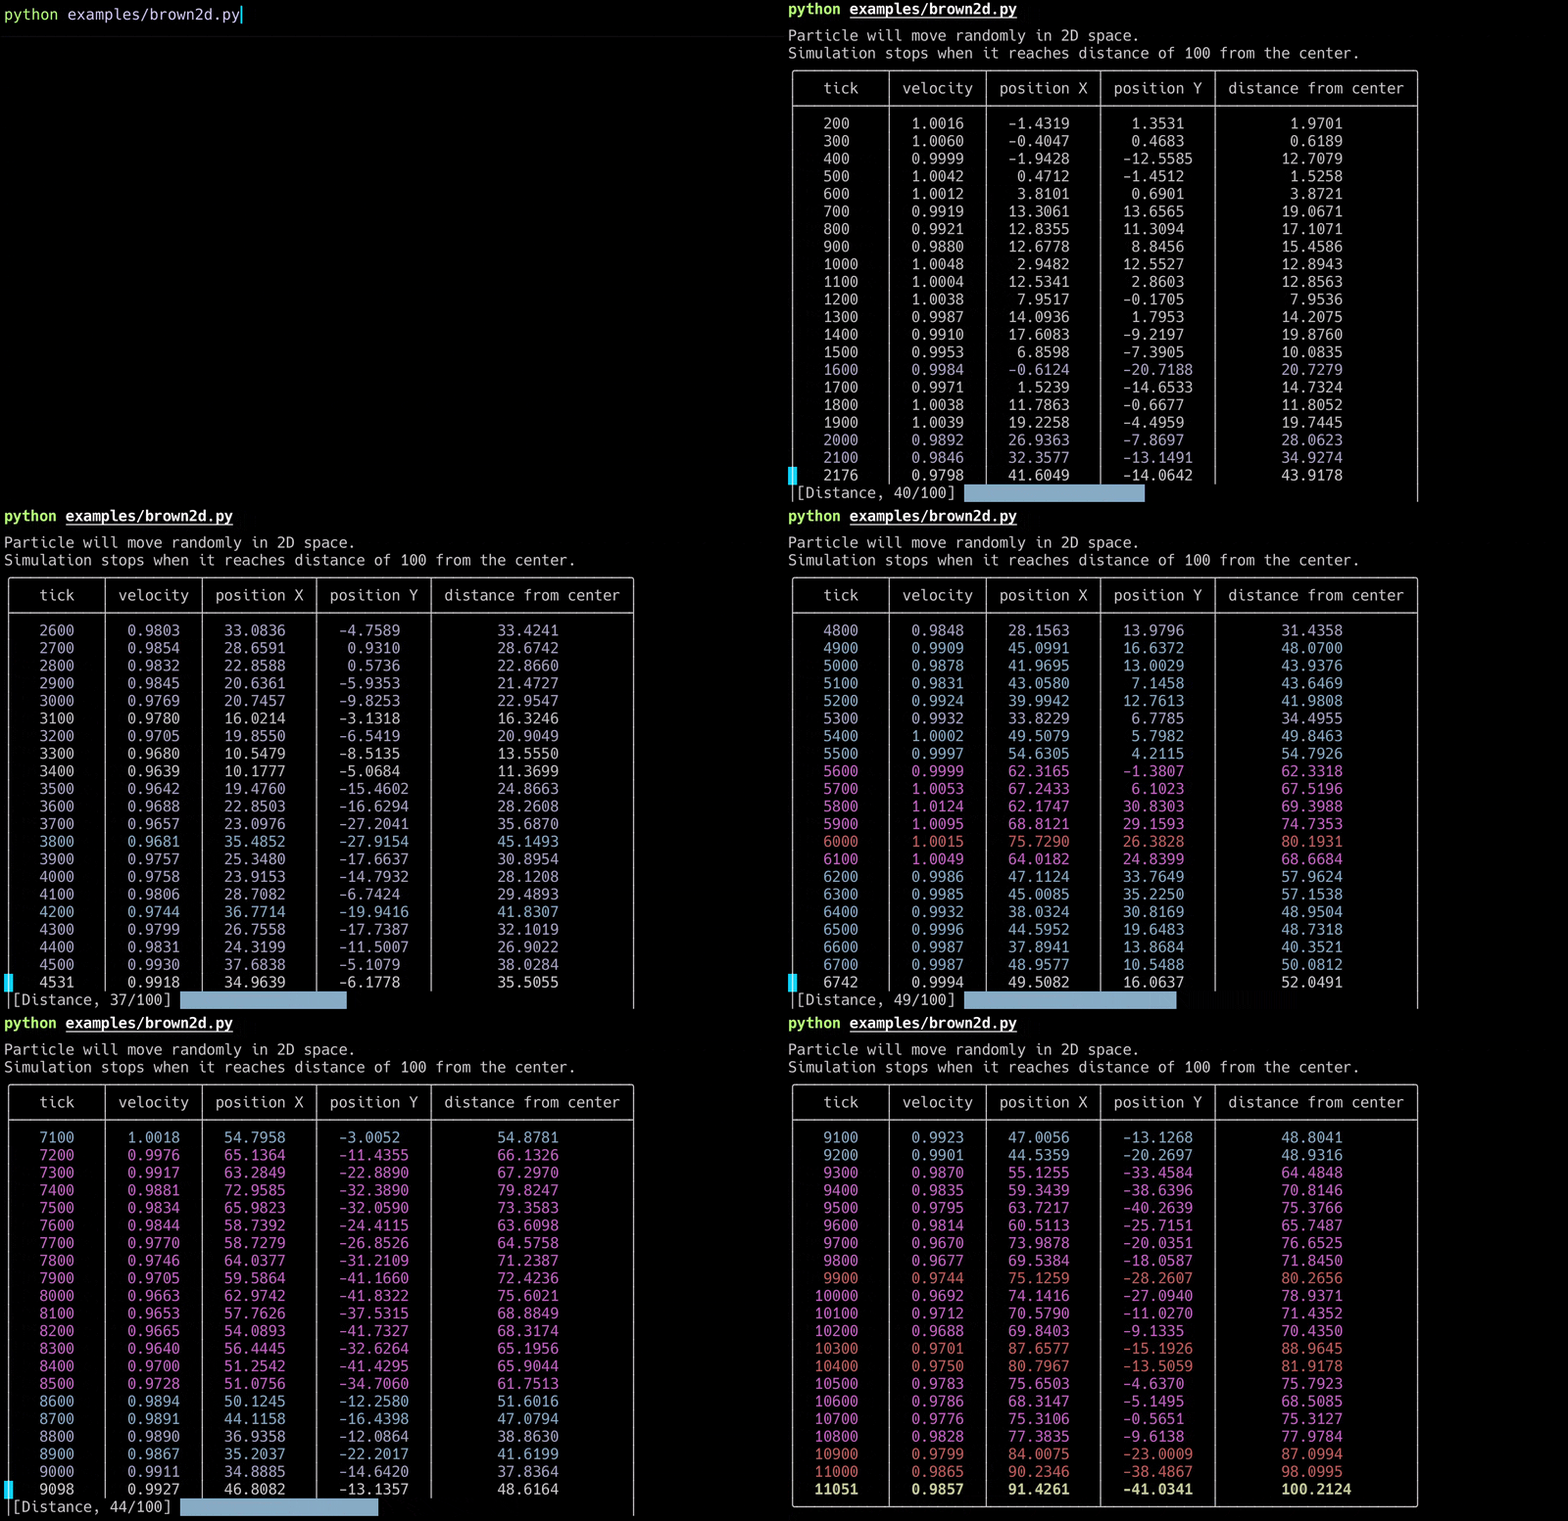
* Simulation and interactive display of Brownian motion
|
|
67
68
|
|
|
68
|
-

|
|
69
|
+
|
|
69
70
|
|
|
70
71
|
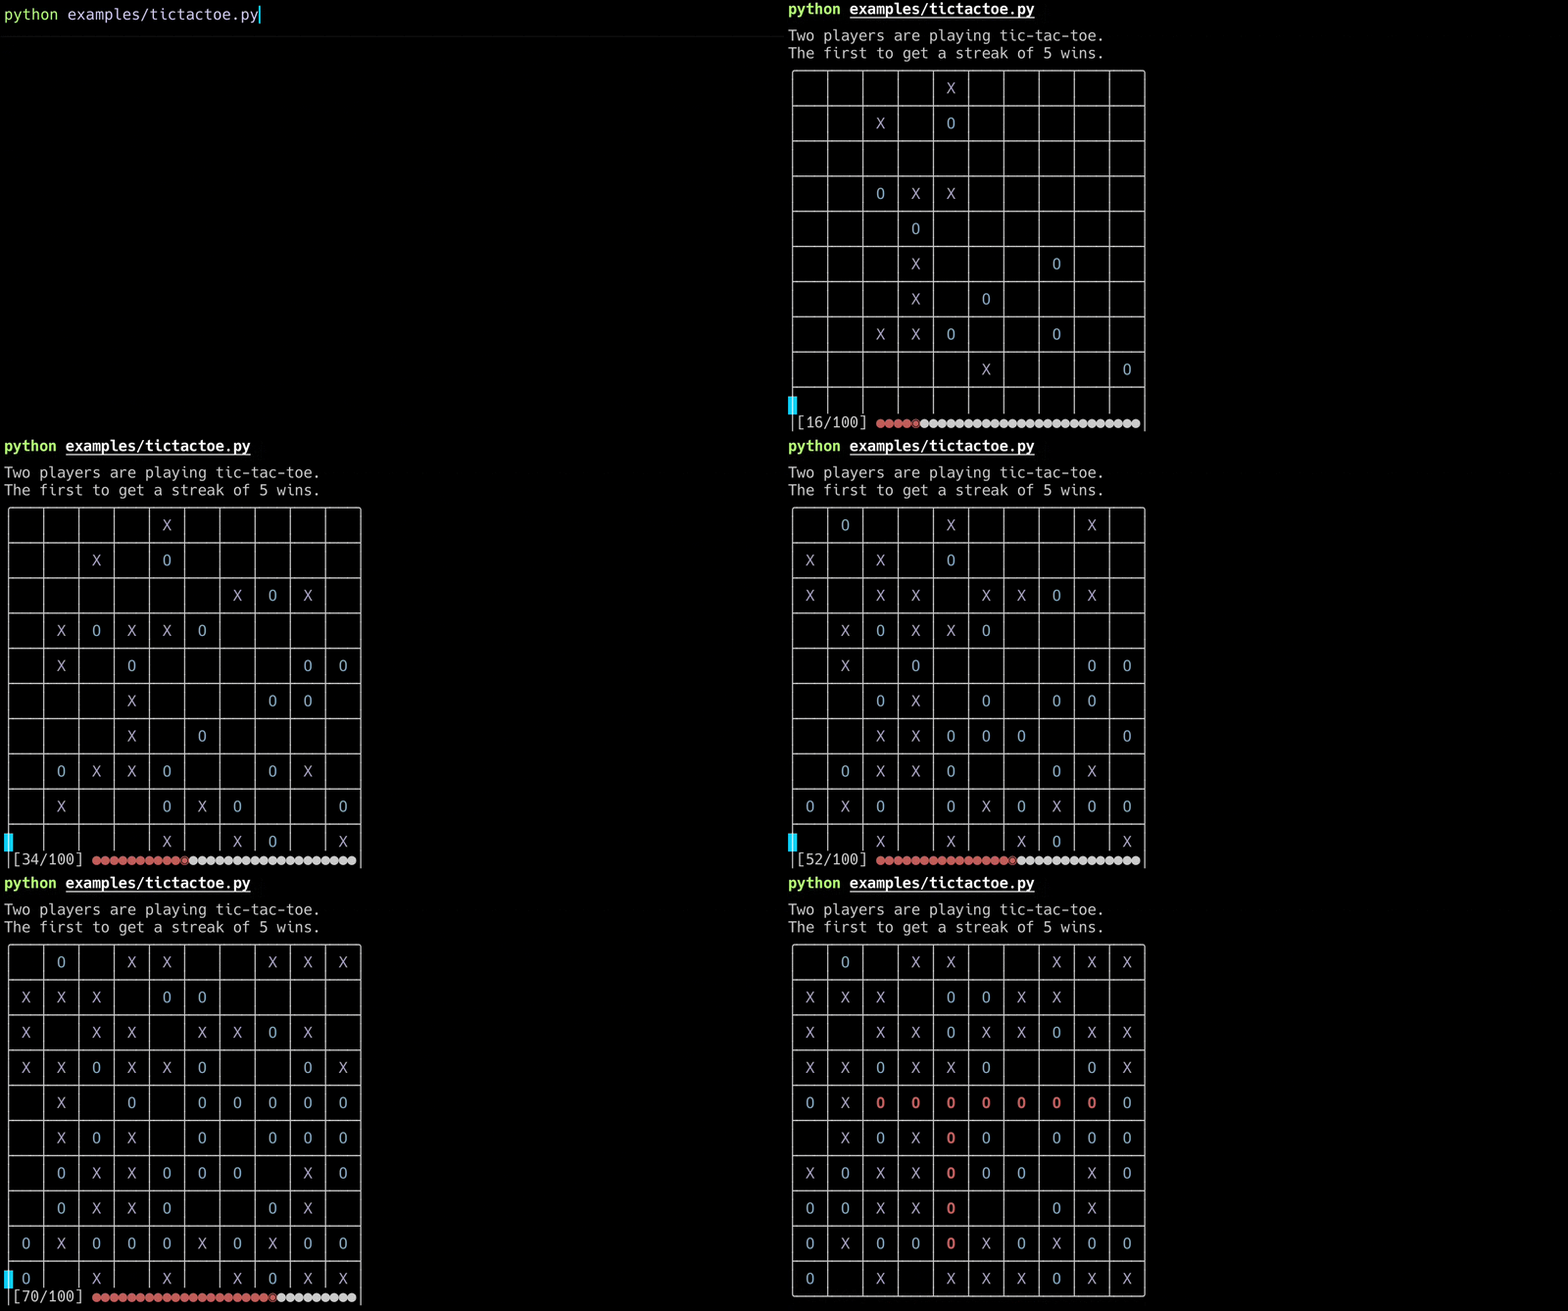
* Display of a game board
|
|
71
72
|
|
|
72
|
-

|
|
73
|
+
|
|
73
74
|
|
|
74
75
|
## Quick start code
|
|
75
76
|
|
|
@@ -110,12 +111,12 @@ table.close()
|
|
|
110
111
|
|
|
111
112
|
```
|
|
112
113
|
|
|
113
|
-
> Go to [integrations](docs
|
|
114
|
+
> Go to [integrations](https://github.com/sjmikler/progress-table/blob/main/docs//integrations.md)
|
|
114
115
|
> page to see examples of integration with deep learning libraries.
|
|
115
116
|
|
|
116
117
|
## Advanced usage
|
|
117
118
|
|
|
118
|
-
Go to [advanced usage](docs
|
|
119
|
+
Go to [advanced usage](https://github.com/sjmikler/progress-table/blob/main/docs//advanced-usage.md) page for more information.
|
|
119
120
|
|
|
120
121
|
## Troubleshooting
|
|
121
122
|
|
|
@@ -7,7 +7,8 @@
|
|
|
7
7
|
# Progress Table
|
|
8
8
|
|
|
9
9
|
[](https://pypi.org/project/progress-table)
|
|
10
|
-
[](https://
|
|
10
|
+
[](https://github.com/sjmikler/progress-table/blob/main/LICENSE.txt)
|
|
11
|
+
[](https://codecov.io/gh/sjmikler/progress-table)
|
|
11
12
|
|
|
12
13
|
Lightweight utility to display the progress of your process as a pretty table in the command line.
|
|
13
14
|
|
|
@@ -0,0 +1,133 @@
|
|
|
1
|
+
> Version 2.x.x introduces new features and new interactive modes.
|
|
2
|
+
>
|
|
3
|
+
> Version 3.x.x improves compatibility and stability.
|
|
4
|
+
>
|
|
5
|
+
> New features allow for previously impossible applications, see examples below.
|
|
6
|
+
|
|
7
|
+
# Progress Table
|
|
8
|
+
|
|
9
|
+
[](https://pypi.org/project/progress-table)
|
|
10
|
+
[](https://github.com/sjmikler/progress-table/blob/main/LICENSE.txt)
|
|
11
|
+
[](https://codecov.io/gh/sjmikler/progress-table)
|
|
12
|
+
|
|
13
|
+
Lightweight utility to display the progress of your process as a pretty table in the command line.
|
|
14
|
+
|
|
15
|
+
* Alternative to TQDM whenever you want to track metrics produced by your process
|
|
16
|
+
* Designed to monitor ML experiments, but works for any metrics-producing process
|
|
17
|
+
* Allows you to see at a glance what's going on with your process
|
|
18
|
+
* Increases readability and simplifies your command line logging
|
|
19
|
+
|
|
20
|
+
### Change this:
|
|
21
|
+
|
|
22
|
+

|
|
23
|
+
|
|
24
|
+
### Into this:
|
|
25
|
+
|
|
26
|
+

|
|
27
|
+
|
|
28
|
+
## Examples
|
|
29
|
+
|
|
30
|
+
From `examples/` directory:
|
|
31
|
+
|
|
32
|
+
* Neural network training
|
|
33
|
+
|
|
34
|
+

|
|
35
|
+
|
|
36
|
+
* Progress of multi-threaded downloads
|
|
37
|
+
|
|
38
|
+

|
|
39
|
+
|
|
40
|
+
* Simulation and interactive display of Brownian motion
|
|
41
|
+
|
|
42
|
+

|
|
43
|
+
|
|
44
|
+
* Display of a game board
|
|
45
|
+
|
|
46
|
+

|
|
47
|
+
|
|
48
|
+
## Quick start code
|
|
49
|
+
|
|
50
|
+
```python
|
|
51
|
+
import random
|
|
52
|
+
import time
|
|
53
|
+
|
|
54
|
+
from progress_table import ProgressTable
|
|
55
|
+
|
|
56
|
+
# Create table object:
|
|
57
|
+
table = ProgressTable(num_decimal_places=1)
|
|
58
|
+
|
|
59
|
+
# You can (optionally) define the columns at the beginning
|
|
60
|
+
table.add_column("x", color="bold red")
|
|
61
|
+
|
|
62
|
+
for step in range(10):
|
|
63
|
+
x = random.randint(0, 200)
|
|
64
|
+
|
|
65
|
+
# You can add entries in a compact way
|
|
66
|
+
table["x"] = x
|
|
67
|
+
|
|
68
|
+
# Or you can use the update method
|
|
69
|
+
table.update("x", value=x, weight=1.0)
|
|
70
|
+
|
|
71
|
+
# Display the progress bar by wrapping an iterator or an integer
|
|
72
|
+
for _ in table(10): # -> Equivalent to `table(range(10))`
|
|
73
|
+
# Set and get values from the table
|
|
74
|
+
table["y"] = random.randint(0, 200)
|
|
75
|
+
table["x-y"] = table["x"] - table["y"]
|
|
76
|
+
table.update("average x-y", value=table["x-y"], weight=1.0, aggregate="mean")
|
|
77
|
+
time.sleep(0.1)
|
|
78
|
+
|
|
79
|
+
# Go to the next row when you're ready
|
|
80
|
+
table.next_row()
|
|
81
|
+
|
|
82
|
+
# Close the table when it's finished
|
|
83
|
+
table.close()
|
|
84
|
+
|
|
85
|
+
```
|
|
86
|
+
|
|
87
|
+
> Go to [integrations](https://github.com/sjmikler/progress-table/blob/main/docs//integrations.md)
|
|
88
|
+
> page to see examples of integration with deep learning libraries.
|
|
89
|
+
|
|
90
|
+
## Advanced usage
|
|
91
|
+
|
|
92
|
+
Go to [advanced usage](https://github.com/sjmikler/progress-table/blob/main/docs//advanced-usage.md) page for more information.
|
|
93
|
+
|
|
94
|
+
## Troubleshooting
|
|
95
|
+
|
|
96
|
+
### Exceesive output
|
|
97
|
+
|
|
98
|
+
Progress Table works correctly in most consoles, but there are some exceptions:
|
|
99
|
+
|
|
100
|
+
* Some cloud logging consoles (e.g. kubernetes) don't support `\r` properly. You can still use ProgressTable, but with `interactive=0` option. This mode will not display progress bars.
|
|
101
|
+
|
|
102
|
+
* Some consoles like 'PyCharm Python Console' or 'IDLE' don't support cursor movement. You can still use ProgressTable, but with `interactive=1` option. In this mode, you can display only a single progress bar.
|
|
103
|
+
|
|
104
|
+
> By default `interactive=2`. You can change the default 'interactive' with an argument when creating the table object or by setting 'PTABLE_INTERACTIVE' environment variable, e.g. `PTABLE_INTERACTIVE=1`.
|
|
105
|
+
|
|
106
|
+
### Other problems
|
|
107
|
+
|
|
108
|
+
If you encounter different messy outputs or other unexpected behavior: please create an issue!
|
|
109
|
+
|
|
110
|
+
## Installation
|
|
111
|
+
|
|
112
|
+
Install Progress Table easily with pip:
|
|
113
|
+
|
|
114
|
+
```
|
|
115
|
+
pip install progress-table
|
|
116
|
+
```
|
|
117
|
+
|
|
118
|
+
## Links
|
|
119
|
+
|
|
120
|
+
* [See on GitHub](https://github.com/gahaalt/progress-table)
|
|
121
|
+
* [See on PyPI](https://pypi.org/project/progress-table)
|
|
122
|
+
|
|
123
|
+
## Alternatives
|
|
124
|
+
|
|
125
|
+
* Progress bars: great for tracking progress, but they don't provide ways to display data in clear and compact way
|
|
126
|
+
* `tqdm`
|
|
127
|
+
* `rich.progress`
|
|
128
|
+
* `keras.utils.Progbar`
|
|
129
|
+
|
|
130
|
+
* Libraries displaying data: great for presenting tabular data, but they lack the progress tracking aspect
|
|
131
|
+
* `rich.table`
|
|
132
|
+
* `tabulate`
|
|
133
|
+
* `texttable`
|
|
@@ -0,0 +1,290 @@
|
|
|
1
|
+
# Advanced usage
|
|
2
|
+
|
|
3
|
+
## Indexing
|
|
4
|
+
|
|
5
|
+
Progress Table with `interactive>=2` supports modyfing already closed rows (rows above the current row).
|
|
6
|
+
This can be done either with `.update` method or using `.at` indexing which is a shorthand for `AtIndexer` object.
|
|
7
|
+
|
|
8
|
+
|
|
9
|
+
> When using `interactive<2` mode, you can only modify the current row.
|
|
10
|
+
> Any changes made to other rows will not be displayed.
|
|
11
|
+
|
|
12
|
+
### `.update` method
|
|
13
|
+
|
|
14
|
+
When using `.update` method you update one value at once.
|
|
15
|
+
Use column name and row index to specify the cell location.
|
|
16
|
+
Example of using `.update` method:
|
|
17
|
+
|
|
18
|
+
```python
|
|
19
|
+
from progress_table import ProgressTable
|
|
20
|
+
|
|
21
|
+
table = ProgressTable()
|
|
22
|
+
table.add_column("Value")
|
|
23
|
+
table.add_rows(3) # Adding empty rows
|
|
24
|
+
|
|
25
|
+
table.update(name="Value", value=1.0, row=1)
|
|
26
|
+
table.update(name="Value", value=2.0, row=0, cell_color="red bold")
|
|
27
|
+
table.update(name="Value", value=3.0, row=2) # modify last-but-one row
|
|
28
|
+
table.close()
|
|
29
|
+
```
|
|
30
|
+
|
|
31
|
+
Which might give you the following:
|
|
32
|
+
|
|
33
|
+
```output
|
|
34
|
+
╭──────────╮
|
|
35
|
+
│ Value │
|
|
36
|
+
├──────────┤
|
|
37
|
+
│ 2.0000 │
|
|
38
|
+
│ 1.0000 │
|
|
39
|
+
│ 3.0000 │
|
|
40
|
+
╰──────────╯
|
|
41
|
+
```
|
|
42
|
+
|
|
43
|
+
### `.at` indexing
|
|
44
|
+
|
|
45
|
+
When using `.at` indexing you do not use column names, instead you use column indices.
|
|
46
|
+
First column has index 0, second 1, etc. Slicing operations are also supported with `.at` indexing.
|
|
47
|
+
Treat the table similarly to a numpy array:
|
|
48
|
+
|
|
49
|
+
```python
|
|
50
|
+
from progress_table import ProgressTable
|
|
51
|
+
|
|
52
|
+
table = ProgressTable()
|
|
53
|
+
table.add_columns(4) # Add more columns with automatic names
|
|
54
|
+
table.add_rows(4) # Adding empty rows
|
|
55
|
+
|
|
56
|
+
table.at[:] = 0.0 # Initialize all values to 0.0
|
|
57
|
+
table.at[0, :] = 2.0 # Set all values in the first row to 2.0
|
|
58
|
+
table.at[:, 1] = 2.0 # Set all values in the second column to 2.0
|
|
59
|
+
table.at[2, 0] = 3.0 # Set the first column in the second-to-last row to 3.0
|
|
60
|
+
|
|
61
|
+
table.close()
|
|
62
|
+
```
|
|
63
|
+
|
|
64
|
+
Which should give you the following:
|
|
65
|
+
|
|
66
|
+
```
|
|
67
|
+
╭──────────┬──────────┬──────────┬──────────╮
|
|
68
|
+
│ 0 │ 1 │ 2 │ 3 │
|
|
69
|
+
├──────────┼──────────┼──────────┼──────────┤
|
|
70
|
+
│ 2.0000 │ 2.0000 │ 2.0000 │ 2.0000 │
|
|
71
|
+
│ 0.0000 │ 2.0000 │ 0.0000 │ 0.0000 │
|
|
72
|
+
│ 3.0000 │ 2.0000 │ 0.0000 │ 0.0000 │
|
|
73
|
+
│ 0.0000 │ 2.0000 │ 0.0000 │ 0.0000 │
|
|
74
|
+
╰──────────┴──────────┴──────────┴──────────╯
|
|
75
|
+
```
|
|
76
|
+
|
|
77
|
+
## Progress Bars
|
|
78
|
+
|
|
79
|
+
There are two types of progress bars in Progress Table: embedded and non-embedded.
|
|
80
|
+
|
|
81
|
+
|
|
82
|
+
> When using `interactive=0` mode, the progress bars will not be displayed.
|
|
83
|
+
|
|
84
|
+
> When using `interactive=1` mode, progress bars are be displayed only in the bottom row.
|
|
85
|
+
|
|
86
|
+
### Embedded progress bars
|
|
87
|
+
|
|
88
|
+
Embedded progress bars are displayed as an overlay under a table row that contains data.
|
|
89
|
+
This allows you to see the progress and the new data all at once.
|
|
90
|
+
Those progress bars are displayed 'under' the row and are aligned with the data columns.
|
|
91
|
+
It is possible to customize the looks of the embedded progress bar by specyfing an argument when creating a table:
|
|
92
|
+
|
|
93
|
+
```python
|
|
94
|
+
from progress_table import ProgressTable
|
|
95
|
+
|
|
96
|
+
table = ProgressTable(pbar_style_embed="dash")
|
|
97
|
+
```
|
|
98
|
+
|
|
99
|
+
Below we show a sample of available styles for embedded progress bars:
|
|
100
|
+
|
|
101
|
+
`dash`
|
|
102
|
+
|
|
103
|
+
```
|
|
104
|
+
| Name | Value | Number |
|
|
105
|
+
|-----------------------------------|
|
|
106
|
+
| test1 | 1.0 | 42 |
|
|
107
|
+
|---test2--|----2.0-> | 37 |
|
|
108
|
+
```
|
|
109
|
+
|
|
110
|
+
`rich`
|
|
111
|
+
|
|
112
|
+
```
|
|
113
|
+
| Name | Value | Number |
|
|
114
|
+
|-----------------------------------|
|
|
115
|
+
| test1 | 1.0 | 42 |
|
|
116
|
+
|━━━test2━━|━━━━2.0━━ | 37 |
|
|
117
|
+
```
|
|
118
|
+
|
|
119
|
+
`under`
|
|
120
|
+
|
|
121
|
+
```
|
|
122
|
+
| Name | Value | Number |
|
|
123
|
+
|-----------------------------------|
|
|
124
|
+
| test1 | 1.0 | 42 |
|
|
125
|
+
|___test2__|____2.0__ | 37 |
|
|
126
|
+
```
|
|
127
|
+
|
|
128
|
+
---
|
|
129
|
+
|
|
130
|
+
To see the exahustive list of available options, one can use the following code:
|
|
131
|
+
|
|
132
|
+
```python
|
|
133
|
+
from progress_table import styles
|
|
134
|
+
|
|
135
|
+
print(styles.available_pbar_styles())
|
|
136
|
+
```
|
|
137
|
+
|
|
138
|
+
### Non-embedded progress bars
|
|
139
|
+
|
|
140
|
+
Non-embedded progress bars are displayed as a separate row under the row that contains data.
|
|
141
|
+
Optionally, you can force every progress bar, including the embedded ones, to look like a non-embedded and cover the data.
|
|
142
|
+
You might want to do that if you aim for specific looks of your progress bars.
|
|
143
|
+
|
|
144
|
+
```python
|
|
145
|
+
from progress_table import ProgressTable
|
|
146
|
+
|
|
147
|
+
table = ProgressTable(
|
|
148
|
+
pbar_style="square", # specify specific style
|
|
149
|
+
pbar_embedded=False, # force all progress bars to be non-embedded
|
|
150
|
+
)
|
|
151
|
+
```
|
|
152
|
+
|
|
153
|
+
Below we show a sample of available styles for non-embedded progress bars
|
|
154
|
+
|
|
155
|
+
---
|
|
156
|
+
|
|
157
|
+
`square`
|
|
158
|
+
|
|
159
|
+
```
|
|
160
|
+
| Name | Value | Number |
|
|
161
|
+
|-----------------------------------|
|
|
162
|
+
| test1 | 1.0 | 42 |
|
|
163
|
+
| test2 | 2.0 | 37 |
|
|
164
|
+
|■■■■■■■■■■■■■■■■■■■■□□□□□□□□□□□□□□□|
|
|
165
|
+
```
|
|
166
|
+
|
|
167
|
+
`circle`
|
|
168
|
+
|
|
169
|
+
```
|
|
170
|
+
| Name | Value | Number |
|
|
171
|
+
|-----------------------------------|
|
|
172
|
+
| test1 | 1.0 | 42 |
|
|
173
|
+
| test2 | 2.0 | 37 |
|
|
174
|
+
| ●●●●●●●●●●●●●●●●●●◉○○○○○○○○○○○○○○○|
|
|
175
|
+
```
|
|
176
|
+
|
|
177
|
+
---
|
|
178
|
+
|
|
179
|
+
As previously, you can see the exhaustive list of available options by using the following code:
|
|
180
|
+
|
|
181
|
+
```python
|
|
182
|
+
from progress_table import styles
|
|
183
|
+
|
|
184
|
+
print(styles.available_pbar_styles())
|
|
185
|
+
```
|
|
186
|
+
|
|
187
|
+
> You can create custom styles by following code in `styles.py` file.
|
|
188
|
+
|
|
189
|
+
### Infobar
|
|
190
|
+
|
|
191
|
+
You can display detailed information like:
|
|
192
|
+
|
|
193
|
+
* throughput
|
|
194
|
+
* progress in percents
|
|
195
|
+
* progress as the current step and total steps
|
|
196
|
+
* ETA (estimated time arrival) - estimated time in seconds, minutes or hours when the progress bar will finish
|
|
197
|
+
* custom description
|
|
198
|
+
|
|
199
|
+
To add or remove some of this information, specify the arguments like below.
|
|
200
|
+
Additionaly, you can create a progress bar object and specify
|
|
201
|
+
all the options only for this specific progress bar.
|
|
202
|
+
|
|
203
|
+
```python
|
|
204
|
+
from progress_table import ProgressTable
|
|
205
|
+
|
|
206
|
+
table = ProgressTable(
|
|
207
|
+
pbar_show_throughput=True,
|
|
208
|
+
pbar_show_progress=False,
|
|
209
|
+
pbar_show_percents=False,
|
|
210
|
+
pbar_show_eta=False,
|
|
211
|
+
)
|
|
212
|
+
|
|
213
|
+
pbar = table.pbar(
|
|
214
|
+
range(1000),
|
|
215
|
+
description="train epoch",
|
|
216
|
+
show_throughput=True,
|
|
217
|
+
show_progress=False,
|
|
218
|
+
show_percents=False,
|
|
219
|
+
show_eta=True,
|
|
220
|
+
style="circle",
|
|
221
|
+
style_embed="cdots",
|
|
222
|
+
)
|
|
223
|
+
```
|
|
224
|
+
|
|
225
|
+
Which, when used, might look like this:
|
|
226
|
+
|
|
227
|
+
```
|
|
228
|
+
│ │ │ │ │
|
|
229
|
+
│[train epoch, 24.1 it/s, ETA 53s] ●●●●●●●◉○○○○○│
|
|
230
|
+
```
|
|
231
|
+
|
|
232
|
+
### More progress bar customization
|
|
233
|
+
|
|
234
|
+
There is more ways to customize the look and feel of your progress bars
|
|
235
|
+
by adding special keywords to the style string:
|
|
236
|
+
|
|
237
|
+
```python
|
|
238
|
+
from progress_table import ProgressTable
|
|
239
|
+
|
|
240
|
+
table = ProgressTable(pbar_style="angled alt red blue")
|
|
241
|
+
```
|
|
242
|
+
|
|
243
|
+
The example above would result in an angled-type pbar with alternative way of displaying empty bars,
|
|
244
|
+
with filled bars colored red and empty bars colored blue. There's a separate style string
|
|
245
|
+
for the embedded type progress bars - styling of embedded and non-embedded progress bars is indepedent.
|
|
246
|
+
|
|
247
|
+
```python
|
|
248
|
+
from progress_table import ProgressTable
|
|
249
|
+
|
|
250
|
+
table = ProgressTable(pbar_style_embed="cdots red blue")
|
|
251
|
+
```
|
|
252
|
+
|
|
253
|
+
The available keywords are:
|
|
254
|
+
|
|
255
|
+
* `alt` - alternative way of displaying empty bars, for example `■` instead of `□`.
|
|
256
|
+
This is only useful when using colors, otherwise you might not be able to differentiate between filled and empty bars.
|
|
257
|
+
* `clean` - removes empty bars from the progress bar. Spaces are used instead.
|
|
258
|
+
* `red`, `green`, `blue`, `yellow` and other colors available in colorama. If more than one is provided,
|
|
259
|
+
the first one is used for filled bars and the last one is used for empty bars.
|
|
260
|
+
|
|
261
|
+
---
|
|
262
|
+
|
|
263
|
+
Additionaly, you can specify the color of the progress bar using
|
|
264
|
+
`color` and `color_empty` arguments when creating a progress bar object.
|
|
265
|
+
This will override whatever color is set in `style` or `style_embed`.
|
|
266
|
+
We can combine this option with `colorama.Back` to modify colors
|
|
267
|
+
of the background instead of the foreground symbols.
|
|
268
|
+
|
|
269
|
+
```python
|
|
270
|
+
from progress_table import ProgressTable
|
|
271
|
+
import colorama
|
|
272
|
+
import time
|
|
273
|
+
|
|
274
|
+
table = ProgressTable("a", "b", "c")
|
|
275
|
+
table.add_rows(1)
|
|
276
|
+
|
|
277
|
+
pbar = table.pbar(
|
|
278
|
+
range(100),
|
|
279
|
+
style_embed="hidden",
|
|
280
|
+
color=colorama.Back.RED,
|
|
281
|
+
color_empty=colorama.Back.BLUE,
|
|
282
|
+
)
|
|
283
|
+
|
|
284
|
+
for _ in pbar:
|
|
285
|
+
time.sleep(0.1)
|
|
286
|
+
```
|
|
287
|
+
|
|
288
|
+
Try the example above. It contains a different type of embedded progress bar.
|
|
289
|
+
Here the typical progress bar symbols will are hidden,
|
|
290
|
+
but the background color will show us the progress of the process.
|
|
@@ -0,0 +1,114 @@
|
|
|
1
|
+
# Integrations
|
|
2
|
+
|
|
3
|
+
Progress Table is not tied up to any specific deep learning framework.
|
|
4
|
+
Because of it, it's lightweight and minimal. You can still easily integrate it with your code and your favourite framework. Below you will find examples of how to do this.
|
|
5
|
+
|
|
6
|
+
# PyTorch
|
|
7
|
+
|
|
8
|
+
This is an example of a simple custom training loop in PyTorch. We present two versions: without and with Progress Bar.
|
|
9
|
+
|
|
10
|
+
### Without Progress Table
|
|
11
|
+
|
|
12
|
+
Manual logging is often done in haste. It can look like this:
|
|
13
|
+
|
|
14
|
+
```python
|
|
15
|
+
...
|
|
16
|
+
|
|
17
|
+
for epoch in range(n_epochs):
|
|
18
|
+
print(f'Epoch {epoch}')
|
|
19
|
+
cumulated_loss = 0
|
|
20
|
+
cumulated_accuracy = 0
|
|
21
|
+
|
|
22
|
+
for batch_idx, (x, y) in enumerate(train_loader):
|
|
23
|
+
loss, predictions = training_step(x, y)
|
|
24
|
+
accuracy = torch.mean((predictions == y).float()).item()
|
|
25
|
+
|
|
26
|
+
cumulated_loss += loss.item()
|
|
27
|
+
cumulated_accuracy += accuracy
|
|
28
|
+
|
|
29
|
+
if (batch_idx) % 100 == 0:
|
|
30
|
+
print('Epoch [{}/{}], Step [{}/{}], Loss: {:.4f}, Accuracy: {:.4f}'.format(
|
|
31
|
+
epoch,
|
|
32
|
+
n_epochs,
|
|
33
|
+
batch_idx,
|
|
34
|
+
len(train_loader),
|
|
35
|
+
cumulated_loss / (batch_idx + 1),
|
|
36
|
+
cumulated_accuracy / (batch_idx + 1),
|
|
37
|
+
))
|
|
38
|
+
|
|
39
|
+
print('Epoch [{}/{}], Step [FINISHED], Loss: {:.4f}, Accuracy: {:.4f}'.format(
|
|
40
|
+
epoch,
|
|
41
|
+
n_epochs,
|
|
42
|
+
cumulated_loss / len(train_loader),
|
|
43
|
+
cumulated_accuracy / len(train_loader),
|
|
44
|
+
))
|
|
45
|
+
```
|
|
46
|
+
|
|
47
|
+
### With Progress Table
|
|
48
|
+
|
|
49
|
+
When using Progress Table, you get detailed and clean logs. Moreover, your code is shorter, simpler and you get more functionality out of it.
|
|
50
|
+
|
|
51
|
+
```python
|
|
52
|
+
...
|
|
53
|
+
|
|
54
|
+
table = ProgressTable("Epoch", "Step")
|
|
55
|
+
table.add_columns(["Loss", "Accuracy"], aggregate="mean")
|
|
56
|
+
|
|
57
|
+
for epoch in range(n_epochs):
|
|
58
|
+
table["Epoch"] = f"{epoch}/{n_epochs}"
|
|
59
|
+
|
|
60
|
+
for x, y in table(train_loader):
|
|
61
|
+
loss, predictions = training_step(x, y)
|
|
62
|
+
accuracy = torch.mean((predictions == y).float()).item()
|
|
63
|
+
|
|
64
|
+
table["Loss"] = loss
|
|
65
|
+
table["Accuracy"] = accuracy
|
|
66
|
+
table.next_row()
|
|
67
|
+
|
|
68
|
+
table.close()
|
|
69
|
+
```
|
|
70
|
+
|
|
71
|
+
# Keras
|
|
72
|
+
|
|
73
|
+
In case of PyTorch or TensorFlow, we often use custom training loops
|
|
74
|
+
where we can integrate Progress Table as shown above.
|
|
75
|
+
What about Keras, where the progress bar is built-in the `model.fit` method?
|
|
76
|
+
You can create a callback that will replace the progress bar built-in Keras
|
|
77
|
+
with a progress table. Callback should inherit from `ProgbarLogger`.
|
|
78
|
+
|
|
79
|
+
Here's an example:
|
|
80
|
+
|
|
81
|
+
```python
|
|
82
|
+
...
|
|
83
|
+
|
|
84
|
+
table = ProgressTable()
|
|
85
|
+
table.add_columns(["loss", "accuracy", "val_loss", "val_accuracy"], aggregate="mean")
|
|
86
|
+
|
|
87
|
+
|
|
88
|
+
class TableCallback(tf.keras.callbacks.ProgbarLogger):
|
|
89
|
+
def __init__(self, table):
|
|
90
|
+
super().__init__()
|
|
91
|
+
self.table = table
|
|
92
|
+
|
|
93
|
+
def on_epoch_begin(self, epoch, logs=None):
|
|
94
|
+
pass
|
|
95
|
+
|
|
96
|
+
def on_epoch_end(self, epoch, logs=None):
|
|
97
|
+
self.table.update_from_dict(logs)
|
|
98
|
+
self.table.next_row()
|
|
99
|
+
|
|
100
|
+
def on_train_end(self, logs=None):
|
|
101
|
+
self.table.close()
|
|
102
|
+
|
|
103
|
+
def on_train_batch_end(self, batch, logs=None):
|
|
104
|
+
self.table.update_from_dict(logs)
|
|
105
|
+
|
|
106
|
+
|
|
107
|
+
model.fit(
|
|
108
|
+
x_train,
|
|
109
|
+
y_train,
|
|
110
|
+
validation_data=(x_train, y_train),
|
|
111
|
+
callbacks=[TableCallback(table)],
|
|
112
|
+
epochs=10,
|
|
113
|
+
)
|
|
114
|
+
```
|
|
@@ -0,0 +1,52 @@
|
|
|
1
|
+
# Version 3.0.0
|
|
2
|
+
|
|
3
|
+
Version 3.0.0 of Progress Table is now available.
|
|
4
|
+
|
|
5
|
+
It introduces:
|
|
6
|
+
|
|
7
|
+
* Important internal changes to increase the stability.
|
|
8
|
+
* Increased compatibility with some types of terminals.
|
|
9
|
+
* Minor breaking changes in the API.
|
|
10
|
+
|
|
11
|
+
## BREAKING API CHANGES
|
|
12
|
+
|
|
13
|
+
---
|
|
14
|
+
|
|
15
|
+
```
|
|
16
|
+
ProgressTable(["c1", "c2", "c3"])
|
|
17
|
+
```
|
|
18
|
+
|
|
19
|
+
↑ becomes now ↓
|
|
20
|
+
|
|
21
|
+
```
|
|
22
|
+
ProgressTable("c1", "c2", "c3")
|
|
23
|
+
# or
|
|
24
|
+
ProgressTable(columns=["c1", "c2", "c3"])
|
|
25
|
+
```
|
|
26
|
+
|
|
27
|
+
---
|
|
28
|
+
|
|
29
|
+
```
|
|
30
|
+
ProgressTable([], 1, 20)
|
|
31
|
+
```
|
|
32
|
+
|
|
33
|
+
↑ will raise an error. Use named arguments instead ↓
|
|
34
|
+
|
|
35
|
+
```
|
|
36
|
+
ProgressTable(interactive=1, refresh_rate=20)
|
|
37
|
+
```
|
|
38
|
+
|
|
39
|
+
---
|
|
40
|
+
|
|
41
|
+
```
|
|
42
|
+
from progress_table import ProgressTableV1, ProgressTableV2
|
|
43
|
+
```
|
|
44
|
+
|
|
45
|
+
↑ multiple versions of ProgressTable are not available anymore. Use ↓
|
|
46
|
+
|
|
47
|
+
```
|
|
48
|
+
from progress_table import ProgressTable
|
|
49
|
+
```
|
|
50
|
+
|
|
51
|
+
---
|
|
52
|
+
|