principle-viz 0.10.0__tar.gz
This diff represents the content of publicly available package versions that have been released to one of the supported registries. The information contained in this diff is provided for informational purposes only and reflects changes between package versions as they appear in their respective public registries.
- principle_viz-0.10.0/LICENSE +21 -0
- principle_viz-0.10.0/PKG-INFO +234 -0
- principle_viz-0.10.0/README.md +212 -0
- principle_viz-0.10.0/pyproject.toml +65 -0
- principle_viz-0.10.0/pyproject.toml.orig +52 -0
- principle_viz-0.10.0/src/principle_viz/__init__.py +190 -0
- principle_viz-0.10.0/src/principle_viz/api/__init__.py +57 -0
- principle_viz-0.10.0/src/principle_viz/api/facade.py +160 -0
- principle_viz-0.10.0/src/principle_viz/cli/__init__.py +5 -0
- principle_viz-0.10.0/src/principle_viz/cli/commands/__init__.py +35 -0
- principle_viz-0.10.0/src/principle_viz/cli/commands/elasticity.py +68 -0
- principle_viz-0.10.0/src/principle_viz/cli/commands/factor_markets.py +66 -0
- principle_viz-0.10.0/src/principle_viz/cli/commands/market.py +78 -0
- principle_viz-0.10.0/src/principle_viz/cli/commands/policy.py +141 -0
- principle_viz-0.10.0/src/principle_viz/cli/commands/ppf.py +57 -0
- principle_viz-0.10.0/src/principle_viz/cli/commands/public_goods.py +47 -0
- principle_viz-0.10.0/src/principle_viz/cli/commands/shared.py +25 -0
- principle_viz-0.10.0/src/principle_viz/cli/commands/welfare.py +142 -0
- principle_viz-0.10.0/src/principle_viz/cli/main.py +30 -0
- principle_viz-0.10.0/src/principle_viz/cli/output.py +33 -0
- principle_viz-0.10.0/src/principle_viz/core/__init__.py +110 -0
- principle_viz-0.10.0/src/principle_viz/core/aggregation.py +147 -0
- principle_viz-0.10.0/src/principle_viz/core/controls.py +93 -0
- principle_viz-0.10.0/src/principle_viz/core/discrete.py +159 -0
- principle_viz-0.10.0/src/principle_viz/core/elasticity.py +50 -0
- principle_viz-0.10.0/src/principle_viz/core/equilibrium.py +54 -0
- principle_viz-0.10.0/src/principle_viz/core/factor_markets.py +126 -0
- principle_viz-0.10.0/src/principle_viz/core/line.py +92 -0
- principle_viz-0.10.0/src/principle_viz/core/piecewise.py +118 -0
- principle_viz-0.10.0/src/principle_viz/core/ppf.py +195 -0
- principle_viz-0.10.0/src/principle_viz/core/public_goods.py +114 -0
- principle_viz-0.10.0/src/principle_viz/core/revenue.py +65 -0
- principle_viz-0.10.0/src/principle_viz/core/shifts.py +103 -0
- principle_viz-0.10.0/src/principle_viz/exceptions.py +32 -0
- principle_viz-0.10.0/src/principle_viz/plot/__init__.py +41 -0
- principle_viz-0.10.0/src/principle_viz/plot/aggregation.py +388 -0
- principle_viz-0.10.0/src/principle_viz/plot/canvas.py +5 -0
- principle_viz-0.10.0/src/principle_viz/plot/colors.py +27 -0
- principle_viz-0.10.0/src/principle_viz/plot/figure.py +611 -0
- principle_viz-0.10.0/src/principle_viz/plot/theme.py +5 -0
- principle_viz-0.10.0/src/principle_viz/policy/__init__.py +69 -0
- principle_viz-0.10.0/src/principle_viz/policy/analysis.py +45 -0
- principle_viz-0.10.0/src/principle_viz/policy/common_resources.py +48 -0
- principle_viz-0.10.0/src/principle_viz/policy/externality.py +64 -0
- principle_viz-0.10.0/src/principle_viz/policy/models.py +65 -0
- principle_viz-0.10.0/src/principle_viz/policy/solver.py +89 -0
- principle_viz-0.10.0/src/principle_viz/policy/subsidy.py +81 -0
- principle_viz-0.10.0/src/principle_viz/policy/tax.py +26 -0
- principle_viz-0.10.0/src/principle_viz/policy/trade.py +206 -0
- principle_viz-0.10.0/src/principle_viz/policy/visual.py +100 -0
- principle_viz-0.10.0/src/principle_viz/visuals/__init__.py +89 -0
- principle_viz-0.10.0/src/principle_viz/visuals/aggregation.py +218 -0
- principle_viz-0.10.0/src/principle_viz/visuals/axes.py +83 -0
- principle_viz-0.10.0/src/principle_viz/visuals/curves.py +50 -0
- principle_viz-0.10.0/src/principle_viz/visuals/direct_labels.py +192 -0
- principle_viz-0.10.0/src/principle_viz/visuals/discrete.py +161 -0
- principle_viz-0.10.0/src/principle_viz/visuals/equilibrium.py +114 -0
- principle_viz-0.10.0/src/principle_viz/visuals/factor_markets.py +127 -0
- principle_viz-0.10.0/src/principle_viz/visuals/market_failures.py +309 -0
- principle_viz-0.10.0/src/principle_viz/visuals/metrics.py +38 -0
- principle_viz-0.10.0/src/principle_viz/visuals/policy.py +322 -0
- principle_viz-0.10.0/src/principle_viz/visuals/ppf.py +141 -0
- principle_viz-0.10.0/src/principle_viz/visuals/revenue.py +114 -0
- principle_viz-0.10.0/src/principle_viz/visuals/theme.py +345 -0
- principle_viz-0.10.0/src/principle_viz/visuals/trade.py +111 -0
- principle_viz-0.10.0/src/principle_viz/visuals/welfare.py +213 -0
- principle_viz-0.10.0/src/principle_viz/welfare/__init__.py +55 -0
- principle_viz-0.10.0/src/principle_viz/welfare/discrete.py +34 -0
- principle_viz-0.10.0/src/principle_viz/welfare/layout.py +94 -0
- principle_viz-0.10.0/src/principle_viz/welfare/report.py +74 -0
- principle_viz-0.10.0/src/principle_viz/welfare/surplus.py +230 -0
|
@@ -0,0 +1,21 @@
|
|
|
1
|
+
MIT License
|
|
2
|
+
|
|
3
|
+
Copyright (c) 2026 Anthony Sung
|
|
4
|
+
|
|
5
|
+
Permission is hereby granted, free of charge, to any person obtaining a copy
|
|
6
|
+
of this software and associated documentation files (the "Software"), to deal
|
|
7
|
+
in the Software without restriction, including without limitation the rights
|
|
8
|
+
to use, copy, modify, merge, publish, distribute, sublicense, and/or sell
|
|
9
|
+
copies of the Software, and to permit persons to whom the Software is
|
|
10
|
+
furnished to do so, subject to the following conditions:
|
|
11
|
+
|
|
12
|
+
The above copyright notice and this permission notice shall be included in all
|
|
13
|
+
copies or substantial portions of the Software.
|
|
14
|
+
|
|
15
|
+
THE SOFTWARE IS PROVIDED "AS IS", WITHOUT WARRANTY OF ANY KIND, EXPRESS OR
|
|
16
|
+
IMPLIED, INCLUDING BUT NOT LIMITED TO THE WARRANTIES OF MERCHANTABILITY,
|
|
17
|
+
FITNESS FOR A PARTICULAR PURPOSE AND NONINFRINGEMENT. IN NO EVENT SHALL THE
|
|
18
|
+
AUTHORS OR COPYRIGHT HOLDERS BE LIABLE FOR ANY CLAIM, DAMAGES OR OTHER
|
|
19
|
+
LIABILITY, WHETHER IN AN ACTION OF CONTRACT, TORT OR OTHERWISE, ARISING FROM,
|
|
20
|
+
OUT OF OR IN CONNECTION WITH THE SOFTWARE OR THE USE OR OTHER DEALINGS IN THE
|
|
21
|
+
SOFTWARE.
|
|
@@ -0,0 +1,234 @@
|
|
|
1
|
+
Metadata-Version: 2.4
|
|
2
|
+
Name: principle-viz
|
|
3
|
+
Version: 0.10.0
|
|
4
|
+
Summary: Principles of Economics toolkit for demand/supply analytics and diagrams.
|
|
5
|
+
Keywords: economics,microeconomics,demand,supply,equilibrium,welfare,tax
|
|
6
|
+
Author: Anthony Sung
|
|
7
|
+
Author-email: Anthony Sung <sungpinyue@gmail.com>
|
|
8
|
+
License-Expression: MIT
|
|
9
|
+
License-File: LICENSE
|
|
10
|
+
Classifier: Programming Language :: Python :: 3
|
|
11
|
+
Classifier: Programming Language :: Python :: 3 :: Only
|
|
12
|
+
Classifier: Operating System :: OS Independent
|
|
13
|
+
Classifier: Intended Audience :: Education
|
|
14
|
+
Classifier: Topic :: Scientific/Engineering
|
|
15
|
+
Requires-Dist: mosaickit>=0.5.1,<0.6.0
|
|
16
|
+
Requires-Python: >=3.10, <4.0
|
|
17
|
+
Project-URL: Homepage, https://github.com/EconViz/principle-viz
|
|
18
|
+
Project-URL: Repository, https://github.com/EconViz/principle-viz
|
|
19
|
+
Project-URL: Documentation, https://github.com/EconViz/principle-viz
|
|
20
|
+
Project-URL: Changelog, https://github.com/EconViz/principle-viz/blob/main/CHANGELOG.md
|
|
21
|
+
Description-Content-Type: text/markdown
|
|
22
|
+
|
|
23
|
+
<p align="center">
|
|
24
|
+
<img src="https://raw.githubusercontent.com/EconViz/principle-viz/docs/docs/assets/banner.svg" alt="principle-viz" width="480">
|
|
25
|
+
</p>
|
|
26
|
+
|
|
27
|
+
<p align="center">
|
|
28
|
+
<a href="https://github.com/EconViz/principle-viz/actions/workflows/publish.yml"><img alt="CI / Publish" src="https://img.shields.io/github/actions/workflow/status/EconViz/principle-viz/publish.yml?branch=main&style=flat-square&color=181818&labelColor=f3f3f3&label=CI%20%2F%20Publish"></a>
|
|
29
|
+
<a href="https://pypi.org/project/principle-viz/"><img alt="PyPI" src="https://img.shields.io/pypi/v/principle-viz?style=flat-square&color=181818&labelColor=f3f3f3"></a>
|
|
30
|
+
<a href="https://pypi.org/project/principle-viz/"><img alt="Python" src="https://img.shields.io/pypi/pyversions/principle-viz?style=flat-square&color=181818&labelColor=f3f3f3"></a>
|
|
31
|
+
<a href="https://opensource.org/licenses/MIT"><img alt="License" src="https://img.shields.io/badge/License-MIT-181818?style=flat-square&color=181818&labelColor=f3f3f3"></a>
|
|
32
|
+
<a href="https://github.com/EconViz/principle-viz/tree/docs"><img alt="Docs Branch" src="https://img.shields.io/badge/docs-branch-181818?style=flat-square&color=181818&labelColor=f3f3f3"></a>
|
|
33
|
+
</p>
|
|
34
|
+
|
|
35
|
+
`principle-viz` is a Python package for Principles of Economics market analysis and diagrams.
|
|
36
|
+
It focuses on **linear demand/supply** models with clean module boundaries across solver logic, policy layers, welfare decomposition, and plotting.
|
|
37
|
+
|
|
38
|
+
## Features
|
|
39
|
+
|
|
40
|
+
- Solve market equilibrium from linear demand and supply, or from discrete unit schedules
|
|
41
|
+
- Comparative statics: shifts of demand or supply, with the move from the old equilibrium to the new one
|
|
42
|
+
- Taxes (fixed, per-unit, ad valorem; legal incidence on buyers or sellers) and subsidies
|
|
43
|
+
- Price ceilings, price floors and the minimum wage, with the shortage, surplus or unemployment braced on the policy line
|
|
44
|
+
- Welfare decomposition: consumer and producer surplus, tax revenue, deadweight loss
|
|
45
|
+
- International trade (free trade, tariffs, quotas), externalities, common resources, public goods, loanable funds, the PPF and elasticity
|
|
46
|
+
- Market demand and supply as the horizontal sum of individual curves or schedules
|
|
47
|
+
- Textbook-style figures built on [MosaicKit](https://github.com/EconViz/mosaickit): square plots, curves named directly instead of a legend, LaTeX labels, values marked on the axes, and labels placed so they cover nothing
|
|
48
|
+
- CLI workflows with JSON output
|
|
49
|
+
|
|
50
|
+
## Installation
|
|
51
|
+
|
|
52
|
+
```bash
|
|
53
|
+
pip install principle-viz
|
|
54
|
+
```
|
|
55
|
+
|
|
56
|
+
For development:
|
|
57
|
+
|
|
58
|
+
```bash
|
|
59
|
+
git clone https://github.com/EconViz/principle-viz.git
|
|
60
|
+
cd principle-viz
|
|
61
|
+
uv sync
|
|
62
|
+
```
|
|
63
|
+
|
|
64
|
+
## Quick Start
|
|
65
|
+
|
|
66
|
+
```python
|
|
67
|
+
from principle_viz.core.line import Line
|
|
68
|
+
from principle_viz.core.equilibrium import solve_equilibrium
|
|
69
|
+
from principle_viz.plot.figure import MarketFigure
|
|
70
|
+
|
|
71
|
+
demand = Line.from_inverse(10.0, -1.0)
|
|
72
|
+
supply = Line.from_inverse(2.0, 1.0)
|
|
73
|
+
eq = solve_equilibrium(demand, supply)
|
|
74
|
+
|
|
75
|
+
fig = MarketFigure(x_max=12, y_max=12, title="Basic Equilibrium")
|
|
76
|
+
fig.add_curves(demand, supply, q_max=10)
|
|
77
|
+
fig.add_equilibrium(eq)
|
|
78
|
+
fig.finalize()
|
|
79
|
+
fig.save("basic_equilibrium.png")
|
|
80
|
+
fig.close()
|
|
81
|
+
```
|
|
82
|
+
|
|
83
|
+
## Tax Example (Consumer vs Producer Incidence)
|
|
84
|
+
|
|
85
|
+
```python
|
|
86
|
+
from principle_viz.core.line import Line
|
|
87
|
+
from principle_viz.plot.figure import MarketFigure
|
|
88
|
+
from principle_viz.policy.tax import TaxOn, TaxScenario, TaxType
|
|
89
|
+
|
|
90
|
+
demand = Line.from_inverse(10.0, -1.0)
|
|
91
|
+
supply = Line.from_inverse(0.0, 1.0)
|
|
92
|
+
scenario = TaxScenario(tax_type=TaxType.AD_VALOREM_TAX, amount=0.35, tax_on=TaxOn.CONSUMER)
|
|
93
|
+
|
|
94
|
+
fig = MarketFigure(x_max=12, y_max=12, title="Ad Valorem Tax")
|
|
95
|
+
fig.add_curves(demand, supply, q_max=10)
|
|
96
|
+
fig.add_tax_transform(demand, supply, scenario, q_max=10)
|
|
97
|
+
fig.finalize()
|
|
98
|
+
fig.save("tax_ad_valorem_consumer.png")
|
|
99
|
+
fig.close()
|
|
100
|
+
```
|
|
101
|
+
|
|
102
|
+
## Price Controls
|
|
103
|
+
|
|
104
|
+
```python
|
|
105
|
+
from principle_viz.core.controls import (
|
|
106
|
+
PriceControlScenario,
|
|
107
|
+
PriceControlType,
|
|
108
|
+
evaluate_price_control,
|
|
109
|
+
)
|
|
110
|
+
from principle_viz.core.line import Line
|
|
111
|
+
from principle_viz.plot.figure import MarketFigure
|
|
112
|
+
|
|
113
|
+
demand = Line.from_inverse(10.0, -1.0)
|
|
114
|
+
supply = Line.from_inverse(2.0, 1.0)
|
|
115
|
+
ceiling = evaluate_price_control(
|
|
116
|
+
demand, supply, PriceControlScenario(PriceControlType.CEILING, 4.0)
|
|
117
|
+
)
|
|
118
|
+
|
|
119
|
+
fig = MarketFigure(x_max=12, y_max=12, title="Binding Price Ceiling")
|
|
120
|
+
fig.add_curves(demand, supply, q_max=10)
|
|
121
|
+
fig.add_price_control(ceiling) # "Shortage" braced below the ceiling line
|
|
122
|
+
fig.finalize()
|
|
123
|
+
fig.save("price_ceiling.png")
|
|
124
|
+
fig.close()
|
|
125
|
+
```
|
|
126
|
+
|
|
127
|
+
`add_price_control(..., gap_brace="axis")` braces the gap under the quantity axis instead; `add_minimum_wage()` draws the labor-market version.
|
|
128
|
+
|
|
129
|
+
## Market Demand and Supply from Individuals
|
|
130
|
+
|
|
131
|
+
Individual curves sum horizontally into the market curve. Each buyer buys nothing above their choke price and each seller sells nothing below their minimum price, so the market curve is piecewise linear with a kink at each of those prices.
|
|
132
|
+
|
|
133
|
+
```python
|
|
134
|
+
from principle_viz import (
|
|
135
|
+
DiscreteDemand,
|
|
136
|
+
demand_aggregation_figure,
|
|
137
|
+
discrete_demand_aggregation_figure,
|
|
138
|
+
market_demand,
|
|
139
|
+
market_supply,
|
|
140
|
+
solve_piecewise_equilibrium,
|
|
141
|
+
)
|
|
142
|
+
from principle_viz.core.line import Line
|
|
143
|
+
|
|
144
|
+
a = Line.from_inverse(10, -2) # p = 10 - 2Q
|
|
145
|
+
b = Line.from_inverse(6, -0.5) # p = 6 - 0.5Q
|
|
146
|
+
demand = market_demand((a, b))
|
|
147
|
+
demand.points # ((0, 10), (2, 6), (17, 0)), kink at B's choke price
|
|
148
|
+
demand.q_at(4) # 7 = Q_A + Q_B
|
|
149
|
+
|
|
150
|
+
supply = market_supply((Line.from_inverse(2, 1), Line.from_inverse(5, 0.5)), p_max=10)
|
|
151
|
+
solve_piecewise_equilibrium(demand, supply) # exact on each segment
|
|
152
|
+
|
|
153
|
+
# Individual A | individual B | market, with guides at p_1 showing Q_A + Q_B = Q.
|
|
154
|
+
# link_price=True runs the p_1 line across all three panels.
|
|
155
|
+
demand_aggregation_figure({"A": a, "B": b}, price=4, link_price=True).save(
|
|
156
|
+
"market_demand.png"
|
|
157
|
+
)
|
|
158
|
+
|
|
159
|
+
# Discrete: reservation prices combine into one market step schedule.
|
|
160
|
+
DiscreteDemand.combine(DiscreteDemand((10, 7, 4)), DiscreteDemand((8, 5, 2)))
|
|
161
|
+
discrete_demand_aggregation_figure(
|
|
162
|
+
{"A": DiscreteDemand((10, 7, 4)), "B": DiscreteDemand((8, 5, 2))}, price=6
|
|
163
|
+
).save("discrete_market_demand.png")
|
|
164
|
+
```
|
|
165
|
+
|
|
166
|
+
`supply_aggregation_figure` and `discrete_supply_aggregation_figure` draw the supply side. Examples: `examples/scripts/aggregation_*.py`, output under `examples/output/aggregation/`.
|
|
167
|
+
|
|
168
|
+
## CLI
|
|
169
|
+
|
|
170
|
+
```bash
|
|
171
|
+
principle-viz equilibrium \
|
|
172
|
+
--demand-intercept 10 --demand-slope -1 \
|
|
173
|
+
--supply-intercept 2 --supply-slope 1
|
|
174
|
+
|
|
175
|
+
principle-viz tax \
|
|
176
|
+
--demand-intercept 10 --demand-slope -1 \
|
|
177
|
+
--supply-intercept 2 --supply-slope 1 \
|
|
178
|
+
--tax-type per_unit --amount 1 --tax-on producer
|
|
179
|
+
```
|
|
180
|
+
|
|
181
|
+
## Examples
|
|
182
|
+
|
|
183
|
+
Run all examples:
|
|
184
|
+
|
|
185
|
+
```bash
|
|
186
|
+
uv run python examples/scripts/run_all.py
|
|
187
|
+
```
|
|
188
|
+
|
|
189
|
+
Generated images are grouped by topic under `examples/output/`: `equilibrium/`, `discrete/`, `aggregation/`, `taxation/`, `subsidy/`, `price_controls/`, `welfare/`, `trade/`, `market_failures/`, `factor_capital_markets/`, `elasticity/` and `ppf/`.
|
|
190
|
+
|
|
191
|
+
### Example Gallery
|
|
192
|
+
|
|
193
|
+
| | |
|
|
194
|
+
|---|---|
|
|
195
|
+
| 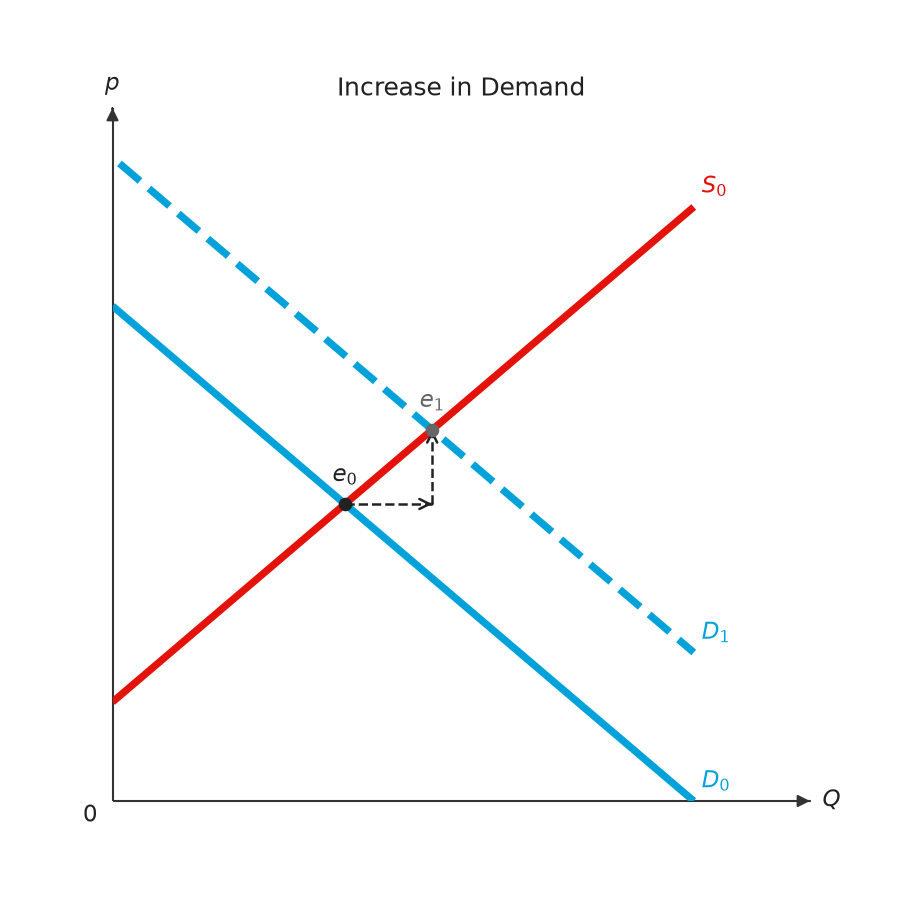 | 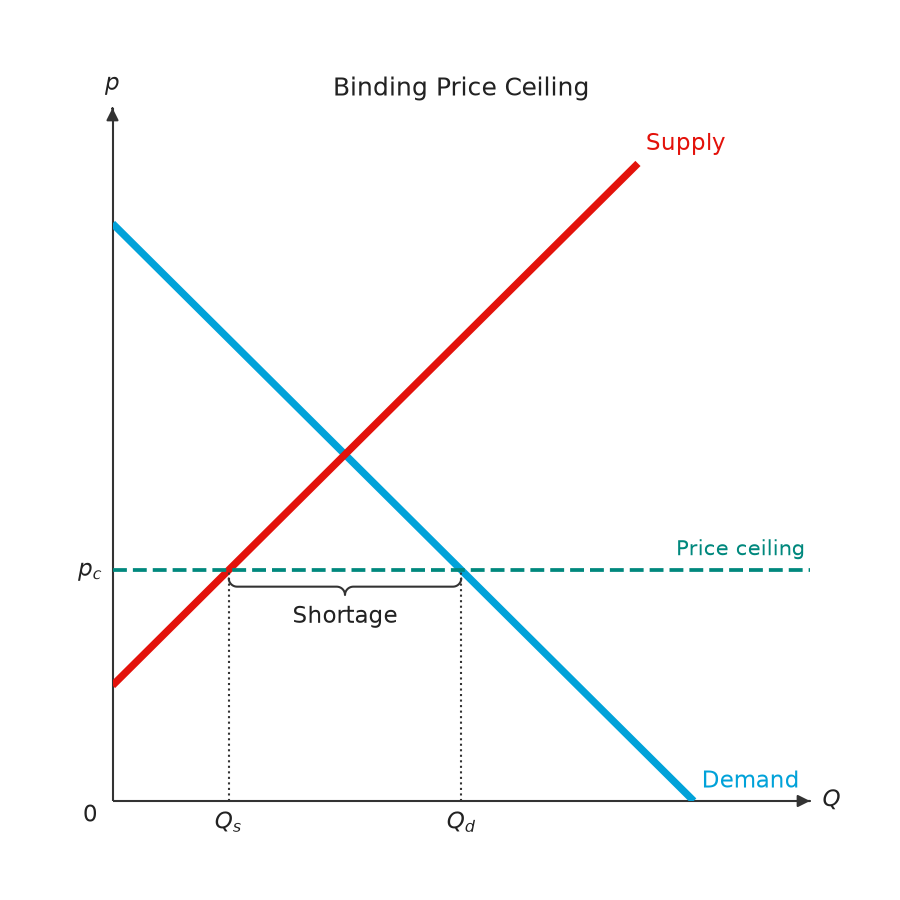 |
|
|
196
|
+
| 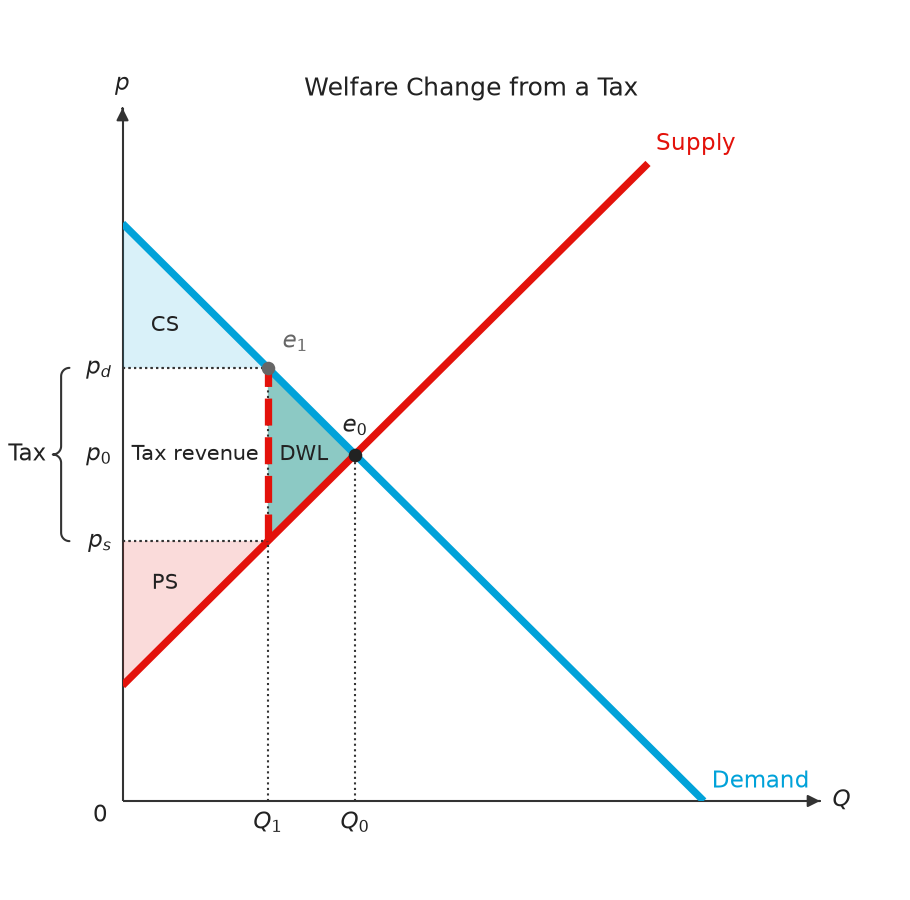 | 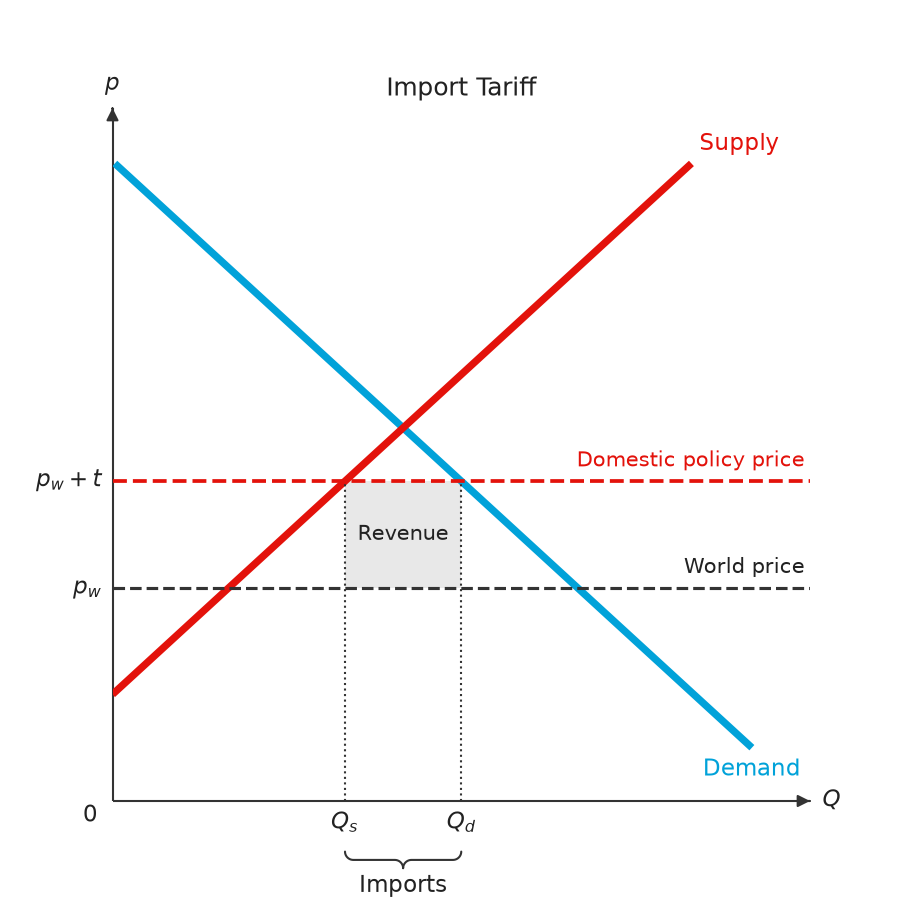 |
|
|
197
|
+
| 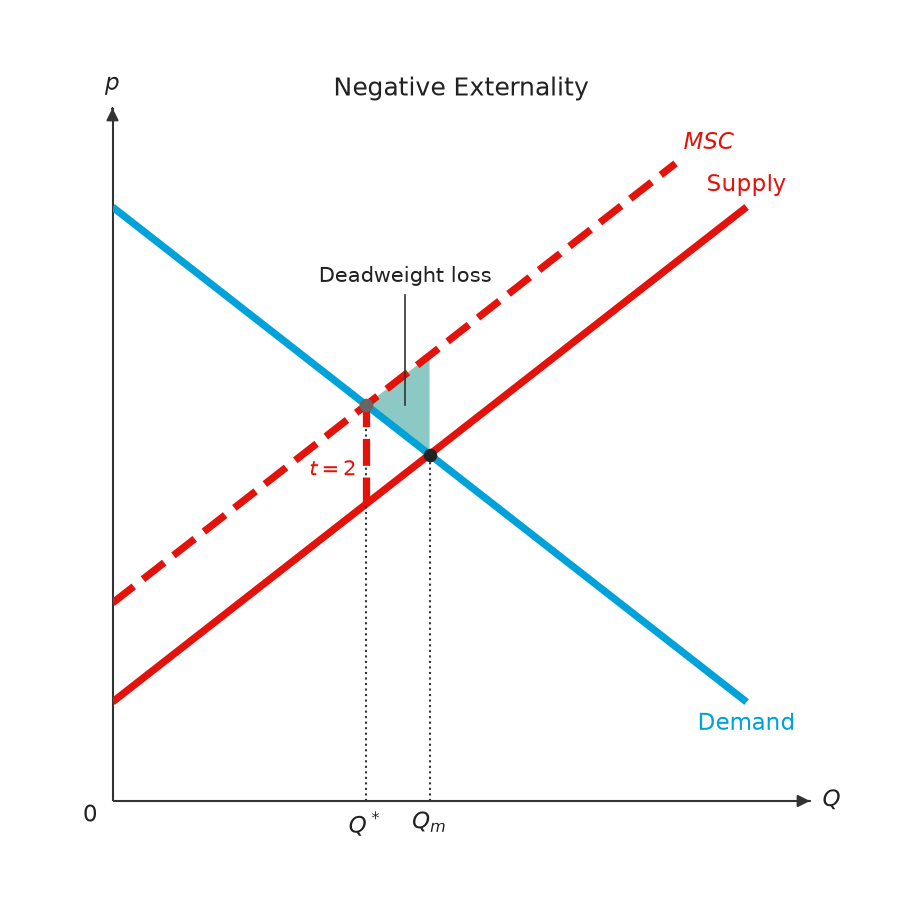 | 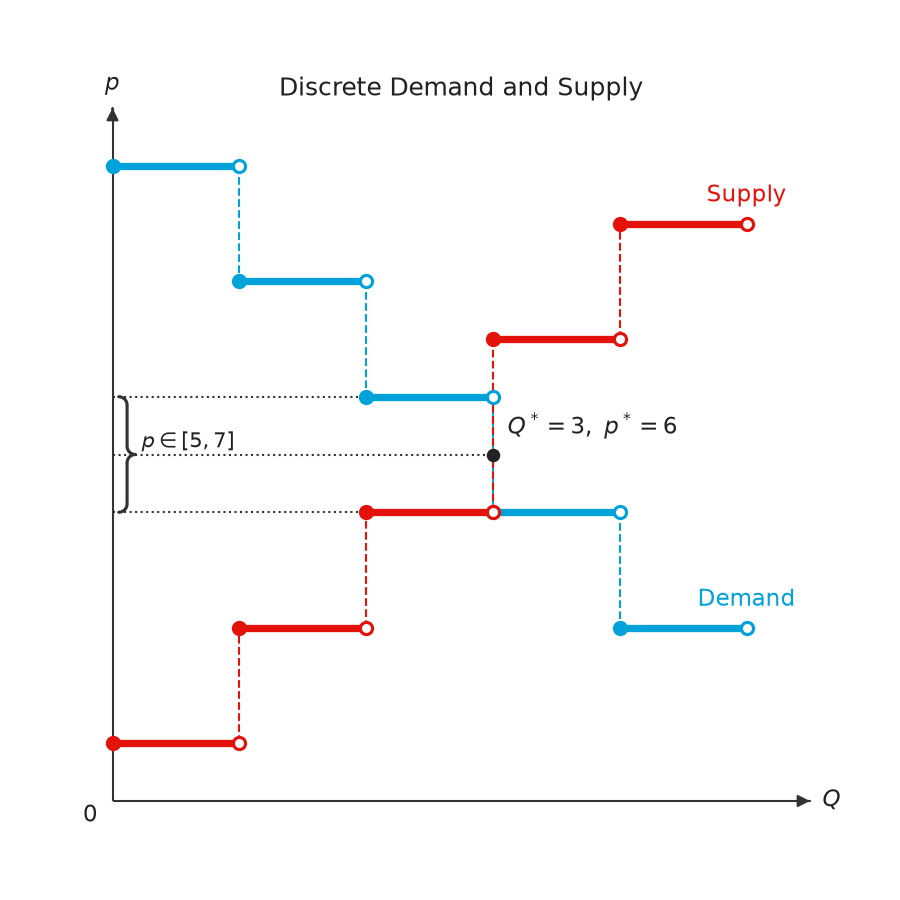 |
|
|
198
|
+
|
|
199
|
+
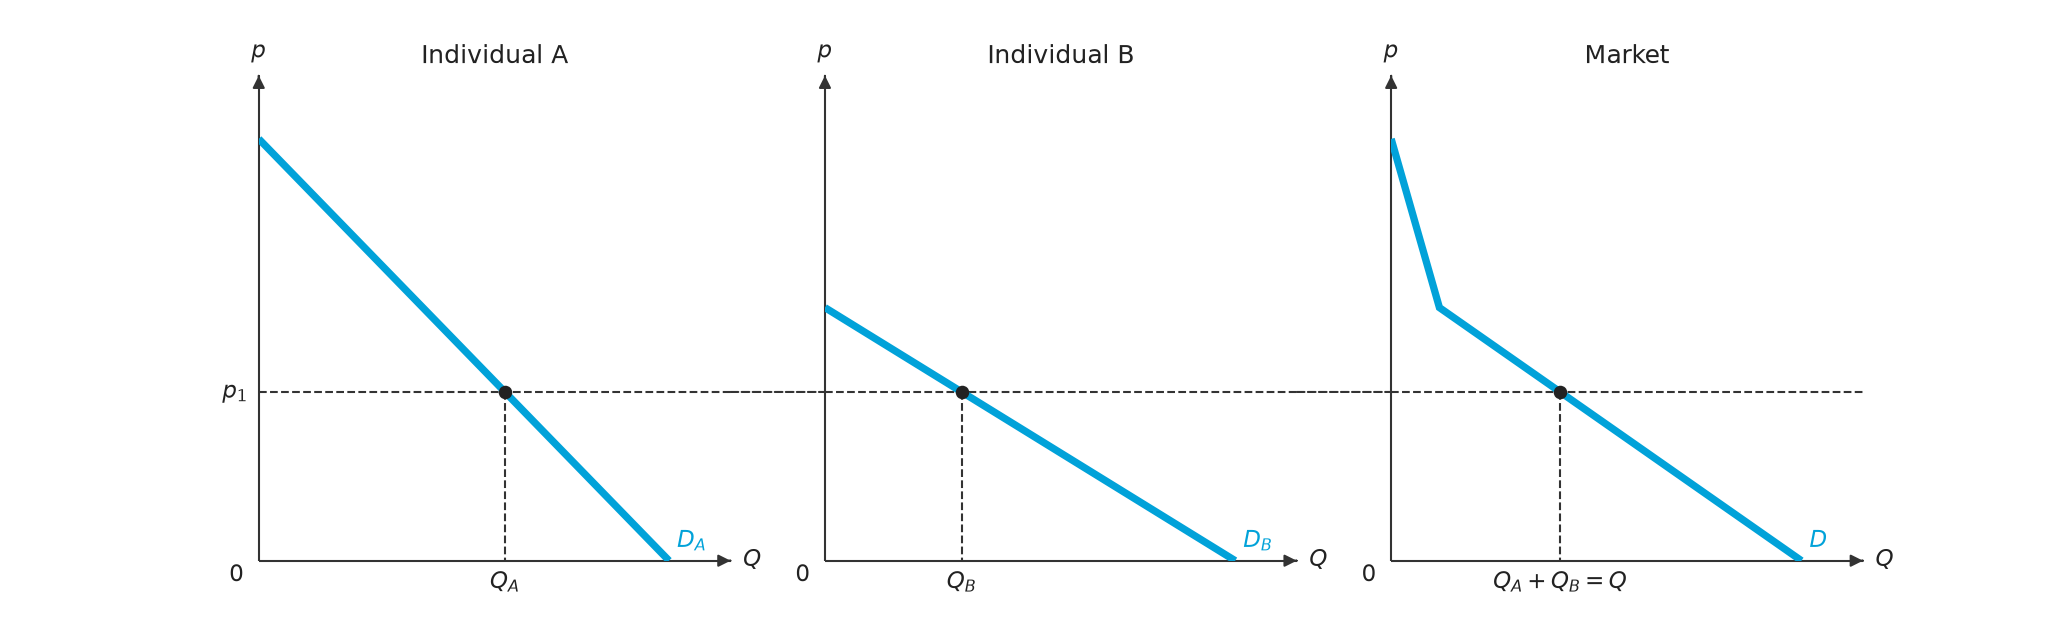
|
|
200
|
+
|
|
201
|
+
## Development
|
|
202
|
+
|
|
203
|
+
```bash
|
|
204
|
+
uv run ruff check src tests examples/scripts
|
|
205
|
+
uv run pytest -q
|
|
206
|
+
uv build
|
|
207
|
+
```
|
|
208
|
+
|
|
209
|
+
## PyPI Publishing
|
|
210
|
+
|
|
211
|
+
This repository is configured to publish from GitHub Actions using Trusted Publishing.
|
|
212
|
+
|
|
213
|
+
- Workflow: `.github/workflows/publish.yml`
|
|
214
|
+
- Trigger: push tag `v*` (for example `v0.1.0`)
|
|
215
|
+
- Publisher: `pypa/gh-action-pypi-publish@release/v1` with `id-token: write`
|
|
216
|
+
|
|
217
|
+
To release: bump the version in `pyproject.toml` and the CHANGELOG heading on a `release/vX.Y.Z` branch, merge it, then create the GitHub release `vX.Y.Z`; the tag push builds and publishes to PyPI.
|
|
218
|
+
|
|
219
|
+
## Brand Assets
|
|
220
|
+
|
|
221
|
+
Brand SVG assets and banner are tracked in the `docs` branch so raw URLs stay stable:
|
|
222
|
+
|
|
223
|
+
- Banner: `docs/assets/banner.svg`
|
|
224
|
+
- Logo: `docs/assets/logo.svg`
|
|
225
|
+
|
|
226
|
+
## Documentation
|
|
227
|
+
|
|
228
|
+
- Visual language (in Chinese): [`docs/visual-language.md`](https://github.com/EconViz/principle-viz/blob/main/docs/visual-language.md)
|
|
229
|
+
- Contribution guide: [`CONTRIBUTING.md`](https://github.com/EconViz/principle-viz/blob/main/CONTRIBUTING.md)
|
|
230
|
+
- Changelog: [`CHANGELOG.md`](https://github.com/EconViz/principle-viz/blob/main/CHANGELOG.md)
|
|
231
|
+
|
|
232
|
+
## License
|
|
233
|
+
|
|
234
|
+
MIT
|
|
@@ -0,0 +1,212 @@
|
|
|
1
|
+
<p align="center">
|
|
2
|
+
<img src="https://raw.githubusercontent.com/EconViz/principle-viz/docs/docs/assets/banner.svg" alt="principle-viz" width="480">
|
|
3
|
+
</p>
|
|
4
|
+
|
|
5
|
+
<p align="center">
|
|
6
|
+
<a href="https://github.com/EconViz/principle-viz/actions/workflows/publish.yml"><img alt="CI / Publish" src="https://img.shields.io/github/actions/workflow/status/EconViz/principle-viz/publish.yml?branch=main&style=flat-square&color=181818&labelColor=f3f3f3&label=CI%20%2F%20Publish"></a>
|
|
7
|
+
<a href="https://pypi.org/project/principle-viz/"><img alt="PyPI" src="https://img.shields.io/pypi/v/principle-viz?style=flat-square&color=181818&labelColor=f3f3f3"></a>
|
|
8
|
+
<a href="https://pypi.org/project/principle-viz/"><img alt="Python" src="https://img.shields.io/pypi/pyversions/principle-viz?style=flat-square&color=181818&labelColor=f3f3f3"></a>
|
|
9
|
+
<a href="https://opensource.org/licenses/MIT"><img alt="License" src="https://img.shields.io/badge/License-MIT-181818?style=flat-square&color=181818&labelColor=f3f3f3"></a>
|
|
10
|
+
<a href="https://github.com/EconViz/principle-viz/tree/docs"><img alt="Docs Branch" src="https://img.shields.io/badge/docs-branch-181818?style=flat-square&color=181818&labelColor=f3f3f3"></a>
|
|
11
|
+
</p>
|
|
12
|
+
|
|
13
|
+
`principle-viz` is a Python package for Principles of Economics market analysis and diagrams.
|
|
14
|
+
It focuses on **linear demand/supply** models with clean module boundaries across solver logic, policy layers, welfare decomposition, and plotting.
|
|
15
|
+
|
|
16
|
+
## Features
|
|
17
|
+
|
|
18
|
+
- Solve market equilibrium from linear demand and supply, or from discrete unit schedules
|
|
19
|
+
- Comparative statics: shifts of demand or supply, with the move from the old equilibrium to the new one
|
|
20
|
+
- Taxes (fixed, per-unit, ad valorem; legal incidence on buyers or sellers) and subsidies
|
|
21
|
+
- Price ceilings, price floors and the minimum wage, with the shortage, surplus or unemployment braced on the policy line
|
|
22
|
+
- Welfare decomposition: consumer and producer surplus, tax revenue, deadweight loss
|
|
23
|
+
- International trade (free trade, tariffs, quotas), externalities, common resources, public goods, loanable funds, the PPF and elasticity
|
|
24
|
+
- Market demand and supply as the horizontal sum of individual curves or schedules
|
|
25
|
+
- Textbook-style figures built on [MosaicKit](https://github.com/EconViz/mosaickit): square plots, curves named directly instead of a legend, LaTeX labels, values marked on the axes, and labels placed so they cover nothing
|
|
26
|
+
- CLI workflows with JSON output
|
|
27
|
+
|
|
28
|
+
## Installation
|
|
29
|
+
|
|
30
|
+
```bash
|
|
31
|
+
pip install principle-viz
|
|
32
|
+
```
|
|
33
|
+
|
|
34
|
+
For development:
|
|
35
|
+
|
|
36
|
+
```bash
|
|
37
|
+
git clone https://github.com/EconViz/principle-viz.git
|
|
38
|
+
cd principle-viz
|
|
39
|
+
uv sync
|
|
40
|
+
```
|
|
41
|
+
|
|
42
|
+
## Quick Start
|
|
43
|
+
|
|
44
|
+
```python
|
|
45
|
+
from principle_viz.core.line import Line
|
|
46
|
+
from principle_viz.core.equilibrium import solve_equilibrium
|
|
47
|
+
from principle_viz.plot.figure import MarketFigure
|
|
48
|
+
|
|
49
|
+
demand = Line.from_inverse(10.0, -1.0)
|
|
50
|
+
supply = Line.from_inverse(2.0, 1.0)
|
|
51
|
+
eq = solve_equilibrium(demand, supply)
|
|
52
|
+
|
|
53
|
+
fig = MarketFigure(x_max=12, y_max=12, title="Basic Equilibrium")
|
|
54
|
+
fig.add_curves(demand, supply, q_max=10)
|
|
55
|
+
fig.add_equilibrium(eq)
|
|
56
|
+
fig.finalize()
|
|
57
|
+
fig.save("basic_equilibrium.png")
|
|
58
|
+
fig.close()
|
|
59
|
+
```
|
|
60
|
+
|
|
61
|
+
## Tax Example (Consumer vs Producer Incidence)
|
|
62
|
+
|
|
63
|
+
```python
|
|
64
|
+
from principle_viz.core.line import Line
|
|
65
|
+
from principle_viz.plot.figure import MarketFigure
|
|
66
|
+
from principle_viz.policy.tax import TaxOn, TaxScenario, TaxType
|
|
67
|
+
|
|
68
|
+
demand = Line.from_inverse(10.0, -1.0)
|
|
69
|
+
supply = Line.from_inverse(0.0, 1.0)
|
|
70
|
+
scenario = TaxScenario(tax_type=TaxType.AD_VALOREM_TAX, amount=0.35, tax_on=TaxOn.CONSUMER)
|
|
71
|
+
|
|
72
|
+
fig = MarketFigure(x_max=12, y_max=12, title="Ad Valorem Tax")
|
|
73
|
+
fig.add_curves(demand, supply, q_max=10)
|
|
74
|
+
fig.add_tax_transform(demand, supply, scenario, q_max=10)
|
|
75
|
+
fig.finalize()
|
|
76
|
+
fig.save("tax_ad_valorem_consumer.png")
|
|
77
|
+
fig.close()
|
|
78
|
+
```
|
|
79
|
+
|
|
80
|
+
## Price Controls
|
|
81
|
+
|
|
82
|
+
```python
|
|
83
|
+
from principle_viz.core.controls import (
|
|
84
|
+
PriceControlScenario,
|
|
85
|
+
PriceControlType,
|
|
86
|
+
evaluate_price_control,
|
|
87
|
+
)
|
|
88
|
+
from principle_viz.core.line import Line
|
|
89
|
+
from principle_viz.plot.figure import MarketFigure
|
|
90
|
+
|
|
91
|
+
demand = Line.from_inverse(10.0, -1.0)
|
|
92
|
+
supply = Line.from_inverse(2.0, 1.0)
|
|
93
|
+
ceiling = evaluate_price_control(
|
|
94
|
+
demand, supply, PriceControlScenario(PriceControlType.CEILING, 4.0)
|
|
95
|
+
)
|
|
96
|
+
|
|
97
|
+
fig = MarketFigure(x_max=12, y_max=12, title="Binding Price Ceiling")
|
|
98
|
+
fig.add_curves(demand, supply, q_max=10)
|
|
99
|
+
fig.add_price_control(ceiling) # "Shortage" braced below the ceiling line
|
|
100
|
+
fig.finalize()
|
|
101
|
+
fig.save("price_ceiling.png")
|
|
102
|
+
fig.close()
|
|
103
|
+
```
|
|
104
|
+
|
|
105
|
+
`add_price_control(..., gap_brace="axis")` braces the gap under the quantity axis instead; `add_minimum_wage()` draws the labor-market version.
|
|
106
|
+
|
|
107
|
+
## Market Demand and Supply from Individuals
|
|
108
|
+
|
|
109
|
+
Individual curves sum horizontally into the market curve. Each buyer buys nothing above their choke price and each seller sells nothing below their minimum price, so the market curve is piecewise linear with a kink at each of those prices.
|
|
110
|
+
|
|
111
|
+
```python
|
|
112
|
+
from principle_viz import (
|
|
113
|
+
DiscreteDemand,
|
|
114
|
+
demand_aggregation_figure,
|
|
115
|
+
discrete_demand_aggregation_figure,
|
|
116
|
+
market_demand,
|
|
117
|
+
market_supply,
|
|
118
|
+
solve_piecewise_equilibrium,
|
|
119
|
+
)
|
|
120
|
+
from principle_viz.core.line import Line
|
|
121
|
+
|
|
122
|
+
a = Line.from_inverse(10, -2) # p = 10 - 2Q
|
|
123
|
+
b = Line.from_inverse(6, -0.5) # p = 6 - 0.5Q
|
|
124
|
+
demand = market_demand((a, b))
|
|
125
|
+
demand.points # ((0, 10), (2, 6), (17, 0)), kink at B's choke price
|
|
126
|
+
demand.q_at(4) # 7 = Q_A + Q_B
|
|
127
|
+
|
|
128
|
+
supply = market_supply((Line.from_inverse(2, 1), Line.from_inverse(5, 0.5)), p_max=10)
|
|
129
|
+
solve_piecewise_equilibrium(demand, supply) # exact on each segment
|
|
130
|
+
|
|
131
|
+
# Individual A | individual B | market, with guides at p_1 showing Q_A + Q_B = Q.
|
|
132
|
+
# link_price=True runs the p_1 line across all three panels.
|
|
133
|
+
demand_aggregation_figure({"A": a, "B": b}, price=4, link_price=True).save(
|
|
134
|
+
"market_demand.png"
|
|
135
|
+
)
|
|
136
|
+
|
|
137
|
+
# Discrete: reservation prices combine into one market step schedule.
|
|
138
|
+
DiscreteDemand.combine(DiscreteDemand((10, 7, 4)), DiscreteDemand((8, 5, 2)))
|
|
139
|
+
discrete_demand_aggregation_figure(
|
|
140
|
+
{"A": DiscreteDemand((10, 7, 4)), "B": DiscreteDemand((8, 5, 2))}, price=6
|
|
141
|
+
).save("discrete_market_demand.png")
|
|
142
|
+
```
|
|
143
|
+
|
|
144
|
+
`supply_aggregation_figure` and `discrete_supply_aggregation_figure` draw the supply side. Examples: `examples/scripts/aggregation_*.py`, output under `examples/output/aggregation/`.
|
|
145
|
+
|
|
146
|
+
## CLI
|
|
147
|
+
|
|
148
|
+
```bash
|
|
149
|
+
principle-viz equilibrium \
|
|
150
|
+
--demand-intercept 10 --demand-slope -1 \
|
|
151
|
+
--supply-intercept 2 --supply-slope 1
|
|
152
|
+
|
|
153
|
+
principle-viz tax \
|
|
154
|
+
--demand-intercept 10 --demand-slope -1 \
|
|
155
|
+
--supply-intercept 2 --supply-slope 1 \
|
|
156
|
+
--tax-type per_unit --amount 1 --tax-on producer
|
|
157
|
+
```
|
|
158
|
+
|
|
159
|
+
## Examples
|
|
160
|
+
|
|
161
|
+
Run all examples:
|
|
162
|
+
|
|
163
|
+
```bash
|
|
164
|
+
uv run python examples/scripts/run_all.py
|
|
165
|
+
```
|
|
166
|
+
|
|
167
|
+
Generated images are grouped by topic under `examples/output/`: `equilibrium/`, `discrete/`, `aggregation/`, `taxation/`, `subsidy/`, `price_controls/`, `welfare/`, `trade/`, `market_failures/`, `factor_capital_markets/`, `elasticity/` and `ppf/`.
|
|
168
|
+
|
|
169
|
+
### Example Gallery
|
|
170
|
+
|
|
171
|
+
| | |
|
|
172
|
+
|---|---|
|
|
173
|
+
|  |  |
|
|
174
|
+
|  |  |
|
|
175
|
+
|  |  |
|
|
176
|
+
|
|
177
|
+

|
|
178
|
+
|
|
179
|
+
## Development
|
|
180
|
+
|
|
181
|
+
```bash
|
|
182
|
+
uv run ruff check src tests examples/scripts
|
|
183
|
+
uv run pytest -q
|
|
184
|
+
uv build
|
|
185
|
+
```
|
|
186
|
+
|
|
187
|
+
## PyPI Publishing
|
|
188
|
+
|
|
189
|
+
This repository is configured to publish from GitHub Actions using Trusted Publishing.
|
|
190
|
+
|
|
191
|
+
- Workflow: `.github/workflows/publish.yml`
|
|
192
|
+
- Trigger: push tag `v*` (for example `v0.1.0`)
|
|
193
|
+
- Publisher: `pypa/gh-action-pypi-publish@release/v1` with `id-token: write`
|
|
194
|
+
|
|
195
|
+
To release: bump the version in `pyproject.toml` and the CHANGELOG heading on a `release/vX.Y.Z` branch, merge it, then create the GitHub release `vX.Y.Z`; the tag push builds and publishes to PyPI.
|
|
196
|
+
|
|
197
|
+
## Brand Assets
|
|
198
|
+
|
|
199
|
+
Brand SVG assets and banner are tracked in the `docs` branch so raw URLs stay stable:
|
|
200
|
+
|
|
201
|
+
- Banner: `docs/assets/banner.svg`
|
|
202
|
+
- Logo: `docs/assets/logo.svg`
|
|
203
|
+
|
|
204
|
+
## Documentation
|
|
205
|
+
|
|
206
|
+
- Visual language (in Chinese): [`docs/visual-language.md`](https://github.com/EconViz/principle-viz/blob/main/docs/visual-language.md)
|
|
207
|
+
- Contribution guide: [`CONTRIBUTING.md`](https://github.com/EconViz/principle-viz/blob/main/CONTRIBUTING.md)
|
|
208
|
+
- Changelog: [`CHANGELOG.md`](https://github.com/EconViz/principle-viz/blob/main/CHANGELOG.md)
|
|
209
|
+
|
|
210
|
+
## License
|
|
211
|
+
|
|
212
|
+
MIT
|
|
@@ -0,0 +1,65 @@
|
|
|
1
|
+
[project]
|
|
2
|
+
name = "principle-viz"
|
|
3
|
+
version = "0.10.0"
|
|
4
|
+
description = "Principles of Economics toolkit for demand/supply analytics and diagrams."
|
|
5
|
+
readme = "README.md"
|
|
6
|
+
license = "MIT"
|
|
7
|
+
license-files = ["LICENSE"]
|
|
8
|
+
requires-python = ">=3.10,<4.0"
|
|
9
|
+
keywords = [
|
|
10
|
+
"economics",
|
|
11
|
+
"microeconomics",
|
|
12
|
+
"demand",
|
|
13
|
+
"supply",
|
|
14
|
+
"equilibrium",
|
|
15
|
+
"welfare",
|
|
16
|
+
"tax",
|
|
17
|
+
]
|
|
18
|
+
classifiers = [
|
|
19
|
+
"Programming Language :: Python :: 3",
|
|
20
|
+
"Programming Language :: Python :: 3 :: Only",
|
|
21
|
+
"Operating System :: OS Independent",
|
|
22
|
+
"Intended Audience :: Education",
|
|
23
|
+
"Topic :: Scientific/Engineering",
|
|
24
|
+
]
|
|
25
|
+
dependencies = ["mosaickit>=0.5.1,<0.6.0"]
|
|
26
|
+
|
|
27
|
+
[[project.authors]]
|
|
28
|
+
name = "Anthony Sung"
|
|
29
|
+
email = "sungpinyue@gmail.com"
|
|
30
|
+
|
|
31
|
+
[project.scripts]
|
|
32
|
+
principle-viz = "principle_viz.cli.main:main"
|
|
33
|
+
|
|
34
|
+
[project.urls]
|
|
35
|
+
Homepage = "https://github.com/EconViz/principle-viz"
|
|
36
|
+
Repository = "https://github.com/EconViz/principle-viz"
|
|
37
|
+
Documentation = "https://github.com/EconViz/principle-viz"
|
|
38
|
+
Changelog = "https://github.com/EconViz/principle-viz/blob/main/CHANGELOG.md"
|
|
39
|
+
|
|
40
|
+
[build-system]
|
|
41
|
+
requires = ["uv_build>=0.12.1,<0.13.0"]
|
|
42
|
+
build-backend = "uv_build"
|
|
43
|
+
|
|
44
|
+
[tool.uv.build-backend]
|
|
45
|
+
module-name = "principle_viz"
|
|
46
|
+
module-root = "src"
|
|
47
|
+
|
|
48
|
+
[tool.pytest.ini_options]
|
|
49
|
+
testpaths = ["tests"]
|
|
50
|
+
addopts = "--maxfail=1 --disable-warnings -q"
|
|
51
|
+
|
|
52
|
+
[tool.coverage.run]
|
|
53
|
+
source = ["principle_viz"]
|
|
54
|
+
|
|
55
|
+
[tool.coverage.report]
|
|
56
|
+
show_missing = true
|
|
57
|
+
skip_covered = false
|
|
58
|
+
fail_under = 90
|
|
59
|
+
|
|
60
|
+
[dependency-groups]
|
|
61
|
+
dev = [
|
|
62
|
+
"pytest>=8.0.0,<9.0.0",
|
|
63
|
+
"pytest-cov>=5.0.0,<6.0.0",
|
|
64
|
+
"ruff>=0.5.0,<1.0.0",
|
|
65
|
+
]
|
|
@@ -0,0 +1,52 @@
|
|
|
1
|
+
[project]
|
|
2
|
+
name = "principle-viz"
|
|
3
|
+
version = "0.10.0"
|
|
4
|
+
description = "Principles of Economics toolkit for demand/supply analytics and diagrams."
|
|
5
|
+
readme = "README.md"
|
|
6
|
+
authors = [{ name = "Anthony Sung", email = "sungpinyue@gmail.com" }]
|
|
7
|
+
license = "MIT"
|
|
8
|
+
license-files = ["LICENSE"]
|
|
9
|
+
requires-python = ">=3.10,<4.0"
|
|
10
|
+
keywords = ["economics", "microeconomics", "demand", "supply", "equilibrium", "welfare", "tax"]
|
|
11
|
+
classifiers = [
|
|
12
|
+
"Programming Language :: Python :: 3",
|
|
13
|
+
"Programming Language :: Python :: 3 :: Only",
|
|
14
|
+
"Operating System :: OS Independent",
|
|
15
|
+
"Intended Audience :: Education",
|
|
16
|
+
"Topic :: Scientific/Engineering",
|
|
17
|
+
]
|
|
18
|
+
dependencies = [
|
|
19
|
+
"mosaickit>=0.5.1,<0.6.0",
|
|
20
|
+
]
|
|
21
|
+
|
|
22
|
+
[project.scripts]
|
|
23
|
+
principle-viz = "principle_viz.cli.main:main"
|
|
24
|
+
|
|
25
|
+
[project.urls]
|
|
26
|
+
Homepage = "https://github.com/EconViz/principle-viz"
|
|
27
|
+
Repository = "https://github.com/EconViz/principle-viz"
|
|
28
|
+
Documentation = "https://github.com/EconViz/principle-viz"
|
|
29
|
+
Changelog = "https://github.com/EconViz/principle-viz/blob/main/CHANGELOG.md"
|
|
30
|
+
|
|
31
|
+
[build-system]
|
|
32
|
+
requires = ["uv_build>=0.12.1,<0.13.0"]
|
|
33
|
+
build-backend = "uv_build"
|
|
34
|
+
|
|
35
|
+
[tool.uv.build-backend]
|
|
36
|
+
module-name = "principle_viz"
|
|
37
|
+
module-root = "src"
|
|
38
|
+
|
|
39
|
+
[dependency-groups]
|
|
40
|
+
dev = ["pytest>=8.0.0,<9.0.0", "pytest-cov>=5.0.0,<6.0.0", "ruff>=0.5.0,<1.0.0"]
|
|
41
|
+
|
|
42
|
+
[tool.pytest.ini_options]
|
|
43
|
+
testpaths = ["tests"]
|
|
44
|
+
addopts = "--maxfail=1 --disable-warnings -q"
|
|
45
|
+
|
|
46
|
+
[tool.coverage.run]
|
|
47
|
+
source = ["principle_viz"]
|
|
48
|
+
|
|
49
|
+
[tool.coverage.report]
|
|
50
|
+
show_missing = true
|
|
51
|
+
skip_covered = false
|
|
52
|
+
fail_under = 90
|