plotpress 0.24.0__tar.gz → 0.25.0__tar.gz
This diff represents the content of publicly available package versions that have been released to one of the supported registries. The information contained in this diff is provided for informational purposes only and reflects changes between package versions as they appear in their respective public registries.
- {plotpress-0.24.0 → plotpress-0.25.0}/PKG-INFO +112 -43
- {plotpress-0.24.0 → plotpress-0.25.0}/README.md +111 -42
- plotpress-0.25.0/plotpress/_version.py +1 -0
- {plotpress-0.24.0 → plotpress-0.25.0}/plotpress/figure.py +28 -5
- {plotpress-0.24.0 → plotpress-0.25.0}/plotpress/vega.py +68 -2
- {plotpress-0.24.0 → plotpress-0.25.0}/plotpress/vega_lite.py +88 -17
- {plotpress-0.24.0 → plotpress-0.25.0}/plotpress.egg-info/PKG-INFO +112 -43
- {plotpress-0.24.0 → plotpress-0.25.0}/tests/test_svg_output.py +46 -0
- {plotpress-0.24.0 → plotpress-0.25.0}/tests/test_vega_lite_output.py +16 -2
- {plotpress-0.24.0 → plotpress-0.25.0}/tests/test_vega_output.py +12 -2
- plotpress-0.24.0/plotpress/_version.py +0 -1
- {plotpress-0.24.0 → plotpress-0.25.0}/LICENSE +0 -0
- {plotpress-0.24.0 → plotpress-0.25.0}/plotpress/__init__.py +0 -0
- {plotpress-0.24.0 → plotpress-0.25.0}/plotpress/_interactive.py +0 -0
- {plotpress-0.24.0 → plotpress-0.25.0}/plotpress/_spectral.py +0 -0
- {plotpress-0.24.0 → plotpress-0.25.0}/plotpress/artists.py +0 -0
- {plotpress-0.24.0 → plotpress-0.25.0}/plotpress/axes.py +0 -0
- {plotpress-0.24.0 → plotpress-0.25.0}/plotpress/colors.py +0 -0
- {plotpress-0.24.0 → plotpress-0.25.0}/plotpress/fonts/__init__.py +0 -0
- {plotpress-0.24.0 → plotpress-0.25.0}/plotpress/fonts/families.py +0 -0
- {plotpress-0.24.0 → plotpress-0.25.0}/plotpress/fonts/installed.py +0 -0
- {plotpress-0.24.0 → plotpress-0.25.0}/plotpress/fonts/metrics.py +0 -0
- {plotpress-0.24.0 → plotpress-0.25.0}/plotpress/png.py +0 -0
- {plotpress-0.24.0 → plotpress-0.25.0}/plotpress/polar.py +0 -0
- {plotpress-0.24.0 → plotpress-0.25.0}/plotpress/primitives.py +0 -0
- {plotpress-0.24.0 → plotpress-0.25.0}/plotpress/qt.py +0 -0
- {plotpress-0.24.0 → plotpress-0.25.0}/plotpress/raster.py +0 -0
- {plotpress-0.24.0 → plotpress-0.25.0}/plotpress/style.py +0 -0
- {plotpress-0.24.0 → plotpress-0.25.0}/plotpress/svg.py +0 -0
- {plotpress-0.24.0 → plotpress-0.25.0}/plotpress/ticker.py +0 -0
- {plotpress-0.24.0 → plotpress-0.25.0}/plotpress/transform.py +0 -0
- {plotpress-0.24.0 → plotpress-0.25.0}/plotpress.egg-info/SOURCES.txt +0 -0
- {plotpress-0.24.0 → plotpress-0.25.0}/plotpress.egg-info/dependency_links.txt +0 -0
- {plotpress-0.24.0 → plotpress-0.25.0}/plotpress.egg-info/requires.txt +0 -0
- {plotpress-0.24.0 → plotpress-0.25.0}/plotpress.egg-info/top_level.txt +0 -0
- {plotpress-0.24.0 → plotpress-0.25.0}/pyproject.toml +0 -0
- {plotpress-0.24.0 → plotpress-0.25.0}/setup.cfg +0 -0
- {plotpress-0.24.0 → plotpress-0.25.0}/tests/test_adopt_axes.py +0 -0
- {plotpress-0.24.0 → plotpress-0.25.0}/tests/test_axes.py +0 -0
- {plotpress-0.24.0 → plotpress-0.25.0}/tests/test_axes_api_audit.py +0 -0
- {plotpress-0.24.0 → plotpress-0.25.0}/tests/test_colors.py +0 -0
- {plotpress-0.24.0 → plotpress-0.25.0}/tests/test_distributions.py +0 -0
- {plotpress-0.24.0 → plotpress-0.25.0}/tests/test_fonts.py +0 -0
- {plotpress-0.24.0 → plotpress-0.25.0}/tests/test_input_validation.py +0 -0
- {plotpress-0.24.0 → plotpress-0.25.0}/tests/test_load_data_xarray.py +0 -0
- {plotpress-0.24.0 → plotpress-0.25.0}/tests/test_matplotlib_gaps.py +0 -0
- {plotpress-0.24.0 → plotpress-0.25.0}/tests/test_matplotlib_parity.py +0 -0
- {plotpress-0.24.0 → plotpress-0.25.0}/tests/test_no_global_state.py +0 -0
- {plotpress-0.24.0 → plotpress-0.25.0}/tests/test_performance.py +0 -0
- {plotpress-0.24.0 → plotpress-0.25.0}/tests/test_pick_interactive.py +0 -0
- {plotpress-0.24.0 → plotpress-0.25.0}/tests/test_png.py +0 -0
- {plotpress-0.24.0 → plotpress-0.25.0}/tests/test_polar.py +0 -0
- {plotpress-0.24.0 → plotpress-0.25.0}/tests/test_primitives.py +0 -0
- {plotpress-0.24.0 → plotpress-0.25.0}/tests/test_python_compat.py +0 -0
- {plotpress-0.24.0 → plotpress-0.25.0}/tests/test_qt.py +0 -0
- {plotpress-0.24.0 → plotpress-0.25.0}/tests/test_render_all.py +0 -0
- {plotpress-0.24.0 → plotpress-0.25.0}/tests/test_spectral.py +0 -0
- {plotpress-0.24.0 → plotpress-0.25.0}/tests/test_style.py +0 -0
- {plotpress-0.24.0 → plotpress-0.25.0}/tests/test_summary.py +0 -0
- {plotpress-0.24.0 → plotpress-0.25.0}/tests/test_units.py +0 -0
|
@@ -1,6 +1,6 @@
|
|
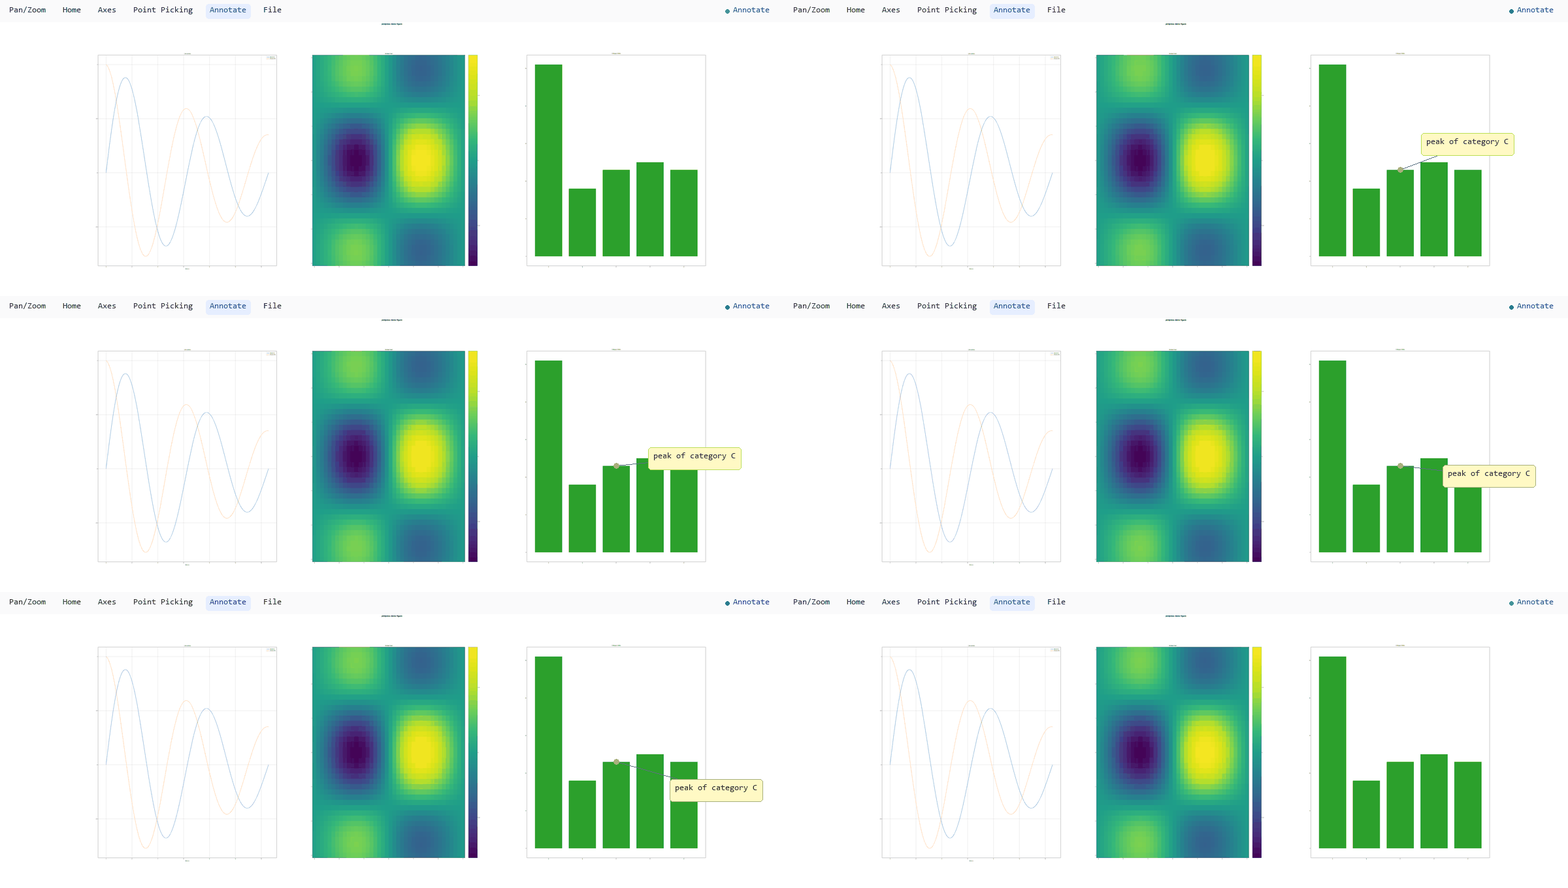
|
1
1
|
Metadata-Version: 2.4
|
|
2
2
|
Name: plotpress
|
|
3
|
-
Version: 0.
|
|
3
|
+
Version: 0.25.0
|
|
4
4
|
Summary: A fast, figure-centric plotting library with a matplotlib-like API, no global state, and one figure exportable to SVG, PNG, PDF, interactive HTML, or Vega/Vega-Lite.
|
|
5
5
|
Author: plotpress contributors
|
|
6
6
|
License: MIT
|
|
@@ -58,11 +58,15 @@ Dynamic: license-file
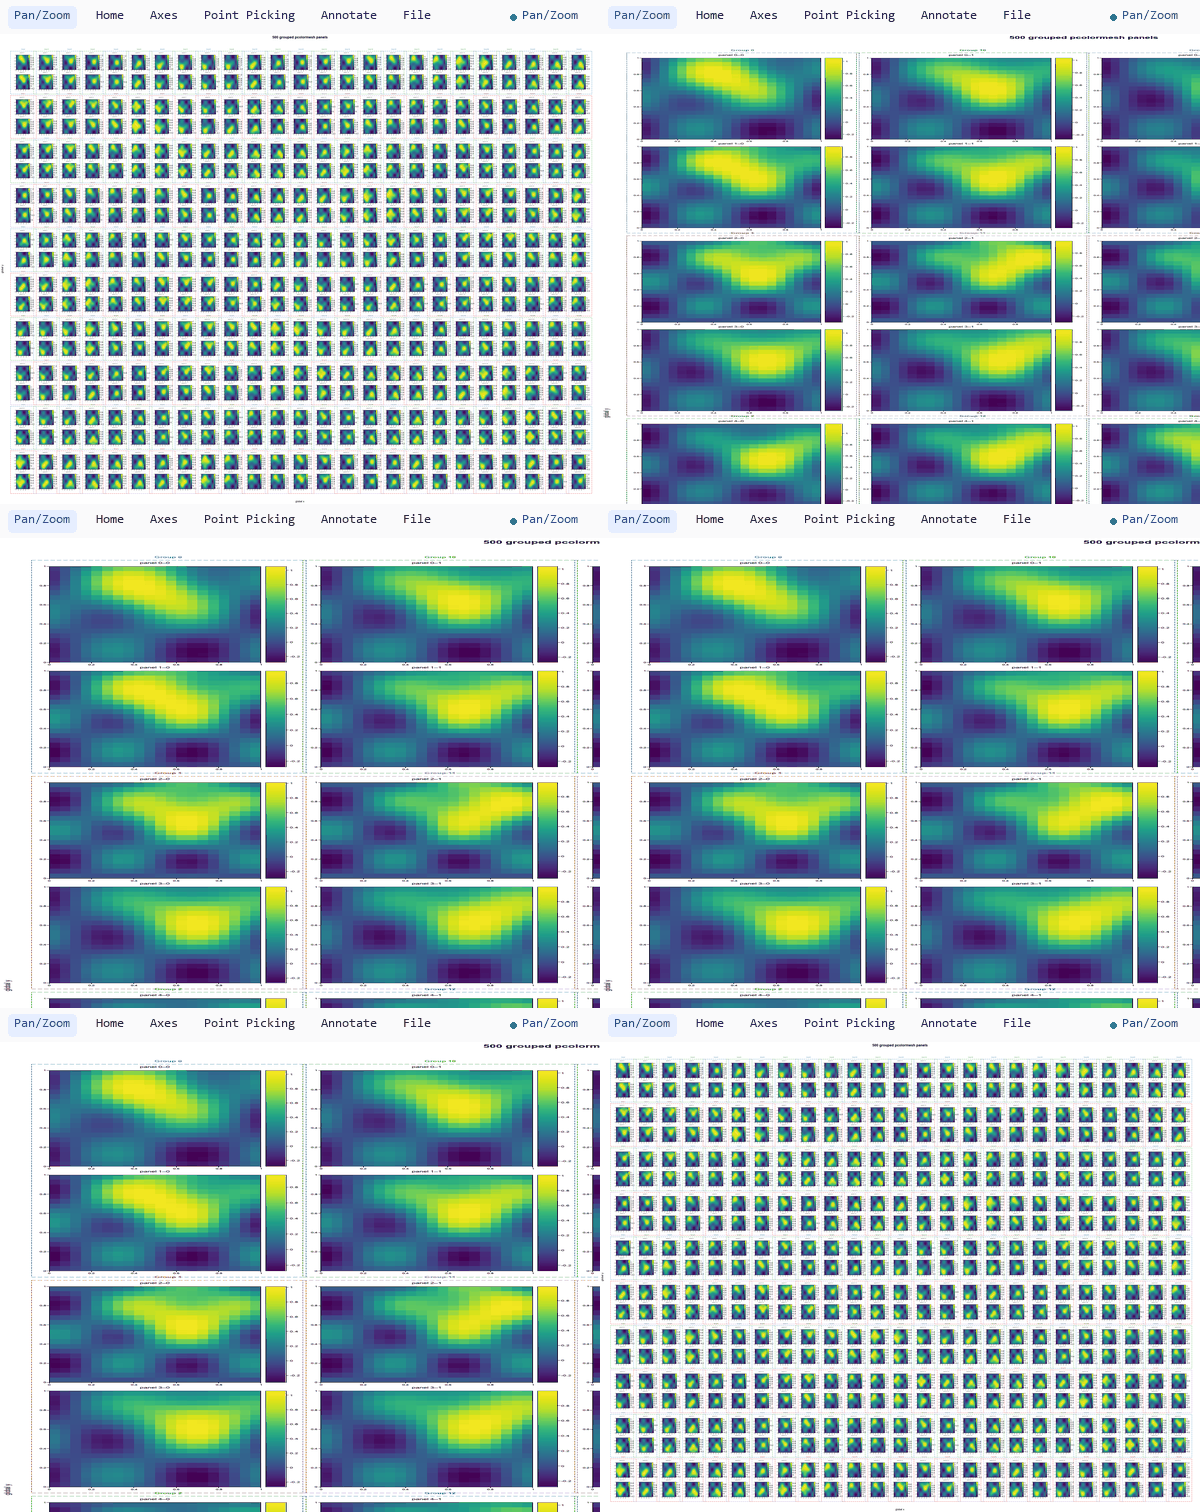
|
|
|
58
58
|
|
|
59
59
|
# plotpress
|
|
60
60
|
|
|
61
|
-
|
|
62
|
-
|
|
63
|
-
|
|
64
|
-
|
|
65
|
-
|
|
61
|
+
**Scientific plots you can explore, share, and reuse.**
|
|
62
|
+
|
|
63
|
+
A **fast, dependency-light** plotting library for scientific computing, with
|
|
64
|
+
a **matplotlib-shaped** API and **no compiled extension** — install it
|
|
65
|
+
anywhere Python does, from notebooks to CI pipelines to offline environments.
|
|
66
|
+
It renders one figure to **SVG, PNG, PDF, Vega/Vega-Lite, and self-contained
|
|
67
|
+
interactive HTML** — the HTML carrying a full pan/zoom, point-picking, and
|
|
68
|
+
annotation toolbar. **No global state**, either — a `Figure` owns its own
|
|
69
|
+
axes and its own `Style`.
|
|
66
70
|
|
|
67
71
|
```python
|
|
68
72
|
import plotpress
|
|
@@ -86,9 +90,9 @@ genuinely shareable: the plotted data and the toolbar's own JS are both
|
|
|
86
90
|
inlined into that one file, so anyone can open and interact with it with
|
|
87
91
|
nothing installed on their end — no Python, no plotpress, no internet
|
|
88
92
|
connection, just a browser. Email it, drop it in a chat, put it on a USB
|
|
89
|
-
stick — it still works.
|
|
90
|
-
|
|
91
|
-
to the
|
|
93
|
+
stick — it still works. Send someone a file, not a service they have to
|
|
94
|
+
install. PyPI/GitHub READMEs can't run the page's own script, so the four
|
|
95
|
+
GIFs below stand in for it; open one yourself (or click through to the
|
|
92
96
|
[real-applications gallery](https://jrvannucci.github.io/plotpress/auto_applications/index.html),
|
|
93
97
|
embedded exactly this way) and it's fully live.
|
|
94
98
|
|
|
@@ -106,7 +110,16 @@ point it's pinned to:
|
|
|
106
110
|
|
|
107
111
|
|
|
108
112
|
|
|
109
|
-
|
|
113
|
+
**At scale**, every gesture above still works the same way on a figure with
|
|
114
|
+
hundreds of axes — zoom from the full grid into a handful of panels, pan,
|
|
115
|
+
pick a value, remove it, pick again and drag its label, pan to a distant
|
|
116
|
+
group, annotate, then back Home (the figure is
|
|
117
|
+
[`docs/examples/grouping/plot_13_full_scale_demo.py`](https://jrvannucci.github.io/plotpress/auto_examples/grouping/plot_13_full_scale_demo.html) —
|
|
118
|
+
500 `pcolormesh` panels, 250 groups, each with its own colorbar):
|
|
119
|
+
|
|
120
|
+
|
|
121
|
+
|
|
122
|
+
## One figure. Many destinations.
|
|
110
123
|
|
|
111
124
|
The same `Figure` built once from the matplotlib-shaped API renders to every
|
|
112
125
|
format below — no separate figure per output, no plugin to install:
|
|
@@ -125,19 +138,22 @@ the core Pillow) svglib + inlined -- real pixel- str
|
|
|
125
138
|
|
|
126
139
|
`fig.save(path, ...)` dispatches on the file extension for the first four;
|
|
127
140
|
`fig.to_vega()` / `fig.to_vega_lite()` return a JSON specification as a plain
|
|
128
|
-
`dict` for a separate Vega/Vega-Lite runtime to render
|
|
129
|
-
|
|
130
|
-
dashboard or notebook
|
|
141
|
+
`dict` for a separate Vega/Vega-Lite runtime to render — a bridge from
|
|
142
|
+
scientific Python to web-native visualization, for handing a figure to an
|
|
143
|
+
existing Vega-based dashboard or notebook without rebuilding the plot from
|
|
144
|
+
scratch. See the
|
|
131
145
|
[architecture docs](https://jrvannucci.github.io/plotpress/user_guide/architecture.html)
|
|
132
146
|
for exactly how much of the rendering pipeline each of these six actually
|
|
133
147
|
shares, and where a format gets its own dedicated path instead.
|
|
134
148
|
|
|
135
149
|
## Reading a figure back out of HTML
|
|
136
150
|
|
|
137
|
-
The interactive HTML above isn't a
|
|
138
|
-
and the figure's own layout as JSON
|
|
139
|
-
|
|
140
|
-
figure back out and rebuild it
|
|
151
|
+
A plot doesn't have to be a dead image. The interactive HTML above isn't a
|
|
152
|
+
one-way trip: it embeds the plotted data and the figure's own layout as JSON
|
|
153
|
+
alongside the SVG, so a later process — with none of the Python objects that
|
|
154
|
+
built it still around — can read a figure back out and rebuild it. The
|
|
155
|
+
figure becomes a portable representation of the data it displays, not just a
|
|
156
|
+
picture of it:
|
|
141
157
|
|
|
142
158
|
```
|
|
143
159
|
a saved .html (Figure.save(path, interactive=True))
|
|
@@ -182,6 +198,73 @@ layout still available under `ds.attrs["layout"]` for
|
|
|
182
198
|
[data round-trip example](https://jrvannucci.github.io/plotpress/auto_examples/data_roundtrip/index.html)
|
|
183
199
|
for both paths worked through end to end.
|
|
184
200
|
|
|
201
|
+
## What makes it different
|
|
202
|
+
|
|
203
|
+
1. **No `pyplot`, no globals.** There is no "current figure/axes" and no global
|
|
204
|
+
`rcParams`. A `Figure` owns its axes and its own `Style`; two figures never
|
|
205
|
+
share mutable state. `plotpress.subplots()` returns `(fig, axes)` just like
|
|
206
|
+
`plt.subplots()` — but touches no global state.
|
|
207
|
+
2. **matplotlib-*shaped* API** so moving code either direction is mostly
|
|
208
|
+
mechanical: `Figure`/`Axes`, `plot`, `scatter`, `pcolormesh`,
|
|
209
|
+
`set_xlabel/ylabel/title`, `set_xlim/ylim`, `grid`, `legend`, `colorbar`. It
|
|
210
|
+
is shaped, not drop-in — there's no `pyplot` state machine and not every
|
|
211
|
+
matplotlib keyword is present; treat the gallery as the compatibility surface.
|
|
212
|
+
3. **SVG-first + built for speed.** Output is vector SVG; only mesh/image layers
|
|
213
|
+
are rasterized (as a single embedded `<image>`, not thousands of rects). Each
|
|
214
|
+
series is one `<path>`. It's **pure Python + NumPy** — vectorized coordinate
|
|
215
|
+
formatting, min/max-decimated huge lines — with **no compiled extension**, so
|
|
216
|
+
it installs everywhere pip does.
|
|
217
|
+
|
|
218
|
+
## Scientific visualization, end to end
|
|
219
|
+
|
|
220
|
+
plotpress is designed around the way scientific figures actually get used:
|
|
221
|
+
|
|
222
|
+
```
|
|
223
|
+
Explore ──► Analyze ──► Visualize ──► Share ──► Publish ──► Archive ──► Reuse
|
|
224
|
+
▲ │
|
|
225
|
+
└───────────────────────────────────────────────────────────────────────┘
|
|
226
|
+
```
|
|
227
|
+
|
|
228
|
+
- **Explore** — interact with a measurement, simulation, image, or spectrum
|
|
229
|
+
while building an experiment or analysis (pan/zoom, point-picking).
|
|
230
|
+
- **Analyze** — the same figure workflow for signal processing, statistics,
|
|
231
|
+
and multidimensional data.
|
|
232
|
+
- **Visualize** — build and style the figure: plot, arrange subplots, apply
|
|
233
|
+
colormaps and normalization.
|
|
234
|
+
- **Share** — hand an interactive HTML figure to a collaborator — no server,
|
|
235
|
+
nothing to install on their end.
|
|
236
|
+
- **Publish** — export a publication figure as SVG/PNG/PDF, or publish a
|
|
237
|
+
self-contained HTML figure that carries its own data.
|
|
238
|
+
- **Archive** — keep the figure and its plotted data together in one
|
|
239
|
+
portable file.
|
|
240
|
+
- **Reuse** — load the figure back with `plotpress.load_data()`, recover the
|
|
241
|
+
data, and analyze or replot it — the cycle starts again from Explore.
|
|
242
|
+
|
|
243
|
+
## Made for real scientific workloads
|
|
244
|
+
|
|
245
|
+
plotpress isn't just a handful of basic plotting primitives — it covers the
|
|
246
|
+
kinds of figures scientists actually build. See
|
|
247
|
+
[Supported plot types](#supported-plot-types) below for the full method
|
|
248
|
+
list; the categories:
|
|
249
|
+
|
|
250
|
+
- **Signal processing** — power spectral density, cross-spectral density,
|
|
251
|
+
coherence, spectrograms, autocorrelation, cross-correlation, and
|
|
252
|
+
magnitude/angle/phase spectra (pure-NumPy Welch estimators).
|
|
253
|
+
- **2-D and gridded data** — images, meshes (including curvilinear grids),
|
|
254
|
+
contours, vector fields, and logarithmic/power/symlog normalization for
|
|
255
|
+
large scientific fields.
|
|
256
|
+
- **Statistical visualization** — histograms, 2-D histograms, box plots,
|
|
257
|
+
violin plots, ECDFs, KDEs, event rasters, error bars, and hexbins.
|
|
258
|
+
- **Complex figures** — subplot grids, shared axes, colorbars (including one
|
|
259
|
+
shared across several axes), secondary axes, inset axes, grouped panels,
|
|
260
|
+
figure-level titles/labels, and mixed layouts.
|
|
261
|
+
- **Animation** — animated lines and meshes with frame sliders, exportable
|
|
262
|
+
as self-contained looping GIFs.
|
|
263
|
+
- **Large figures** — built to keep object and output-node counts under
|
|
264
|
+
control, so a very large multi-panel figure stays practical; see the "At
|
|
265
|
+
scale" GIF above (500 `pcolormesh` panels, 250 groups, each with its own
|
|
266
|
+
colorbar).
|
|
267
|
+
|
|
185
268
|
## What it is for
|
|
186
269
|
|
|
187
270
|
plotpress is **not a matplotlib replacement**, and it does not try to match
|
|
@@ -189,13 +272,15 @@ matplotlib's twenty years of breadth (no geographic projections or triangulated
|
|
|
189
272
|
grids, one font-metric family, no 3-D, and its polar axes project onto the 2-D
|
|
190
273
|
core rather than a dedicated pipeline — see [Supported plot types](#supported-plot-types)
|
|
191
274
|
below). It aims at a narrower, underserved spot: plotting where matplotlib's
|
|
192
|
-
install footprint or global state gets in the way
|
|
275
|
+
install footprint or global state gets in the way — scientific software
|
|
276
|
+
doesn't always run on a developer laptop.
|
|
193
277
|
|
|
194
278
|
**Reach for plotpress when you want to:**
|
|
195
279
|
|
|
196
|
-
- **Ship plots from a constrained runtime** — locked-down
|
|
197
|
-
containers, Pyodide/WASM,
|
|
198
|
-
|
|
280
|
+
- **Ship plots from a constrained runtime** — locked-down networks, offline
|
|
281
|
+
systems, minimal containers, Pyodide/WASM, CI, or shared computing
|
|
282
|
+
environments — where a pure-Python + NumPy install with no build toolchain
|
|
283
|
+
and no per-platform wheels matters.
|
|
199
284
|
- **Embed in web apps or notebooks** as SVG or self-contained interactive HTML
|
|
200
285
|
whose JS makes no external requests (works under strict CSPs like Jupyter).
|
|
201
286
|
- **Write library or server code** that should never touch a global "current
|
|
@@ -213,23 +298,6 @@ with one figure per method, and
|
|
|
213
298
|
grouped by field, each explaining the axis, scale and colour choices the data
|
|
214
299
|
forces. Every application figure is embedded live, with the interactive toolbar.
|
|
215
300
|
|
|
216
|
-
## What makes it different
|
|
217
|
-
|
|
218
|
-
1. **No `pyplot`, no globals.** There is no "current figure/axes" and no global
|
|
219
|
-
`rcParams`. A `Figure` owns its axes and its own `Style`; two figures never
|
|
220
|
-
share mutable state. `plotpress.subplots()` returns `(fig, axes)` just like
|
|
221
|
-
`plt.subplots()` — but touches no global state.
|
|
222
|
-
2. **matplotlib-*shaped* API** so moving code either direction is mostly
|
|
223
|
-
mechanical: `Figure`/`Axes`, `plot`, `scatter`, `pcolormesh`,
|
|
224
|
-
`set_xlabel/ylabel/title`, `set_xlim/ylim`, `grid`, `legend`, `colorbar`. It
|
|
225
|
-
is shaped, not drop-in — there's no `pyplot` state machine and not every
|
|
226
|
-
matplotlib keyword is present; treat the gallery as the compatibility surface.
|
|
227
|
-
3. **SVG-first + built for speed.** Output is vector SVG; only mesh/image layers
|
|
228
|
-
are rasterized (as a single embedded `<image>`, not thousands of rects). Each
|
|
229
|
-
series is one `<path>`. It's **pure Python + NumPy** — vectorized coordinate
|
|
230
|
-
formatting, min/max-decimated huge lines — with **no compiled extension**, so
|
|
231
|
-
it installs everywhere pip does.
|
|
232
|
-
|
|
233
301
|
## Install
|
|
234
302
|
|
|
235
303
|
```bash
|
|
@@ -298,11 +366,12 @@ grouped into Axes, Point Picking, Annotate, and File menus:
|
|
|
298
366
|
- **Save**/**Save As** — persist pan/zoom, every pin/annotation, and every
|
|
299
367
|
toggle above to a new (or the same) self-contained HTML file.
|
|
300
368
|
|
|
301
|
-
`fig.to_html()`/`fig.save(..., interactive=True)` accept `
|
|
302
|
-
|
|
303
|
-
|
|
304
|
-
|
|
305
|
-
|
|
369
|
+
`fig.to_html()`/`fig.save(..., interactive=True)` also accept `extra_js` — a
|
|
370
|
+
raw JS string inlined as its own `<script>`, for adding a custom tool to the
|
|
371
|
+
same toolbar menu — plus `pick_precision` (decimal places embedded per
|
|
372
|
+
value) and `pick_max_mesh_cells`/`pick_max_points` (a hard cap on how much of
|
|
373
|
+
each mesh/series is embedded for picking, per artist) to bound the
|
|
374
|
+
interactive payload for mesh- or point-heavy figures.
|
|
306
375
|
|
|
307
376
|
Per axes: `ax.set_pickable(False)` excludes that axes from Point Picking
|
|
308
377
|
(Axis Span/Zoom/Annotation still work everywhere), and
|
|
@@ -1,10 +1,14 @@
|
|
|
1
1
|
# plotpress
|
|
2
2
|
|
|
3
|
-
|
|
4
|
-
|
|
5
|
-
|
|
6
|
-
|
|
7
|
-
|
|
3
|
+
**Scientific plots you can explore, share, and reuse.**
|
|
4
|
+
|
|
5
|
+
A **fast, dependency-light** plotting library for scientific computing, with
|
|
6
|
+
a **matplotlib-shaped** API and **no compiled extension** — install it
|
|
7
|
+
anywhere Python does, from notebooks to CI pipelines to offline environments.
|
|
8
|
+
It renders one figure to **SVG, PNG, PDF, Vega/Vega-Lite, and self-contained
|
|
9
|
+
interactive HTML** — the HTML carrying a full pan/zoom, point-picking, and
|
|
10
|
+
annotation toolbar. **No global state**, either — a `Figure` owns its own
|
|
11
|
+
axes and its own `Style`.
|
|
8
12
|
|
|
9
13
|
```python
|
|
10
14
|
import plotpress
|
|
@@ -28,9 +32,9 @@ genuinely shareable: the plotted data and the toolbar's own JS are both
|
|
|
28
32
|
inlined into that one file, so anyone can open and interact with it with
|
|
29
33
|
nothing installed on their end — no Python, no plotpress, no internet
|
|
30
34
|
connection, just a browser. Email it, drop it in a chat, put it on a USB
|
|
31
|
-
stick — it still works.
|
|
32
|
-
|
|
33
|
-
to the
|
|
35
|
+
stick — it still works. Send someone a file, not a service they have to
|
|
36
|
+
install. PyPI/GitHub READMEs can't run the page's own script, so the four
|
|
37
|
+
GIFs below stand in for it; open one yourself (or click through to the
|
|
34
38
|
[real-applications gallery](https://jrvannucci.github.io/plotpress/auto_applications/index.html),
|
|
35
39
|
embedded exactly this way) and it's fully live.
|
|
36
40
|
|
|
@@ -48,7 +52,16 @@ point it's pinned to:
|
|
|
48
52
|
|
|
49
53
|

|
|
50
54
|
|
|
51
|
-
|
|
55
|
+
**At scale**, every gesture above still works the same way on a figure with
|
|
56
|
+
hundreds of axes — zoom from the full grid into a handful of panels, pan,
|
|
57
|
+
pick a value, remove it, pick again and drag its label, pan to a distant
|
|
58
|
+
group, annotate, then back Home (the figure is
|
|
59
|
+
[`docs/examples/grouping/plot_13_full_scale_demo.py`](https://jrvannucci.github.io/plotpress/auto_examples/grouping/plot_13_full_scale_demo.html) —
|
|
60
|
+
500 `pcolormesh` panels, 250 groups, each with its own colorbar):
|
|
61
|
+
|
|
62
|
+

|
|
63
|
+
|
|
64
|
+
## One figure. Many destinations.
|
|
52
65
|
|
|
53
66
|
The same `Figure` built once from the matplotlib-shaped API renders to every
|
|
54
67
|
format below — no separate figure per output, no plugin to install:
|
|
@@ -67,19 +80,22 @@ the core Pillow) svglib + inlined -- real pixel- str
|
|
|
67
80
|
|
|
68
81
|
`fig.save(path, ...)` dispatches on the file extension for the first four;
|
|
69
82
|
`fig.to_vega()` / `fig.to_vega_lite()` return a JSON specification as a plain
|
|
70
|
-
`dict` for a separate Vega/Vega-Lite runtime to render
|
|
71
|
-
|
|
72
|
-
dashboard or notebook
|
|
83
|
+
`dict` for a separate Vega/Vega-Lite runtime to render — a bridge from
|
|
84
|
+
scientific Python to web-native visualization, for handing a figure to an
|
|
85
|
+
existing Vega-based dashboard or notebook without rebuilding the plot from
|
|
86
|
+
scratch. See the
|
|
73
87
|
[architecture docs](https://jrvannucci.github.io/plotpress/user_guide/architecture.html)
|
|
74
88
|
for exactly how much of the rendering pipeline each of these six actually
|
|
75
89
|
shares, and where a format gets its own dedicated path instead.
|
|
76
90
|
|
|
77
91
|
## Reading a figure back out of HTML
|
|
78
92
|
|
|
79
|
-
The interactive HTML above isn't a
|
|
80
|
-
and the figure's own layout as JSON
|
|
81
|
-
|
|
82
|
-
figure back out and rebuild it
|
|
93
|
+
A plot doesn't have to be a dead image. The interactive HTML above isn't a
|
|
94
|
+
one-way trip: it embeds the plotted data and the figure's own layout as JSON
|
|
95
|
+
alongside the SVG, so a later process — with none of the Python objects that
|
|
96
|
+
built it still around — can read a figure back out and rebuild it. The
|
|
97
|
+
figure becomes a portable representation of the data it displays, not just a
|
|
98
|
+
picture of it:
|
|
83
99
|
|
|
84
100
|
```
|
|
85
101
|
a saved .html (Figure.save(path, interactive=True))
|
|
@@ -124,6 +140,73 @@ layout still available under `ds.attrs["layout"]` for
|
|
|
124
140
|
[data round-trip example](https://jrvannucci.github.io/plotpress/auto_examples/data_roundtrip/index.html)
|
|
125
141
|
for both paths worked through end to end.
|
|
126
142
|
|
|
143
|
+
## What makes it different
|
|
144
|
+
|
|
145
|
+
1. **No `pyplot`, no globals.** There is no "current figure/axes" and no global
|
|
146
|
+
`rcParams`. A `Figure` owns its axes and its own `Style`; two figures never
|
|
147
|
+
share mutable state. `plotpress.subplots()` returns `(fig, axes)` just like
|
|
148
|
+
`plt.subplots()` — but touches no global state.
|
|
149
|
+
2. **matplotlib-*shaped* API** so moving code either direction is mostly
|
|
150
|
+
mechanical: `Figure`/`Axes`, `plot`, `scatter`, `pcolormesh`,
|
|
151
|
+
`set_xlabel/ylabel/title`, `set_xlim/ylim`, `grid`, `legend`, `colorbar`. It
|
|
152
|
+
is shaped, not drop-in — there's no `pyplot` state machine and not every
|
|
153
|
+
matplotlib keyword is present; treat the gallery as the compatibility surface.
|
|
154
|
+
3. **SVG-first + built for speed.** Output is vector SVG; only mesh/image layers
|
|
155
|
+
are rasterized (as a single embedded `<image>`, not thousands of rects). Each
|
|
156
|
+
series is one `<path>`. It's **pure Python + NumPy** — vectorized coordinate
|
|
157
|
+
formatting, min/max-decimated huge lines — with **no compiled extension**, so
|
|
158
|
+
it installs everywhere pip does.
|
|
159
|
+
|
|
160
|
+
## Scientific visualization, end to end
|
|
161
|
+
|
|
162
|
+
plotpress is designed around the way scientific figures actually get used:
|
|
163
|
+
|
|
164
|
+
```
|
|
165
|
+
Explore ──► Analyze ──► Visualize ──► Share ──► Publish ──► Archive ──► Reuse
|
|
166
|
+
▲ │
|
|
167
|
+
└───────────────────────────────────────────────────────────────────────┘
|
|
168
|
+
```
|
|
169
|
+
|
|
170
|
+
- **Explore** — interact with a measurement, simulation, image, or spectrum
|
|
171
|
+
while building an experiment or analysis (pan/zoom, point-picking).
|
|
172
|
+
- **Analyze** — the same figure workflow for signal processing, statistics,
|
|
173
|
+
and multidimensional data.
|
|
174
|
+
- **Visualize** — build and style the figure: plot, arrange subplots, apply
|
|
175
|
+
colormaps and normalization.
|
|
176
|
+
- **Share** — hand an interactive HTML figure to a collaborator — no server,
|
|
177
|
+
nothing to install on their end.
|
|
178
|
+
- **Publish** — export a publication figure as SVG/PNG/PDF, or publish a
|
|
179
|
+
self-contained HTML figure that carries its own data.
|
|
180
|
+
- **Archive** — keep the figure and its plotted data together in one
|
|
181
|
+
portable file.
|
|
182
|
+
- **Reuse** — load the figure back with `plotpress.load_data()`, recover the
|
|
183
|
+
data, and analyze or replot it — the cycle starts again from Explore.
|
|
184
|
+
|
|
185
|
+
## Made for real scientific workloads
|
|
186
|
+
|
|
187
|
+
plotpress isn't just a handful of basic plotting primitives — it covers the
|
|
188
|
+
kinds of figures scientists actually build. See
|
|
189
|
+
[Supported plot types](#supported-plot-types) below for the full method
|
|
190
|
+
list; the categories:
|
|
191
|
+
|
|
192
|
+
- **Signal processing** — power spectral density, cross-spectral density,
|
|
193
|
+
coherence, spectrograms, autocorrelation, cross-correlation, and
|
|
194
|
+
magnitude/angle/phase spectra (pure-NumPy Welch estimators).
|
|
195
|
+
- **2-D and gridded data** — images, meshes (including curvilinear grids),
|
|
196
|
+
contours, vector fields, and logarithmic/power/symlog normalization for
|
|
197
|
+
large scientific fields.
|
|
198
|
+
- **Statistical visualization** — histograms, 2-D histograms, box plots,
|
|
199
|
+
violin plots, ECDFs, KDEs, event rasters, error bars, and hexbins.
|
|
200
|
+
- **Complex figures** — subplot grids, shared axes, colorbars (including one
|
|
201
|
+
shared across several axes), secondary axes, inset axes, grouped panels,
|
|
202
|
+
figure-level titles/labels, and mixed layouts.
|
|
203
|
+
- **Animation** — animated lines and meshes with frame sliders, exportable
|
|
204
|
+
as self-contained looping GIFs.
|
|
205
|
+
- **Large figures** — built to keep object and output-node counts under
|
|
206
|
+
control, so a very large multi-panel figure stays practical; see the "At
|
|
207
|
+
scale" GIF above (500 `pcolormesh` panels, 250 groups, each with its own
|
|
208
|
+
colorbar).
|
|
209
|
+
|
|
127
210
|
## What it is for
|
|
128
211
|
|
|
129
212
|
plotpress is **not a matplotlib replacement**, and it does not try to match
|
|
@@ -131,13 +214,15 @@ matplotlib's twenty years of breadth (no geographic projections or triangulated
|
|
|
131
214
|
grids, one font-metric family, no 3-D, and its polar axes project onto the 2-D
|
|
132
215
|
core rather than a dedicated pipeline — see [Supported plot types](#supported-plot-types)
|
|
133
216
|
below). It aims at a narrower, underserved spot: plotting where matplotlib's
|
|
134
|
-
install footprint or global state gets in the way
|
|
217
|
+
install footprint or global state gets in the way — scientific software
|
|
218
|
+
doesn't always run on a developer laptop.
|
|
135
219
|
|
|
136
220
|
**Reach for plotpress when you want to:**
|
|
137
221
|
|
|
138
|
-
- **Ship plots from a constrained runtime** — locked-down
|
|
139
|
-
containers, Pyodide/WASM,
|
|
140
|
-
|
|
222
|
+
- **Ship plots from a constrained runtime** — locked-down networks, offline
|
|
223
|
+
systems, minimal containers, Pyodide/WASM, CI, or shared computing
|
|
224
|
+
environments — where a pure-Python + NumPy install with no build toolchain
|
|
225
|
+
and no per-platform wheels matters.
|
|
141
226
|
- **Embed in web apps or notebooks** as SVG or self-contained interactive HTML
|
|
142
227
|
whose JS makes no external requests (works under strict CSPs like Jupyter).
|
|
143
228
|
- **Write library or server code** that should never touch a global "current
|
|
@@ -155,23 +240,6 @@ with one figure per method, and
|
|
|
155
240
|
grouped by field, each explaining the axis, scale and colour choices the data
|
|
156
241
|
forces. Every application figure is embedded live, with the interactive toolbar.
|
|
157
242
|
|
|
158
|
-
## What makes it different
|
|
159
|
-
|
|
160
|
-
1. **No `pyplot`, no globals.** There is no "current figure/axes" and no global
|
|
161
|
-
`rcParams`. A `Figure` owns its axes and its own `Style`; two figures never
|
|
162
|
-
share mutable state. `plotpress.subplots()` returns `(fig, axes)` just like
|
|
163
|
-
`plt.subplots()` — but touches no global state.
|
|
164
|
-
2. **matplotlib-*shaped* API** so moving code either direction is mostly
|
|
165
|
-
mechanical: `Figure`/`Axes`, `plot`, `scatter`, `pcolormesh`,
|
|
166
|
-
`set_xlabel/ylabel/title`, `set_xlim/ylim`, `grid`, `legend`, `colorbar`. It
|
|
167
|
-
is shaped, not drop-in — there's no `pyplot` state machine and not every
|
|
168
|
-
matplotlib keyword is present; treat the gallery as the compatibility surface.
|
|
169
|
-
3. **SVG-first + built for speed.** Output is vector SVG; only mesh/image layers
|
|
170
|
-
are rasterized (as a single embedded `<image>`, not thousands of rects). Each
|
|
171
|
-
series is one `<path>`. It's **pure Python + NumPy** — vectorized coordinate
|
|
172
|
-
formatting, min/max-decimated huge lines — with **no compiled extension**, so
|
|
173
|
-
it installs everywhere pip does.
|
|
174
|
-
|
|
175
243
|
## Install
|
|
176
244
|
|
|
177
245
|
```bash
|
|
@@ -240,11 +308,12 @@ grouped into Axes, Point Picking, Annotate, and File menus:
|
|
|
240
308
|
- **Save**/**Save As** — persist pan/zoom, every pin/annotation, and every
|
|
241
309
|
toggle above to a new (or the same) self-contained HTML file.
|
|
242
310
|
|
|
243
|
-
`fig.to_html()`/`fig.save(..., interactive=True)` accept `
|
|
244
|
-
|
|
245
|
-
|
|
246
|
-
|
|
247
|
-
|
|
311
|
+
`fig.to_html()`/`fig.save(..., interactive=True)` also accept `extra_js` — a
|
|
312
|
+
raw JS string inlined as its own `<script>`, for adding a custom tool to the
|
|
313
|
+
same toolbar menu — plus `pick_precision` (decimal places embedded per
|
|
314
|
+
value) and `pick_max_mesh_cells`/`pick_max_points` (a hard cap on how much of
|
|
315
|
+
each mesh/series is embedded for picking, per artist) to bound the
|
|
316
|
+
interactive payload for mesh- or point-heavy figures.
|
|
248
317
|
|
|
249
318
|
Per axes: `ax.set_pickable(False)` excludes that axes from Point Picking
|
|
250
319
|
(Axis Span/Zoom/Annotation still work everywhere), and
|
|
@@ -0,0 +1 @@
|
|
|
1
|
+
__version__ = "0.25.0"
|
|
@@ -728,14 +728,23 @@ class Figure:
|
|
|
728
728
|
# rows in a column-band (say) still needs a top-margin band for
|
|
729
729
|
# its top-facing title even though most of its own axes are in
|
|
730
730
|
# rows 1+, same as one spanning a single row would.
|
|
731
|
+
# max(), not +=: every group touching a given outer edge shares
|
|
732
|
+
# that same margin band (they're side by side along it, not
|
|
733
|
+
# stacked), so the band only has to be tall/wide enough for the
|
|
734
|
+
# single largest title reaching it -- not the sum of every
|
|
735
|
+
# group's own extent. A grid with many groups along one edge
|
|
736
|
+
# (e.g. one group per column, all title_position="top") used to
|
|
737
|
+
# accumulate every one of their extents into one ever-growing
|
|
738
|
+
# top margin, producing a band of blank space scaling with the
|
|
739
|
+
# number of columns instead of a fixed, correctly-sized one.
|
|
731
740
|
if pos == "top" and r0 == 0:
|
|
732
|
-
group_top_px
|
|
741
|
+
group_top_px = max(group_top_px, extent)
|
|
733
742
|
elif pos == "bottom" and r1 == nrows - 1:
|
|
734
|
-
group_bottom_px
|
|
743
|
+
group_bottom_px = max(group_bottom_px, extent)
|
|
735
744
|
elif pos == "left" and c0 == 0:
|
|
736
|
-
group_left_px
|
|
745
|
+
group_left_px = max(group_left_px, extent)
|
|
737
746
|
elif pos == "right" and c1 == ncols - 1:
|
|
738
|
-
group_right_px
|
|
747
|
+
group_right_px = max(group_right_px, extent)
|
|
739
748
|
if r0 > 0:
|
|
740
749
|
row_needs_hspace[r0 - 1] = True
|
|
741
750
|
if r1 < nrows - 1:
|
|
@@ -1302,7 +1311,21 @@ class Figure:
|
|
|
1302
1311
|
# falls back to its fixed width/height
|
|
1303
1312
|
# attributes instead, undoing the scaling
|
|
1304
1313
|
svg_style = (
|
|
1305
|
-
|
|
1314
|
+
# flex-shrink:0 -- the SVG is a direct flex child of body (below)
|
|
1315
|
+
# with no wrapper div (that only exists for a plot_frames()/
|
|
1316
|
+
# pcolormesh_frames() figure's docked sliders, see above). Without
|
|
1317
|
+
# it, a figure wider than the viewport -- unremarkable at ordinary
|
|
1318
|
+
# sizes, real once the figure is genuinely large (hundreds of
|
|
1319
|
+
# axes) -- got shrunk by the flex container's default
|
|
1320
|
+
# flex-shrink:1 to fit the viewport's *width* only, since a
|
|
1321
|
+
# replaced element's flex-basis shrinks independently per axis
|
|
1322
|
+
# with no aspect-ratio preservation: the SVG's height stayed at
|
|
1323
|
+
# its full, unscaled attribute value while its width compressed,
|
|
1324
|
+
# rendering every element non-uniformly squashed rather than
|
|
1325
|
+
# simply centered with the page free to scroll to see the rest,
|
|
1326
|
+
# which is what happens with this set.
|
|
1327
|
+
"#plotpress-svg{cursor:default;box-shadow:0 1px 6px rgba(0,0,0,.2);"
|
|
1328
|
+
"flex-shrink:0}" if standalone
|
|
1306
1329
|
else "#plotpress-svg{cursor:default;display:block;width:100%;height:auto}"
|
|
1307
1330
|
)
|
|
1308
1331
|
# A plot_frames()/pcolormesh_frames() figure wraps the SVG in a div
|
|
@@ -67,7 +67,7 @@ from .artists import (
|
|
|
67
67
|
Bars, ErrorBar, Line2D, Pie, QuadMesh, ScatterCollection, Stem, Text,
|
|
68
68
|
Annotation, _VECTOR_CELL_LIMIT,
|
|
69
69
|
)
|
|
70
|
-
from .colors import Normalize, to_hex
|
|
70
|
+
from .colors import Normalize, colorbar_ticks, to_hex
|
|
71
71
|
from .png import png_data_uri
|
|
72
72
|
from .primitives import artist_to_prims
|
|
73
73
|
from .primitives import pie_center_radius, pie_label_positions
|
|
@@ -119,7 +119,10 @@ def figure_to_vega(fig, mesh_data: bool = False) -> dict:
|
|
|
119
119
|
groups = []
|
|
120
120
|
legend_axes = []
|
|
121
121
|
for i, ax in enumerate(fig.axes):
|
|
122
|
-
if
|
|
122
|
+
if not ax._visible:
|
|
123
|
+
continue
|
|
124
|
+
if ax._is_colorbar:
|
|
125
|
+
groups.append(_colorbar_to_group(ax, i, W, H, fig.style))
|
|
123
126
|
continue
|
|
124
127
|
groups.append(_axes_to_group(ax, i, W, H, size_scale, fig.style, mesh_data))
|
|
125
128
|
if ax._show_legend:
|
|
@@ -208,6 +211,69 @@ def _axis_def(orient, scale_name, label, grid, custom_ticks, custom_labels, scal
|
|
|
208
211
|
return axis
|
|
209
212
|
|
|
210
213
|
|
|
214
|
+
def _colorbar_to_group(ax, i, W, H, st):
|
|
215
|
+
"""A colorbar axes as its own Vega group: a gradient ``image`` mark (the
|
|
216
|
+
same 256x1-LUT-as-a-stretched-image technique svg.py's own
|
|
217
|
+
``_render_colorbar`` uses) plus tick ``rule``/``text`` marks along its
|
|
218
|
+
right edge.
|
|
219
|
+
|
|
220
|
+
Not routed through ``_axes_to_group``/``artist_to_prims`` -- a colorbar
|
|
221
|
+
has no data-space x/y scale to encode marks against (its own
|
|
222
|
+
``_resolved_limits()`` is meaningless placeholder 0..1), just a fixed
|
|
223
|
+
pixel rect and a ``Normalize`` to read tick positions from -- closer to
|
|
224
|
+
a `Text`/`Image` figure decoration than a real axes.
|
|
225
|
+
"""
|
|
226
|
+
alloc = _pixel_rect(ax, W, H)
|
|
227
|
+
xlim, ylim = ax._resolved_limits()
|
|
228
|
+
px_left, px_top, px_w, px_h = _effective_rect(ax, *alloc, xlim, ylim)
|
|
229
|
+
src = ax._cbar_source
|
|
230
|
+
lut = src.lut
|
|
231
|
+
grad = np.flipud(lut).reshape(-1, 1, 3) # top = vmax, matches svg.py
|
|
232
|
+
alpha = np.full((grad.shape[0], 1, 1), 255, np.uint8)
|
|
233
|
+
rgba = np.concatenate([grad, alpha], axis=2)
|
|
234
|
+
marks = [{
|
|
235
|
+
"type": "image",
|
|
236
|
+
"encode": {"enter": {
|
|
237
|
+
"x": {"value": round(float(px_left), 2)},
|
|
238
|
+
"y": {"value": round(float(px_top), 2)},
|
|
239
|
+
"width": {"value": round(float(px_w), 2)},
|
|
240
|
+
"height": {"value": round(float(px_h), 2)},
|
|
241
|
+
"url": {"value": png_data_uri(rgba)},
|
|
242
|
+
"smooth": {"value": False}, "aspect": {"value": False},
|
|
243
|
+
}},
|
|
244
|
+
}]
|
|
245
|
+
_, fracs, tlabels = colorbar_ticks(src.norm)
|
|
246
|
+
for frac, lab in zip(fracs, tlabels):
|
|
247
|
+
y = px_top + (1 - frac) * px_h
|
|
248
|
+
marks.append({
|
|
249
|
+
"type": "rule",
|
|
250
|
+
"encode": {"enter": {
|
|
251
|
+
"x": {"value": round(float(px_left + px_w), 2)}, "y": {"value": round(float(y), 2)},
|
|
252
|
+
"x2": {"value": round(float(px_left + px_w + st.tick_size), 2)}, "y2": {"value": round(float(y), 2)},
|
|
253
|
+
"stroke": {"value": _color(st.spine_color)},
|
|
254
|
+
"strokeWidth": {"value": float(st.tick_width)},
|
|
255
|
+
}},
|
|
256
|
+
})
|
|
257
|
+
marks.append({
|
|
258
|
+
"type": "text",
|
|
259
|
+
"encode": {"enter": {
|
|
260
|
+
"x": {"value": round(float(px_left + px_w + st.tick_size + 2), 2)},
|
|
261
|
+
"y": {"value": round(float(y + st.tick_label_size * 0.35), 2)},
|
|
262
|
+
"text": {"value": str(lab)},
|
|
263
|
+
"fontSize": {"value": float(st.tick_label_size)},
|
|
264
|
+
"fill": {"value": _color(st.text_color)},
|
|
265
|
+
}},
|
|
266
|
+
})
|
|
267
|
+
return {
|
|
268
|
+
"type": "group", "name": f"axes{i}",
|
|
269
|
+
"encode": {"enter": {
|
|
270
|
+
"x": {"value": 0}, "y": {"value": 0},
|
|
271
|
+
"width": {"value": round(float(W), 2)}, "height": {"value": round(float(H), 2)},
|
|
272
|
+
}},
|
|
273
|
+
"marks": marks,
|
|
274
|
+
}
|
|
275
|
+
|
|
276
|
+
|
|
211
277
|
def _axes_to_group(ax, i, W, H, size_scale, st, mesh_data=False):
|
|
212
278
|
alloc = _pixel_rect(ax, W, H)
|
|
213
279
|
(xmin, xmax), (ymin, ymax) = ax._resolved_limits()
|