plotpress 0.23.2__tar.gz → 0.24.0__tar.gz
This diff represents the content of publicly available package versions that have been released to one of the supported registries. The information contained in this diff is provided for informational purposes only and reflects changes between package versions as they appear in their respective public registries.
- {plotpress-0.23.2/plotpress.egg-info → plotpress-0.24.0}/PKG-INFO +133 -15
- plotpress-0.23.2/PKG-INFO → plotpress-0.24.0/README.md +117 -57
- {plotpress-0.23.2 → plotpress-0.24.0}/plotpress/__init__.py +4 -2
- {plotpress-0.23.2 → plotpress-0.24.0}/plotpress/_interactive.py +22 -10
- plotpress-0.24.0/plotpress/_version.py +1 -0
- {plotpress-0.23.2 → plotpress-0.24.0}/plotpress/artists.py +24 -14
- {plotpress-0.23.2 → plotpress-0.24.0}/plotpress/axes.py +76 -50
- {plotpress-0.23.2 → plotpress-0.24.0}/plotpress/colors.py +31 -7
- {plotpress-0.23.2 → plotpress-0.24.0}/plotpress/primitives.py +74 -0
- {plotpress-0.23.2 → plotpress-0.24.0}/plotpress/qt.py +9 -0
- {plotpress-0.23.2 → plotpress-0.24.0}/plotpress/raster.py +34 -54
- {plotpress-0.23.2 → plotpress-0.24.0}/plotpress/style.py +27 -0
- {plotpress-0.23.2 → plotpress-0.24.0}/plotpress/svg.py +9 -17
- {plotpress-0.23.2 → plotpress-0.24.0}/plotpress/ticker.py +18 -2
- {plotpress-0.23.2 → plotpress-0.24.0}/plotpress/vega.py +22 -25
- {plotpress-0.23.2 → plotpress-0.24.0}/plotpress/vega_lite.py +42 -30
- plotpress-0.23.2/README.md → plotpress-0.24.0/plotpress.egg-info/PKG-INFO +175 -11
- {plotpress-0.23.2 → plotpress-0.24.0}/plotpress.egg-info/SOURCES.txt +3 -0
- {plotpress-0.23.2 → plotpress-0.24.0}/plotpress.egg-info/requires.txt +15 -0
- {plotpress-0.23.2 → plotpress-0.24.0}/pyproject.toml +26 -5
- {plotpress-0.23.2 → plotpress-0.24.0}/tests/test_axes_api_audit.py +116 -5
- plotpress-0.24.0/tests/test_colors.py +79 -0
- {plotpress-0.23.2 → plotpress-0.24.0}/tests/test_input_validation.py +61 -8
- plotpress-0.24.0/tests/test_primitives.py +177 -0
- {plotpress-0.23.2 → plotpress-0.24.0}/tests/test_qt.py +28 -0
- {plotpress-0.23.2 → plotpress-0.24.0}/tests/test_render_all.py +3 -4
- plotpress-0.24.0/tests/test_style.py +92 -0
- {plotpress-0.23.2 → plotpress-0.24.0}/tests/test_svg_output.py +31 -6
- {plotpress-0.23.2 → plotpress-0.24.0}/tests/test_vega_lite_output.py +23 -0
- {plotpress-0.23.2 → plotpress-0.24.0}/tests/test_vega_output.py +88 -0
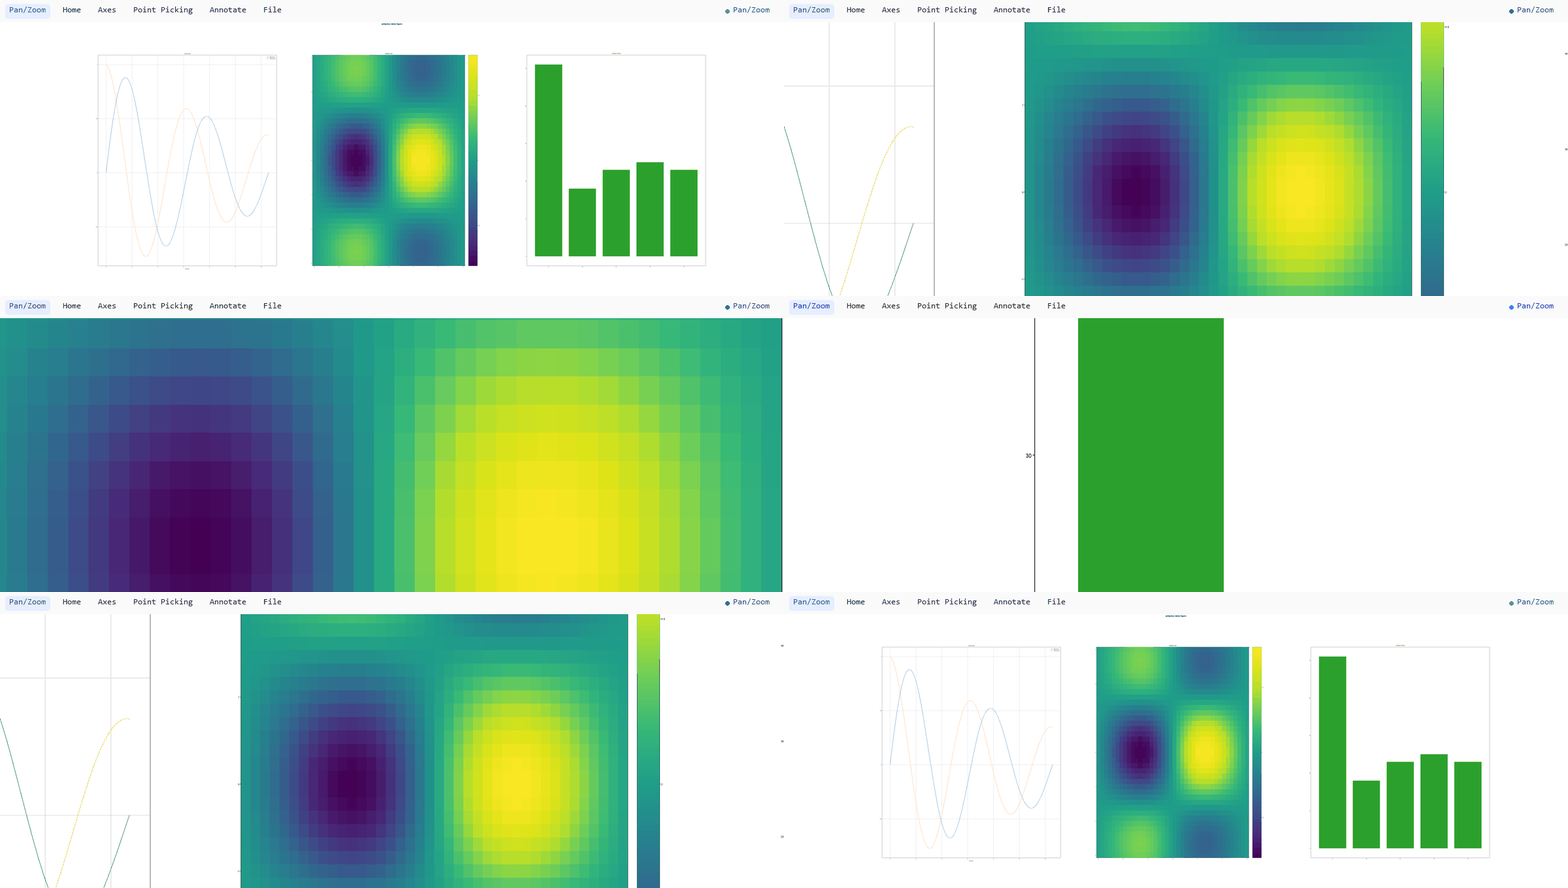
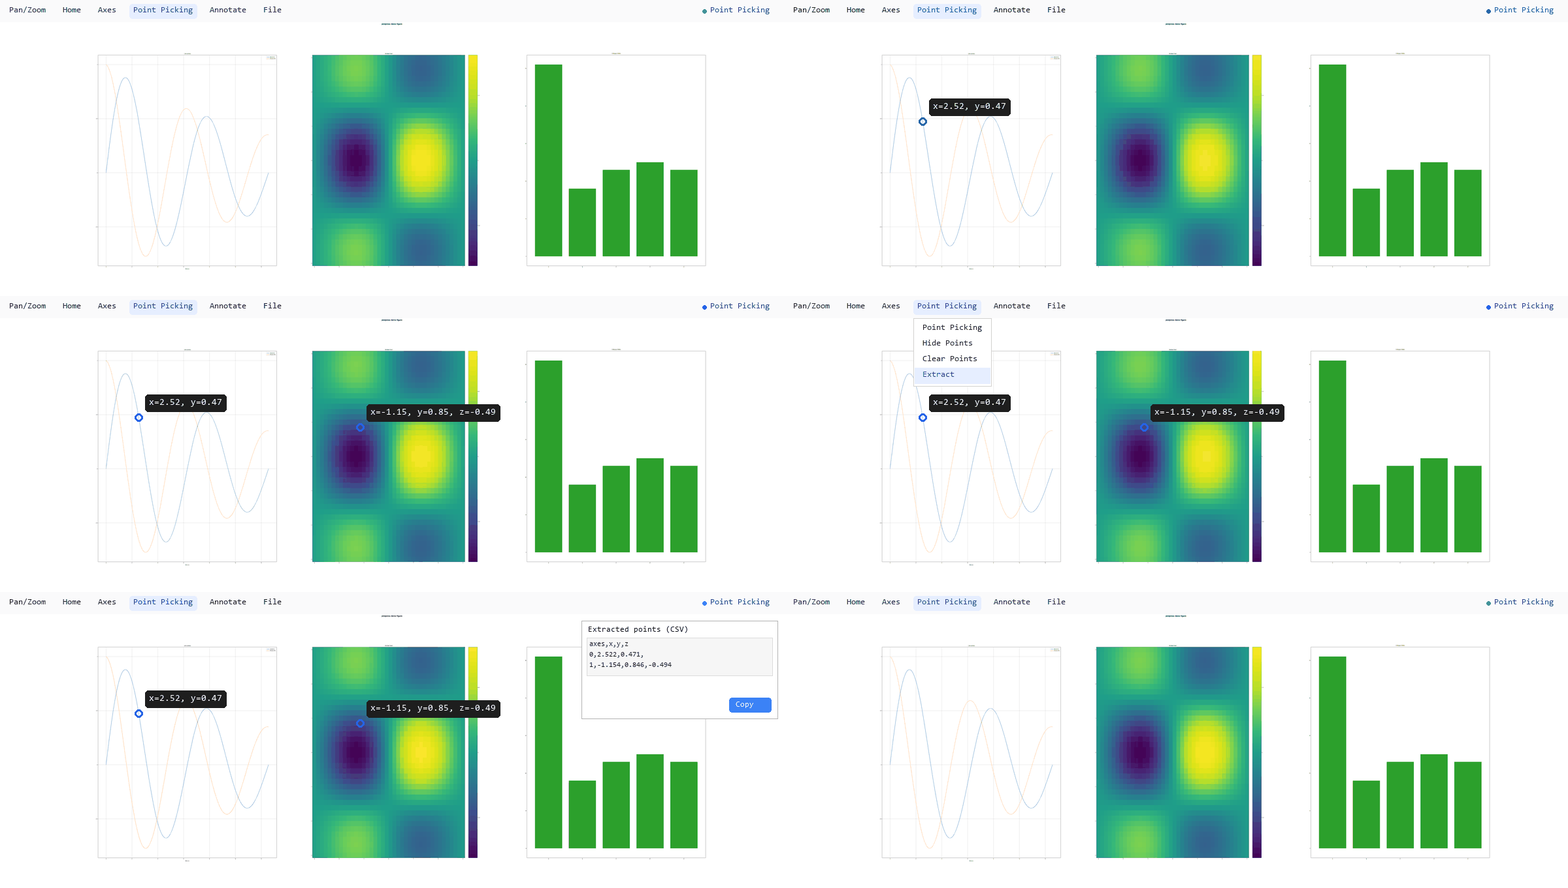
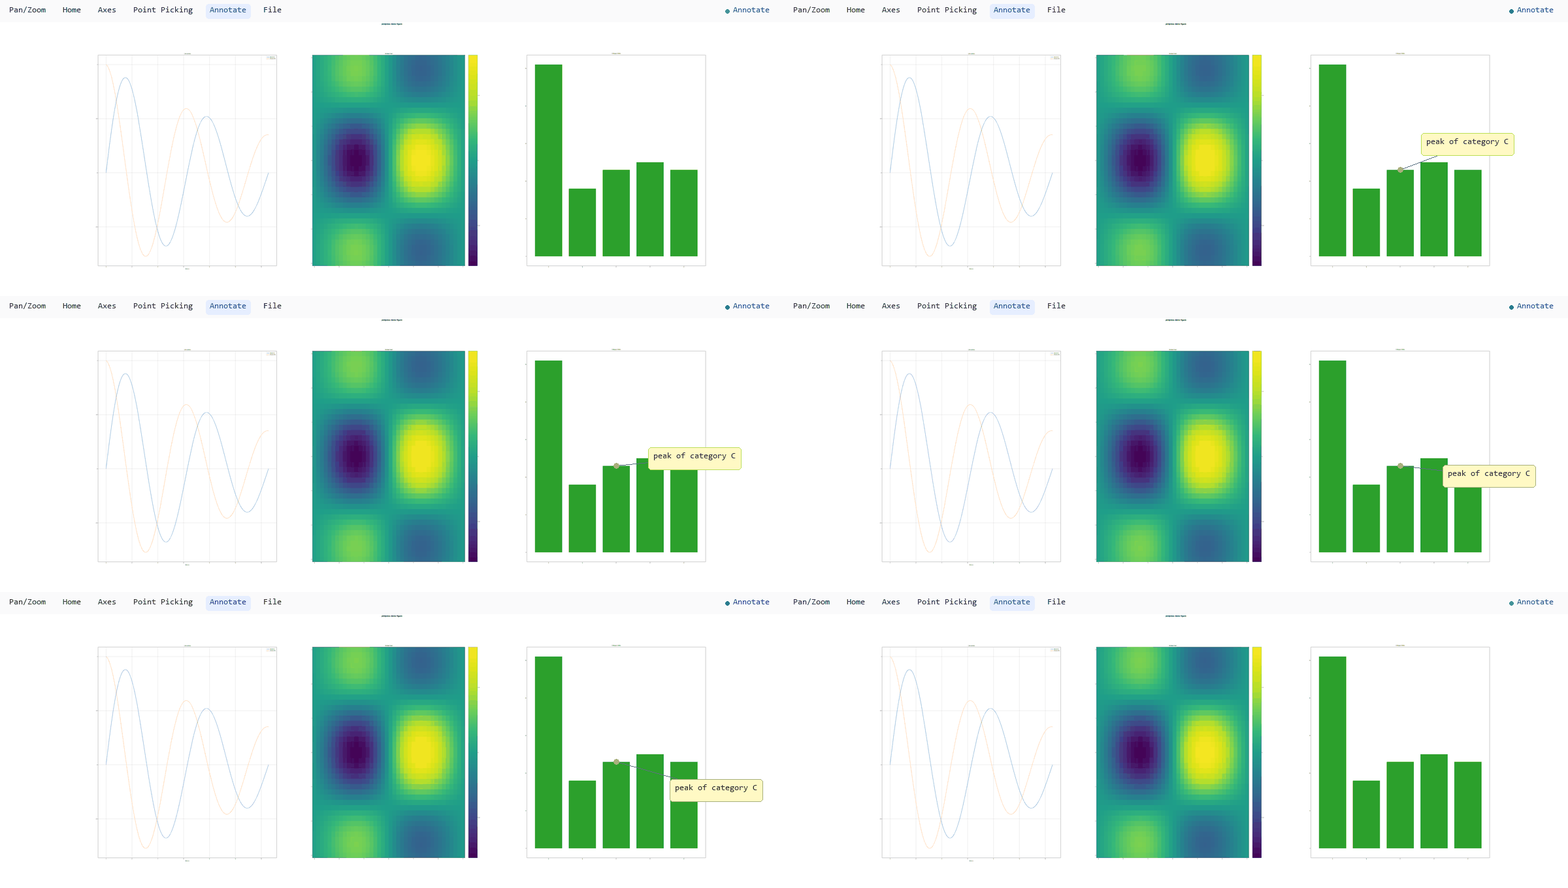
- plotpress-0.23.2/plotpress/_version.py +0 -1
- {plotpress-0.23.2 → plotpress-0.24.0}/LICENSE +0 -0
- {plotpress-0.23.2 → plotpress-0.24.0}/plotpress/_spectral.py +0 -0
- {plotpress-0.23.2 → plotpress-0.24.0}/plotpress/figure.py +0 -0
- {plotpress-0.23.2 → plotpress-0.24.0}/plotpress/fonts/__init__.py +0 -0
- {plotpress-0.23.2 → plotpress-0.24.0}/plotpress/fonts/families.py +0 -0
- {plotpress-0.23.2 → plotpress-0.24.0}/plotpress/fonts/installed.py +0 -0
- {plotpress-0.23.2 → plotpress-0.24.0}/plotpress/fonts/metrics.py +0 -0
- {plotpress-0.23.2 → plotpress-0.24.0}/plotpress/png.py +0 -0
- {plotpress-0.23.2 → plotpress-0.24.0}/plotpress/polar.py +0 -0
- {plotpress-0.23.2 → plotpress-0.24.0}/plotpress/transform.py +0 -0
- {plotpress-0.23.2 → plotpress-0.24.0}/plotpress.egg-info/dependency_links.txt +0 -0
- {plotpress-0.23.2 → plotpress-0.24.0}/plotpress.egg-info/top_level.txt +0 -0
- {plotpress-0.23.2 → plotpress-0.24.0}/setup.cfg +0 -0
- {plotpress-0.23.2 → plotpress-0.24.0}/tests/test_adopt_axes.py +0 -0
- {plotpress-0.23.2 → plotpress-0.24.0}/tests/test_axes.py +0 -0
- {plotpress-0.23.2 → plotpress-0.24.0}/tests/test_distributions.py +0 -0
- {plotpress-0.23.2 → plotpress-0.24.0}/tests/test_fonts.py +0 -0
- {plotpress-0.23.2 → plotpress-0.24.0}/tests/test_load_data_xarray.py +0 -0
- {plotpress-0.23.2 → plotpress-0.24.0}/tests/test_matplotlib_gaps.py +0 -0
- {plotpress-0.23.2 → plotpress-0.24.0}/tests/test_matplotlib_parity.py +0 -0
- {plotpress-0.23.2 → plotpress-0.24.0}/tests/test_no_global_state.py +0 -0
- {plotpress-0.23.2 → plotpress-0.24.0}/tests/test_performance.py +0 -0
- {plotpress-0.23.2 → plotpress-0.24.0}/tests/test_pick_interactive.py +0 -0
- {plotpress-0.23.2 → plotpress-0.24.0}/tests/test_png.py +0 -0
- {plotpress-0.23.2 → plotpress-0.24.0}/tests/test_polar.py +0 -0
- {plotpress-0.23.2 → plotpress-0.24.0}/tests/test_python_compat.py +0 -0
- {plotpress-0.23.2 → plotpress-0.24.0}/tests/test_spectral.py +0 -0
- {plotpress-0.23.2 → plotpress-0.24.0}/tests/test_summary.py +0 -0
- {plotpress-0.23.2 → plotpress-0.24.0}/tests/test_units.py +0 -0
|
@@ -1,7 +1,7 @@
|
|
|
1
1
|
Metadata-Version: 2.4
|
|
2
2
|
Name: plotpress
|
|
3
|
-
Version: 0.
|
|
4
|
-
Summary: A fast, figure-centric
|
|
3
|
+
Version: 0.24.0
|
|
4
|
+
Summary: A fast, figure-centric plotting library with a matplotlib-like API, no global state, and one figure exportable to SVG, PNG, PDF, interactive HTML, or Vega/Vega-Lite.
|
|
5
5
|
Author: plotpress contributors
|
|
6
6
|
License: MIT
|
|
7
7
|
Project-URL: Homepage, https://github.com/jrvannucci/plotpress
|
|
@@ -20,10 +20,17 @@ Requires-Dist: pywebview>=4.0; extra == "gui"
|
|
|
20
20
|
Provides-Extra: qt
|
|
21
21
|
Requires-Dist: PyQt6>=6.4; extra == "qt"
|
|
22
22
|
Requires-Dist: PyQt6-WebEngine>=6.4; extra == "qt"
|
|
23
|
-
Provides-Extra: xarray
|
|
24
|
-
Requires-Dist: xarray>=2023.1; extra == "xarray"
|
|
25
23
|
Provides-Extra: jupyter
|
|
26
24
|
Requires-Dist: ipython>=7; extra == "jupyter"
|
|
25
|
+
Provides-Extra: viewers
|
|
26
|
+
Requires-Dist: plotpress[gui]; extra == "viewers"
|
|
27
|
+
Requires-Dist: plotpress[qt]; extra == "viewers"
|
|
28
|
+
Requires-Dist: plotpress[jupyter]; extra == "viewers"
|
|
29
|
+
Provides-Extra: xarray
|
|
30
|
+
Requires-Dist: xarray>=2023.1; extra == "xarray"
|
|
31
|
+
Provides-Extra: full
|
|
32
|
+
Requires-Dist: plotpress[viewers]; extra == "full"
|
|
33
|
+
Requires-Dist: plotpress[xarray]; extra == "full"
|
|
27
34
|
Provides-Extra: dev
|
|
28
35
|
Requires-Dist: pytest>=7; extra == "dev"
|
|
29
36
|
Provides-Extra: browser
|
|
@@ -42,14 +49,20 @@ Requires-Dist: polars>=1.0; extra == "docs"
|
|
|
42
49
|
Requires-Dist: adaptive>=1.0; extra == "docs"
|
|
43
50
|
Requires-Dist: joblib>=1.3; extra == "docs"
|
|
44
51
|
Requires-Dist: xarray>=2023.1; extra == "docs"
|
|
52
|
+
Provides-Extra: contrib
|
|
53
|
+
Requires-Dist: plotpress[dev]; extra == "contrib"
|
|
54
|
+
Requires-Dist: plotpress[browser]; extra == "contrib"
|
|
55
|
+
Requires-Dist: plotpress[bench]; extra == "contrib"
|
|
56
|
+
Requires-Dist: plotpress[docs]; extra == "contrib"
|
|
45
57
|
Dynamic: license-file
|
|
46
58
|
|
|
47
59
|
# plotpress
|
|
48
60
|
|
|
49
|
-
A **
|
|
50
|
-
self-contained interactive HTML**
|
|
51
|
-
|
|
52
|
-
|
|
61
|
+
A **fast, dependency-light** plotting library that renders one figure to
|
|
62
|
+
**SVG, PNG, PDF, Vega/Vega-Lite, and self-contained interactive HTML** — the
|
|
63
|
+
HTML carrying a full pan/zoom, point-picking, and annotation toolbar —
|
|
64
|
+
through a **matplotlib-shaped** API. **No global state**, **no compiled
|
|
65
|
+
extension**, so it installs everywhere `pip` runs.
|
|
53
66
|
|
|
54
67
|
```python
|
|
55
68
|
import plotpress
|
|
@@ -67,6 +80,108 @@ fig.save("out.html", interactive=True) # interactive toolbar: zoom / pick / a
|
|
|
67
80
|
fig.show() # native pop-up window
|
|
68
81
|
```
|
|
69
82
|
|
|
83
|
+
`out.html` above is a real, self-contained page — no server, no external JS —
|
|
84
|
+
with a toolbar over every axes in the figure at once. Self-contained means
|
|
85
|
+
genuinely shareable: the plotted data and the toolbar's own JS are both
|
|
86
|
+
inlined into that one file, so anyone can open and interact with it with
|
|
87
|
+
nothing installed on their end — no Python, no plotpress, no internet
|
|
88
|
+
connection, just a browser. Email it, drop it in a chat, put it on a USB
|
|
89
|
+
stick — it still works. PyPI/GitHub READMEs can't run the page's own script,
|
|
90
|
+
so the three GIFs below stand in for it; open one yourself (or click through
|
|
91
|
+
to the
|
|
92
|
+
[real-applications gallery](https://jrvannucci.github.io/plotpress/auto_applications/index.html),
|
|
93
|
+
embedded exactly this way) and it's fully live.
|
|
94
|
+
|
|
95
|
+
**Pan / zoom**, working the same over every axes, not just the one under the cursor:
|
|
96
|
+
|
|
97
|
+
|
|
98
|
+
|
|
99
|
+
**Point picking**, reading a value off any axes — a mesh's `z`, not just a
|
|
100
|
+
line's `x`/`y` — then extracting every picked point as CSV/JSON:
|
|
101
|
+
|
|
102
|
+
|
|
103
|
+
|
|
104
|
+
**Annotation**, a free-form note whose label box drags independently of the
|
|
105
|
+
point it's pinned to:
|
|
106
|
+
|
|
107
|
+
|
|
108
|
+
|
|
109
|
+
## One figure, several outputs
|
|
110
|
+
|
|
111
|
+
The same `Figure` built once from the matplotlib-shaped API renders to every
|
|
112
|
+
format below — no separate figure per output, no plugin to install:
|
|
113
|
+
|
|
114
|
+
```
|
|
115
|
+
one Figure object
|
|
116
|
+
|
|
|
117
|
+
+---------------+---------------+-------+-------+---------------+---------------+
|
|
118
|
+
▼ ▼ ▼ ▼ ▼ ▼
|
|
119
|
+
.svg .png .pdf .html Vega Vega-Lite
|
|
120
|
+
(vector, (raster, (vector, (SVG + JS (v5 JSON, (v5 JSON, a
|
|
121
|
+
the core Pillow) svglib + inlined -- real pixel- stricter, more
|
|
122
|
+
format) reportlab) no server space marks) declarative
|
|
123
|
+
round trip) grammar)
|
|
124
|
+
```
|
|
125
|
+
|
|
126
|
+
`fig.save(path, ...)` dispatches on the file extension for the first four;
|
|
127
|
+
`fig.to_vega()` / `fig.to_vega_lite()` return a JSON specification as a plain
|
|
128
|
+
`dict` for a separate Vega/Vega-Lite runtime to render, rather than a
|
|
129
|
+
rendered artifact — useful for handing a figure to an existing Vega-based
|
|
130
|
+
dashboard or notebook instead of embedding plotpress's own SVG/JS. See the
|
|
131
|
+
[architecture docs](https://jrvannucci.github.io/plotpress/user_guide/architecture.html)
|
|
132
|
+
for exactly how much of the rendering pipeline each of these six actually
|
|
133
|
+
shares, and where a format gets its own dedicated path instead.
|
|
134
|
+
|
|
135
|
+
## Reading a figure back out of HTML
|
|
136
|
+
|
|
137
|
+
The interactive HTML above isn't a one-way trip: it embeds the plotted data
|
|
138
|
+
and the figure's own layout as JSON alongside the SVG, so a later process —
|
|
139
|
+
with none of the Python objects that built it still around — can read a
|
|
140
|
+
figure back out and rebuild it:
|
|
141
|
+
|
|
142
|
+
```
|
|
143
|
+
a saved .html (Figure.save(path, interactive=True))
|
|
144
|
+
embeds <script id="plotpress-pick"> and
|
|
145
|
+
id="plotpress-layout"> per figure
|
|
146
|
+
|
|
|
147
|
+
▼
|
|
148
|
+
plotpress.load_data(path)
|
|
149
|
+
parses that embedded JSON back out
|
|
150
|
+
|
|
|
151
|
+
+--------------+--------------+
|
|
152
|
+
▼ ▼
|
|
153
|
+
"layout" "axes"
|
|
154
|
+
(grid shape, each (recovered series/
|
|
155
|
+
axes' own decorations, mesh/pie data per axes,
|
|
156
|
+
groups, sup-title) keyed by title)
|
|
157
|
+
|
|
158
|
+
|
|
|
159
|
+
▼
|
|
160
|
+
plotpress.subplots_from_layout(layout)
|
|
161
|
+
rebuilds the grid and every axes' own
|
|
162
|
+
decorations -- not the plotted data itself
|
|
163
|
+
|
|
|
164
|
+
▼
|
|
165
|
+
a new, already-labeled Figure -- ready for
|
|
166
|
+
the caller to replot the recovered "axes"
|
|
167
|
+
data back into
|
|
168
|
+
```
|
|
169
|
+
|
|
170
|
+
A freeform `Figure.add_axes()` rect, an inset, or a colorbar axes has no grid
|
|
171
|
+
cell to rebuild from — its index is listed in `layout["omitted_axes"]`
|
|
172
|
+
instead of silently vanishing. See the
|
|
173
|
+
[full API and worked examples](https://jrvannucci.github.io/plotpress/usage.html#reading-html-data)
|
|
174
|
+
for the round trip end to end.
|
|
175
|
+
|
|
176
|
+
For the common case of a *uniform* grid — every axes its own single
|
|
177
|
+
`pcolormesh` or line series, all the same shape — `plotpress.load_data_xarray()`
|
|
178
|
+
skips the title-keyed dict above entirely and reads the same file straight
|
|
179
|
+
into one `xarray.Dataset` indexed by row/column instead, with the recovered
|
|
180
|
+
layout still available under `ds.attrs["layout"]` for
|
|
181
|
+
`plotpress.subplots_from_layout()`. See the
|
|
182
|
+
[data round-trip example](https://jrvannucci.github.io/plotpress/auto_examples/data_roundtrip/index.html)
|
|
183
|
+
for both paths worked through end to end.
|
|
184
|
+
|
|
70
185
|
## What it is for
|
|
71
186
|
|
|
72
187
|
plotpress is **not a matplotlib replacement**, and it does not try to match
|
|
@@ -119,17 +234,20 @@ forces. Every application figure is embedded live, with the interactive toolbar.
|
|
|
119
234
|
|
|
120
235
|
```bash
|
|
121
236
|
pip install plotpress # SVG + interactive HTML + PNG/PDF export
|
|
122
|
-
pip install plotpress[
|
|
123
|
-
pip install plotpress[
|
|
124
|
-
pip install plotpress[dev] # + pytest (contributors)
|
|
125
|
-
pip install plotpress[bench] # + matplotlib (benchmark comparison)
|
|
237
|
+
pip install plotpress[full] # + every real end-user feature: viewers (gui, qt, jupyter) + xarray
|
|
238
|
+
pip install plotpress[contrib] # + everything a contributor needs (dev, browser, bench, docs)
|
|
126
239
|
```
|
|
127
240
|
|
|
128
241
|
The standard install covers **all file output** -- SVG, interactive HTML, PNG and
|
|
129
242
|
vector PDF -- with pure-wheel dependencies that install everywhere (servers, CI,
|
|
130
|
-
notebooks).
|
|
131
|
-
|
|
132
|
-
|
|
243
|
+
notebooks). `[full]` is likely what you want if you're reaching for more than
|
|
244
|
+
that at all; each of its pieces (`[gui]`, `[qt]`, `[jupyter]`, `[xarray]`, or all
|
|
245
|
+
three viewers via `[viewers]`) also installs on its own, or combined in one
|
|
246
|
+
command (`pip install plotpress[gui,xarray]`), for anyone who wants less than
|
|
247
|
+
the full bundle -- `[gui]`, for instance, pulls a desktop webview stack for the
|
|
248
|
+
native `fig.show()` window that a `[qt]`-only or `[jupyter]`-only install has
|
|
249
|
+
no reason to carry. See [Installation](https://jrvannucci.github.io/plotpress/installation.html)
|
|
250
|
+
for the full extras reference.
|
|
133
251
|
|
|
134
252
|
## Output surfaces (one scene, many targets)
|
|
135
253
|
|
|
@@ -1,55 +1,10 @@
|
|
|
1
|
-
Metadata-Version: 2.4
|
|
2
|
-
Name: plotpress
|
|
3
|
-
Version: 0.23.2
|
|
4
|
-
Summary: A fast, figure-centric, SVG-first plotting library with a matplotlib-like API and no global state.
|
|
5
|
-
Author: plotpress contributors
|
|
6
|
-
License: MIT
|
|
7
|
-
Project-URL: Homepage, https://github.com/jrvannucci/plotpress
|
|
8
|
-
Project-URL: Documentation, https://jrvannucci.github.io/plotpress/
|
|
9
|
-
Project-URL: Changelog, https://github.com/jrvannucci/plotpress/blob/main/CHANGELOG.md
|
|
10
|
-
Keywords: plotting,svg,visualization,matplotlib,figure
|
|
11
|
-
Requires-Python: >=3.9
|
|
12
|
-
Description-Content-Type: text/markdown
|
|
13
|
-
License-File: LICENSE
|
|
14
|
-
Requires-Dist: numpy>=1.21
|
|
15
|
-
Requires-Dist: pillow>=9
|
|
16
|
-
Requires-Dist: svglib>=1.4
|
|
17
|
-
Requires-Dist: reportlab>=3.6
|
|
18
|
-
Provides-Extra: gui
|
|
19
|
-
Requires-Dist: pywebview>=4.0; extra == "gui"
|
|
20
|
-
Provides-Extra: qt
|
|
21
|
-
Requires-Dist: PyQt6>=6.4; extra == "qt"
|
|
22
|
-
Requires-Dist: PyQt6-WebEngine>=6.4; extra == "qt"
|
|
23
|
-
Provides-Extra: xarray
|
|
24
|
-
Requires-Dist: xarray>=2023.1; extra == "xarray"
|
|
25
|
-
Provides-Extra: jupyter
|
|
26
|
-
Requires-Dist: ipython>=7; extra == "jupyter"
|
|
27
|
-
Provides-Extra: dev
|
|
28
|
-
Requires-Dist: pytest>=7; extra == "dev"
|
|
29
|
-
Provides-Extra: browser
|
|
30
|
-
Requires-Dist: pytest>=8.2; extra == "browser"
|
|
31
|
-
Requires-Dist: playwright>=1.40; extra == "browser"
|
|
32
|
-
Provides-Extra: bench
|
|
33
|
-
Requires-Dist: matplotlib>=3.5; extra == "bench"
|
|
34
|
-
Requires-Dist: seaborn>=0.12; extra == "bench"
|
|
35
|
-
Requires-Dist: plotly>=5.0; extra == "bench"
|
|
36
|
-
Provides-Extra: docs
|
|
37
|
-
Requires-Dist: sphinx>=7; extra == "docs"
|
|
38
|
-
Requires-Dist: sphinx-gallery>=0.15; extra == "docs"
|
|
39
|
-
Requires-Dist: sphinx-rtd-theme>=2.0; extra == "docs"
|
|
40
|
-
Requires-Dist: matplotlib>=3.5; extra == "docs"
|
|
41
|
-
Requires-Dist: polars>=1.0; extra == "docs"
|
|
42
|
-
Requires-Dist: adaptive>=1.0; extra == "docs"
|
|
43
|
-
Requires-Dist: joblib>=1.3; extra == "docs"
|
|
44
|
-
Requires-Dist: xarray>=2023.1; extra == "docs"
|
|
45
|
-
Dynamic: license-file
|
|
46
|
-
|
|
47
1
|
# plotpress
|
|
48
2
|
|
|
49
|
-
A **
|
|
50
|
-
self-contained interactive HTML**
|
|
51
|
-
|
|
52
|
-
|
|
3
|
+
A **fast, dependency-light** plotting library that renders one figure to
|
|
4
|
+
**SVG, PNG, PDF, Vega/Vega-Lite, and self-contained interactive HTML** — the
|
|
5
|
+
HTML carrying a full pan/zoom, point-picking, and annotation toolbar —
|
|
6
|
+
through a **matplotlib-shaped** API. **No global state**, **no compiled
|
|
7
|
+
extension**, so it installs everywhere `pip` runs.
|
|
53
8
|
|
|
54
9
|
```python
|
|
55
10
|
import plotpress
|
|
@@ -67,6 +22,108 @@ fig.save("out.html", interactive=True) # interactive toolbar: zoom / pick / a
|
|
|
67
22
|
fig.show() # native pop-up window
|
|
68
23
|
```
|
|
69
24
|
|
|
25
|
+
`out.html` above is a real, self-contained page — no server, no external JS —
|
|
26
|
+
with a toolbar over every axes in the figure at once. Self-contained means
|
|
27
|
+
genuinely shareable: the plotted data and the toolbar's own JS are both
|
|
28
|
+
inlined into that one file, so anyone can open and interact with it with
|
|
29
|
+
nothing installed on their end — no Python, no plotpress, no internet
|
|
30
|
+
connection, just a browser. Email it, drop it in a chat, put it on a USB
|
|
31
|
+
stick — it still works. PyPI/GitHub READMEs can't run the page's own script,
|
|
32
|
+
so the three GIFs below stand in for it; open one yourself (or click through
|
|
33
|
+
to the
|
|
34
|
+
[real-applications gallery](https://jrvannucci.github.io/plotpress/auto_applications/index.html),
|
|
35
|
+
embedded exactly this way) and it's fully live.
|
|
36
|
+
|
|
37
|
+
**Pan / zoom**, working the same over every axes, not just the one under the cursor:
|
|
38
|
+
|
|
39
|
+

|
|
40
|
+
|
|
41
|
+
**Point picking**, reading a value off any axes — a mesh's `z`, not just a
|
|
42
|
+
line's `x`/`y` — then extracting every picked point as CSV/JSON:
|
|
43
|
+
|
|
44
|
+

|
|
45
|
+
|
|
46
|
+
**Annotation**, a free-form note whose label box drags independently of the
|
|
47
|
+
point it's pinned to:
|
|
48
|
+
|
|
49
|
+

|
|
50
|
+
|
|
51
|
+
## One figure, several outputs
|
|
52
|
+
|
|
53
|
+
The same `Figure` built once from the matplotlib-shaped API renders to every
|
|
54
|
+
format below — no separate figure per output, no plugin to install:
|
|
55
|
+
|
|
56
|
+
```
|
|
57
|
+
one Figure object
|
|
58
|
+
|
|
|
59
|
+
+---------------+---------------+-------+-------+---------------+---------------+
|
|
60
|
+
▼ ▼ ▼ ▼ ▼ ▼
|
|
61
|
+
.svg .png .pdf .html Vega Vega-Lite
|
|
62
|
+
(vector, (raster, (vector, (SVG + JS (v5 JSON, (v5 JSON, a
|
|
63
|
+
the core Pillow) svglib + inlined -- real pixel- stricter, more
|
|
64
|
+
format) reportlab) no server space marks) declarative
|
|
65
|
+
round trip) grammar)
|
|
66
|
+
```
|
|
67
|
+
|
|
68
|
+
`fig.save(path, ...)` dispatches on the file extension for the first four;
|
|
69
|
+
`fig.to_vega()` / `fig.to_vega_lite()` return a JSON specification as a plain
|
|
70
|
+
`dict` for a separate Vega/Vega-Lite runtime to render, rather than a
|
|
71
|
+
rendered artifact — useful for handing a figure to an existing Vega-based
|
|
72
|
+
dashboard or notebook instead of embedding plotpress's own SVG/JS. See the
|
|
73
|
+
[architecture docs](https://jrvannucci.github.io/plotpress/user_guide/architecture.html)
|
|
74
|
+
for exactly how much of the rendering pipeline each of these six actually
|
|
75
|
+
shares, and where a format gets its own dedicated path instead.
|
|
76
|
+
|
|
77
|
+
## Reading a figure back out of HTML
|
|
78
|
+
|
|
79
|
+
The interactive HTML above isn't a one-way trip: it embeds the plotted data
|
|
80
|
+
and the figure's own layout as JSON alongside the SVG, so a later process —
|
|
81
|
+
with none of the Python objects that built it still around — can read a
|
|
82
|
+
figure back out and rebuild it:
|
|
83
|
+
|
|
84
|
+
```
|
|
85
|
+
a saved .html (Figure.save(path, interactive=True))
|
|
86
|
+
embeds <script id="plotpress-pick"> and
|
|
87
|
+
id="plotpress-layout"> per figure
|
|
88
|
+
|
|
|
89
|
+
▼
|
|
90
|
+
plotpress.load_data(path)
|
|
91
|
+
parses that embedded JSON back out
|
|
92
|
+
|
|
|
93
|
+
+--------------+--------------+
|
|
94
|
+
▼ ▼
|
|
95
|
+
"layout" "axes"
|
|
96
|
+
(grid shape, each (recovered series/
|
|
97
|
+
axes' own decorations, mesh/pie data per axes,
|
|
98
|
+
groups, sup-title) keyed by title)
|
|
99
|
+
|
|
100
|
+
|
|
|
101
|
+
▼
|
|
102
|
+
plotpress.subplots_from_layout(layout)
|
|
103
|
+
rebuilds the grid and every axes' own
|
|
104
|
+
decorations -- not the plotted data itself
|
|
105
|
+
|
|
|
106
|
+
▼
|
|
107
|
+
a new, already-labeled Figure -- ready for
|
|
108
|
+
the caller to replot the recovered "axes"
|
|
109
|
+
data back into
|
|
110
|
+
```
|
|
111
|
+
|
|
112
|
+
A freeform `Figure.add_axes()` rect, an inset, or a colorbar axes has no grid
|
|
113
|
+
cell to rebuild from — its index is listed in `layout["omitted_axes"]`
|
|
114
|
+
instead of silently vanishing. See the
|
|
115
|
+
[full API and worked examples](https://jrvannucci.github.io/plotpress/usage.html#reading-html-data)
|
|
116
|
+
for the round trip end to end.
|
|
117
|
+
|
|
118
|
+
For the common case of a *uniform* grid — every axes its own single
|
|
119
|
+
`pcolormesh` or line series, all the same shape — `plotpress.load_data_xarray()`
|
|
120
|
+
skips the title-keyed dict above entirely and reads the same file straight
|
|
121
|
+
into one `xarray.Dataset` indexed by row/column instead, with the recovered
|
|
122
|
+
layout still available under `ds.attrs["layout"]` for
|
|
123
|
+
`plotpress.subplots_from_layout()`. See the
|
|
124
|
+
[data round-trip example](https://jrvannucci.github.io/plotpress/auto_examples/data_roundtrip/index.html)
|
|
125
|
+
for both paths worked through end to end.
|
|
126
|
+
|
|
70
127
|
## What it is for
|
|
71
128
|
|
|
72
129
|
plotpress is **not a matplotlib replacement**, and it does not try to match
|
|
@@ -119,17 +176,20 @@ forces. Every application figure is embedded live, with the interactive toolbar.
|
|
|
119
176
|
|
|
120
177
|
```bash
|
|
121
178
|
pip install plotpress # SVG + interactive HTML + PNG/PDF export
|
|
122
|
-
pip install plotpress[
|
|
123
|
-
pip install plotpress[
|
|
124
|
-
pip install plotpress[dev] # + pytest (contributors)
|
|
125
|
-
pip install plotpress[bench] # + matplotlib (benchmark comparison)
|
|
179
|
+
pip install plotpress[full] # + every real end-user feature: viewers (gui, qt, jupyter) + xarray
|
|
180
|
+
pip install plotpress[contrib] # + everything a contributor needs (dev, browser, bench, docs)
|
|
126
181
|
```
|
|
127
182
|
|
|
128
183
|
The standard install covers **all file output** -- SVG, interactive HTML, PNG and
|
|
129
184
|
vector PDF -- with pure-wheel dependencies that install everywhere (servers, CI,
|
|
130
|
-
notebooks).
|
|
131
|
-
|
|
132
|
-
|
|
185
|
+
notebooks). `[full]` is likely what you want if you're reaching for more than
|
|
186
|
+
that at all; each of its pieces (`[gui]`, `[qt]`, `[jupyter]`, `[xarray]`, or all
|
|
187
|
+
three viewers via `[viewers]`) also installs on its own, or combined in one
|
|
188
|
+
command (`pip install plotpress[gui,xarray]`), for anyone who wants less than
|
|
189
|
+
the full bundle -- `[gui]`, for instance, pulls a desktop webview stack for the
|
|
190
|
+
native `fig.show()` window that a `[qt]`-only or `[jupyter]`-only install has
|
|
191
|
+
no reason to carry. See [Installation](https://jrvannucci.github.io/plotpress/installation.html)
|
|
192
|
+
for the full extras reference.
|
|
133
193
|
|
|
134
194
|
## Output surfaces (one scene, many targets)
|
|
135
195
|
|
|
@@ -10,8 +10,10 @@ Distinct from matplotlib in three ways:
|
|
|
10
10
|
``scatter``, ``pcolormesh``, ``set_xlabel``, ``legend`` mirror matplotlib so
|
|
11
11
|
existing code is easy to port. ``plotpress.subplots(...)`` returns
|
|
12
12
|
``(fig, axes)`` just like ``plt.subplots(...)`` -- minus the globals.
|
|
13
|
-
3. **SVG-first
|
|
14
|
-
mesh/image layers)
|
|
13
|
+
3. **SVG-first, fast, and multi-format.** Output is vector SVG (with embedded
|
|
14
|
+
raster only for mesh/image layers) -- and from that same figure, also PNG,
|
|
15
|
+
PDF, self-contained interactive HTML (a full pan/zoom/pick/annotate
|
|
16
|
+
toolbar), or a Vega/Vega-Lite JSON spec. The hot paths are vectorized in
|
|
15
17
|
NumPy and huge lines are decimated, so it is fast in **pure Python** -- no
|
|
16
18
|
compiled extension, installs everywhere pip does.
|
|
17
19
|
|
|
@@ -130,16 +130,21 @@ first ``plotpressAddTool()`` call -- never folded into a built-in one.
|
|
|
130
130
|
**Extract** opens a panel to copy out picked points (not annotations -- see
|
|
131
131
|
``doExtract()``) as CSV.
|
|
132
132
|
|
|
133
|
-
**Save As**
|
|
134
|
-
hidden-legend-series toggles, and Hide Points/Hide
|
|
135
|
-
|
|
136
|
-
session left off, not just what was originally plotted.
|
|
137
|
-
|
|
138
|
-
a
|
|
139
|
-
|
|
140
|
-
|
|
141
|
-
|
|
142
|
-
|
|
133
|
+
**Save**/**Save As** both persist the current page -- pan/zoom, every
|
|
134
|
+
pin/annotation, hidden-legend-series toggles, and Hide Points/Hide
|
|
135
|
+
Annotations -- as a self-contained HTML file: reopening it resumes exactly
|
|
136
|
+
where this session left off, not just what was originally plotted. They are
|
|
137
|
+
functionally identical today: both open the browser's native save picker
|
|
138
|
+
(Chromium, a secure context; a plain download everywhere else) pre-filled
|
|
139
|
+
with a filename derived from the page's ``<title>``, not a handle to
|
|
140
|
+
whatever file the page was originally opened from -- a plain HTML file
|
|
141
|
+
opened by double-clicking or navigating to it carries no such handle for
|
|
142
|
+
the page to reuse, so there is nothing to reuse it. Overwriting the original
|
|
143
|
+
file is one click away (browsers already warn before replacing an existing
|
|
144
|
+
file at the same path) rather than automatic. Both work the same way inside
|
|
145
|
+
a :class:`~plotpress.Report`'s embedded figure -- each panel is its own
|
|
146
|
+
independent document, so saving from one saves only that panel, not the
|
|
147
|
+
whole report.
|
|
143
148
|
|
|
144
149
|
Legend entries remain clickable to toggle series regardless of mode.
|
|
145
150
|
"""
|
|
@@ -2409,6 +2414,13 @@ _JS_SOURCE = r"""
|
|
|
2409
2414
|
saveViaPicker(buildSaveHTML());
|
|
2410
2415
|
}
|
|
2411
2416
|
|
|
2417
|
+
// Deliberately identical to saveAsNewPage() today, not an accidental
|
|
2418
|
+
// duplicate left behind by a refactor: see saveViaPicker()'s own comment
|
|
2419
|
+
// above for why there is no writable handle to "the file this page was
|
|
2420
|
+
// opened from" for either button to reuse. Kept as its own named function
|
|
2421
|
+
// (rather than aliased or merged) so the two toolbar entries stay easy to
|
|
2422
|
+
// tell apart if a real overwrite-in-place path is ever added for one of
|
|
2423
|
+
// them but not the other.
|
|
2412
2424
|
function overwriteCurrentPage() {
|
|
2413
2425
|
saveViaPicker(buildSaveHTML());
|
|
2414
2426
|
}
|
|
@@ -0,0 +1 @@
|
|
|
1
|
+
__version__ = "0.24.0"
|
|
@@ -757,6 +757,22 @@ def _as_colors(color, n):
|
|
|
757
757
|
return [color] * n
|
|
758
758
|
|
|
759
759
|
|
|
760
|
+
def _broadcast_field(value, shape):
|
|
761
|
+
"""A scalar-or-array field, broadcast to ``shape`` and copied.
|
|
762
|
+
|
|
763
|
+
``Bars.thickness``/``.base``, ``FillBetween.y1``/``.y2``, and
|
|
764
|
+
``ErrorBar.yerr``/``.xerr`` each independently did
|
|
765
|
+
``np.broadcast_to(np.asarray(value, float), shape).copy()`` -- and this
|
|
766
|
+
exact bug class already bit one of them once: ``FillBetween`` broadcasting
|
|
767
|
+
only ``y2`` (its default is the scalar ``0.0``) and not ``y1`` made
|
|
768
|
+
``fill_between(x, floor, series)`` crash with an unrelated-looking
|
|
769
|
+
``column_stack`` shape error, while the same call with the arguments
|
|
770
|
+
swapped worked fine. One helper, used on both sides of every such pair,
|
|
771
|
+
makes that mistake structurally harder to repeat.
|
|
772
|
+
"""
|
|
773
|
+
return np.broadcast_to(np.asarray(value, float), shape).copy()
|
|
774
|
+
|
|
775
|
+
|
|
760
776
|
class Bars(Artist):
|
|
761
777
|
"""Rectangular bars (bar / barh / hist)."""
|
|
762
778
|
|
|
@@ -764,9 +780,8 @@ class Bars(Artist):
|
|
|
764
780
|
edgecolor=None, linewidth=0.8, label=None, alpha=1.0):
|
|
765
781
|
self.pos = np.atleast_1d(np.asarray(pos, float))
|
|
766
782
|
self.length = np.atleast_1d(np.asarray(length, float))
|
|
767
|
-
self.thickness =
|
|
768
|
-
|
|
769
|
-
self.base = np.broadcast_to(np.asarray(base, float), self.pos.shape).copy()
|
|
783
|
+
self.thickness = _broadcast_field(thickness, self.pos.shape)
|
|
784
|
+
self.base = _broadcast_field(base, self.pos.shape)
|
|
770
785
|
self.orientation = orientation
|
|
771
786
|
self.colors = _as_colors(color, len(self.pos))
|
|
772
787
|
self.edgecolor = edgecolor
|
|
@@ -790,13 +805,10 @@ class FillBetween(Artist):
|
|
|
790
805
|
def __init__(self, x, y1, y2, color, alpha=0.4, label=None, edgecolor=None,
|
|
791
806
|
linewidth=0.0):
|
|
792
807
|
self.x = np.asarray(x, float)
|
|
793
|
-
# Broadcast *both* bounds against x
|
|
794
|
-
#
|
|
795
|
-
|
|
796
|
-
|
|
797
|
-
# the same call with the arguments the other way round worked.
|
|
798
|
-
self.y1 = np.broadcast_to(np.asarray(y1, float), self.x.shape).copy()
|
|
799
|
-
self.y2 = np.broadcast_to(np.asarray(y2, float), self.x.shape).copy()
|
|
808
|
+
# Broadcast *both* bounds against x (see _broadcast_field's own
|
|
809
|
+
# docstring for the bug this once caused when only one side was).
|
|
810
|
+
self.y1 = _broadcast_field(y1, self.x.shape)
|
|
811
|
+
self.y2 = _broadcast_field(y2, self.x.shape)
|
|
800
812
|
self.color = color
|
|
801
813
|
self.alpha = alpha
|
|
802
814
|
self.label = label
|
|
@@ -934,10 +946,8 @@ class ErrorBar(Artist):
|
|
|
934
946
|
capthick=None):
|
|
935
947
|
self.x = np.asarray(x, float)
|
|
936
948
|
self.y = np.asarray(y, float)
|
|
937
|
-
self.yerr = None if yerr is None else
|
|
938
|
-
|
|
939
|
-
self.xerr = None if xerr is None else np.broadcast_to(
|
|
940
|
-
np.asarray(xerr, float), self.x.shape).copy()
|
|
949
|
+
self.yerr = None if yerr is None else _broadcast_field(yerr, self.x.shape)
|
|
950
|
+
self.xerr = None if xerr is None else _broadcast_field(xerr, self.x.shape)
|
|
941
951
|
self.color = color
|
|
942
952
|
self.marker = marker
|
|
943
953
|
self.markersize = markersize
|