plotlywaterfall 1.1.0__tar.gz → 1.2.0__tar.gz
This diff represents the content of publicly available package versions that have been released to one of the supported registries. The information contained in this diff is provided for informational purposes only and reflects changes between package versions as they appear in their respective public registries.
- {plotlywaterfall-1.1.0 → plotlywaterfall-1.2.0}/CHANGELOG.md +19 -0
- {plotlywaterfall-1.1.0 → plotlywaterfall-1.2.0}/PKG-INFO +25 -1
- {plotlywaterfall-1.1.0 → plotlywaterfall-1.2.0}/README.md +24 -0
- plotlywaterfall-1.2.0/src/plotlywaterfall/__about__.py +1 -0
- {plotlywaterfall-1.1.0 → plotlywaterfall-1.2.0}/src/plotlywaterfall/waterfall.py +188 -18
- plotlywaterfall-1.2.0/tests/test_measure.py +247 -0
- {plotlywaterfall-1.1.0 → plotlywaterfall-1.2.0}/tests/test_order_and_format.py +8 -0
- plotlywaterfall-1.1.0/src/plotlywaterfall/__about__.py +0 -1
- {plotlywaterfall-1.1.0 → plotlywaterfall-1.2.0}/.gitignore +0 -0
- {plotlywaterfall-1.1.0 → plotlywaterfall-1.2.0}/LICENSE +0 -0
- {plotlywaterfall-1.1.0 → plotlywaterfall-1.2.0}/pyproject.toml +0 -0
- {plotlywaterfall-1.1.0 → plotlywaterfall-1.2.0}/src/plotlywaterfall/__init__.py +0 -0
- {plotlywaterfall-1.1.0 → plotlywaterfall-1.2.0}/src/plotlywaterfall/_coloring.py +0 -0
- {plotlywaterfall-1.1.0 → plotlywaterfall-1.2.0}/src/plotlywaterfall/_format.py +0 -0
- {plotlywaterfall-1.1.0 → plotlywaterfall-1.2.0}/src/plotlywaterfall/py.typed +0 -0
- {plotlywaterfall-1.1.0 → plotlywaterfall-1.2.0}/tests/test_basic.py +0 -0
- {plotlywaterfall-1.1.0 → plotlywaterfall-1.2.0}/tests/test_colors.py +0 -0
- {plotlywaterfall-1.1.0 → plotlywaterfall-1.2.0}/tests/test_function.py +0 -0
- {plotlywaterfall-1.1.0 → plotlywaterfall-1.2.0}/tests/test_labels.py +0 -0
- {plotlywaterfall-1.1.0 → plotlywaterfall-1.2.0}/tests/test_mixed_signs.py +0 -0
- {plotlywaterfall-1.1.0 → plotlywaterfall-1.2.0}/tests/test_readme.py +0 -0
- {plotlywaterfall-1.1.0 → plotlywaterfall-1.2.0}/tests/test_regressions.py +0 -0
|
@@ -2,6 +2,25 @@
|
|
|
2
2
|
|
|
3
3
|
## [Unreleased]
|
|
4
4
|
|
|
5
|
+
## [1.2.0] - 2026-11-05
|
|
6
|
+
|
|
7
|
+
### Added
|
|
8
|
+
- **Start and end levels for bridges**: `start="EBIT 2025"` marks x-values that hold a level, not a
|
|
9
|
+
change; they are drawn like totals (grey with direction colours, unsigned labels).
|
|
10
|
+
- **`measure` column** with plotly's `go.Waterfall` names: `"relative"` (change), `"absolute"`
|
|
11
|
+
(given level, e.g. budget or actual) and `"total"` (calculated level, value ignored). Works with
|
|
12
|
+
categories (stacked levels) and groups (each group its own levels).
|
|
13
|
+
- **`reconcile`** for given levels that the changes before them do not add up to: `"other"` (default)
|
|
14
|
+
inserts a bar for the difference (`reconcile_label`, default `"Other"`), `"jump"` draws the given
|
|
15
|
+
level, `"error"` raises `ValueError`.
|
|
16
|
+
- Example gallery: a new first part with finance examples (EBIT bridge, budget vs actual by segment,
|
|
17
|
+
monthly cash-flow walk, one bridge per region, from a ledger to a bridge) and sections on order,
|
|
18
|
+
dates and export.
|
|
19
|
+
|
|
20
|
+
### Changed
|
|
21
|
+
- Hover text of totals without categories names the total (`Subtotal: 5`) instead of `Total: 5`.
|
|
22
|
+
- Dates mixed with text labels on the x-axis (e.g. `"Opening"` and month ends) are formatted one by one.
|
|
23
|
+
|
|
5
24
|
## [1.1.0] - 2026-11-05
|
|
6
25
|
|
|
7
26
|
### Fixed
|
|
@@ -1,6 +1,6 @@
|
|
|
1
1
|
Metadata-Version: 2.5
|
|
2
2
|
Name: plotlywaterfall
|
|
3
|
-
Version: 1.
|
|
3
|
+
Version: 1.2.0
|
|
4
4
|
Summary: Plotly-express-style waterfall charts with groups, stacked categories, subtotals and custom colors.
|
|
5
5
|
Project-URL: Homepage, https://github.com/docdru/plotlywaterfall
|
|
6
6
|
Project-URL: Source, https://github.com/docdru/plotlywaterfall
|
|
@@ -97,6 +97,30 @@ fig
|
|
|
97
97
|
|
|
98
98
|
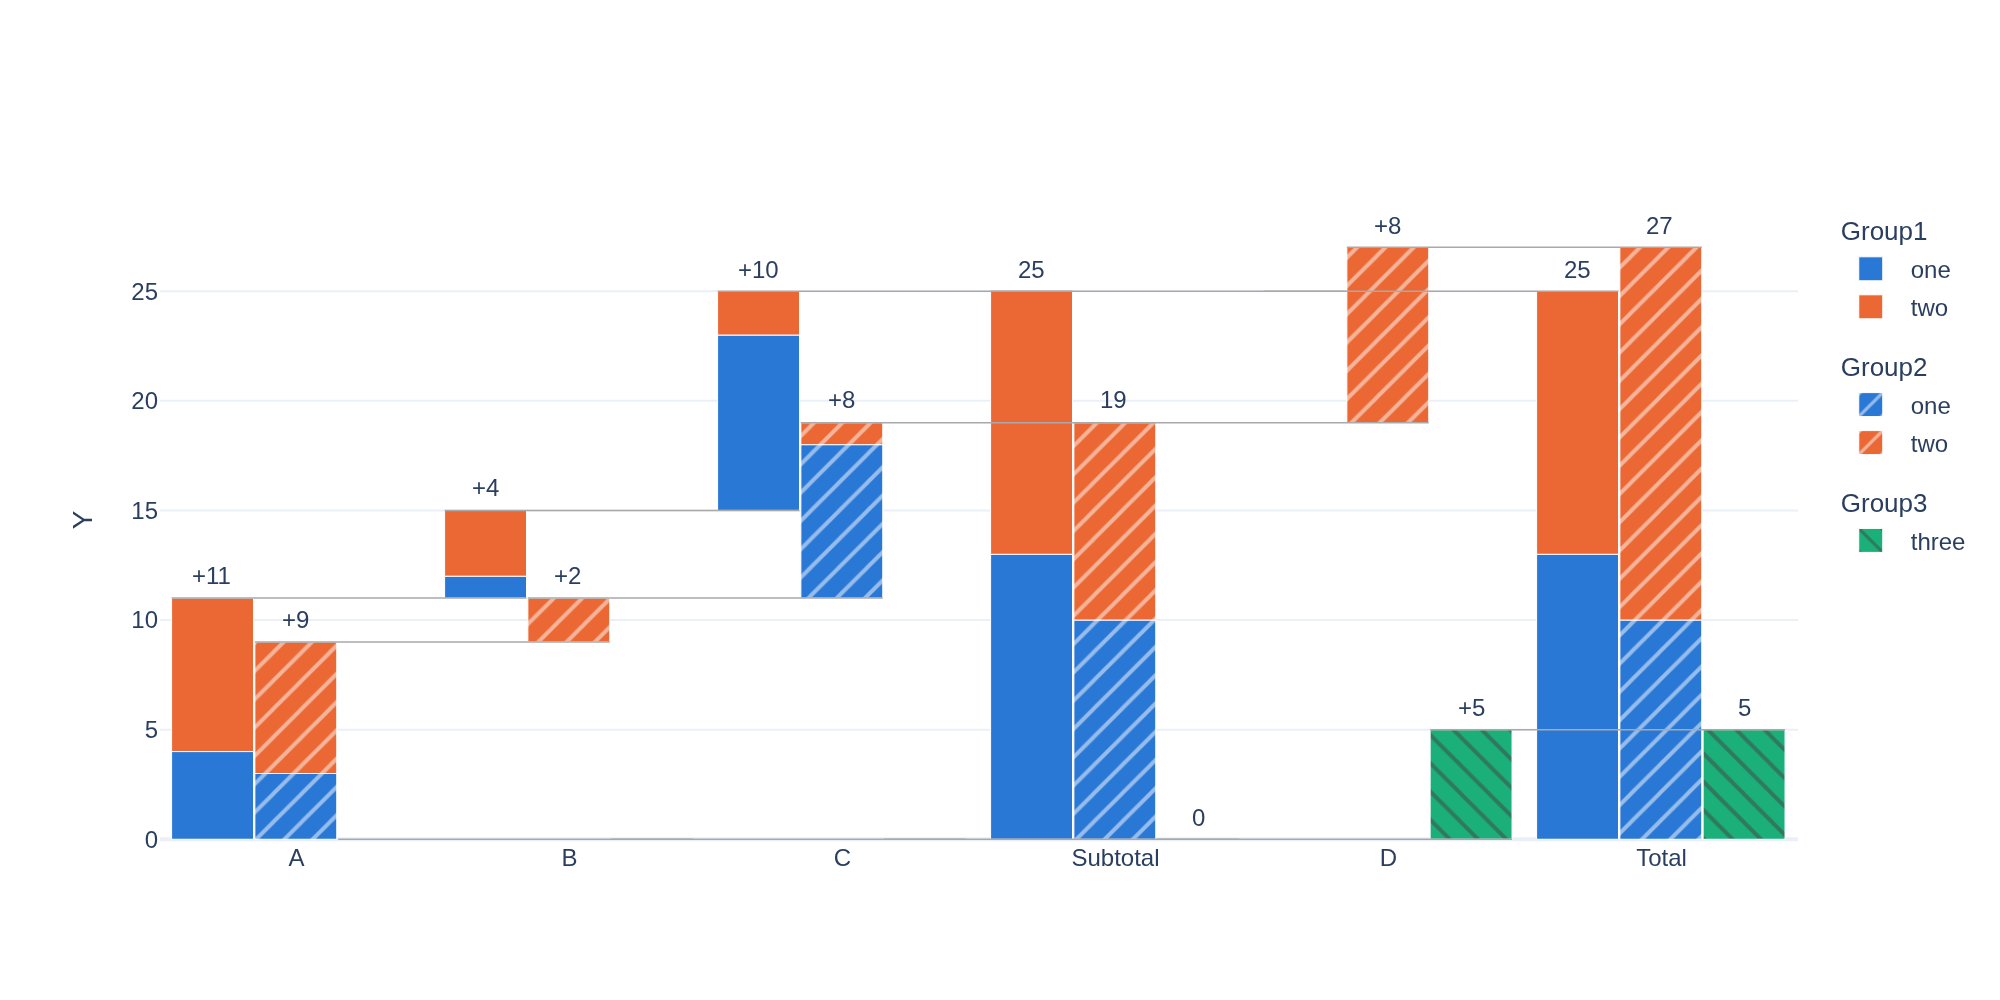
|
|
99
99
|
|
|
100
|
+
### Bridges: start and end levels
|
|
101
|
+
|
|
102
|
+
A finance bridge goes from one level to another, e.g. from last year's EBIT to this year's.
|
|
103
|
+
`start` marks the x-value that holds a level instead of a change; it is drawn like a total:
|
|
104
|
+
|
|
105
|
+
```python
|
|
106
|
+
waterfall(df, x="item", y="MEUR", start="EBIT 2025", total=True, total_column_name="EBIT 2026")
|
|
107
|
+
```
|
|
108
|
+
|
|
109
|
+
When the data says what each row is, pass a `measure` column with plotly's names: `"relative"`
|
|
110
|
+
(a change, also for empty cells), `"absolute"` (a given level, e.g. budget or actual) or `"total"`
|
|
111
|
+
(a level calculated from the rows before; its value is ignored).
|
|
112
|
+
|
|
113
|
+
| X | Y | measure |
|
|
114
|
+
|---|---|---|
|
|
115
|
+
| Budget | 100 | absolute |
|
|
116
|
+
| Volume | 2 | relative |
|
|
117
|
+
| Costs | -3.5 | relative |
|
|
118
|
+
| Actual | 102 | absolute |
|
|
119
|
+
|
|
120
|
+
If the changes do not add up to a given level, `reconcile` decides: `"other"` (default) inserts a bar
|
|
121
|
+
for the difference, labelled `reconcile_label` (`"Other"`), so the walk adds up; `"jump"` draws the
|
|
122
|
+
given level as it is; `"error"` raises a `ValueError`.
|
|
123
|
+
|
|
100
124
|
### Labels, number format and hover
|
|
101
125
|
|
|
102
126
|
Every bar is labelled with its change (signed, e.g. `+9`) or, for totals, its value; hovering shows
|
|
@@ -65,6 +65,30 @@ fig
|
|
|
65
65
|
|
|
66
66
|

|
|
67
67
|
|
|
68
|
+
### Bridges: start and end levels
|
|
69
|
+
|
|
70
|
+
A finance bridge goes from one level to another, e.g. from last year's EBIT to this year's.
|
|
71
|
+
`start` marks the x-value that holds a level instead of a change; it is drawn like a total:
|
|
72
|
+
|
|
73
|
+
```python
|
|
74
|
+
waterfall(df, x="item", y="MEUR", start="EBIT 2025", total=True, total_column_name="EBIT 2026")
|
|
75
|
+
```
|
|
76
|
+
|
|
77
|
+
When the data says what each row is, pass a `measure` column with plotly's names: `"relative"`
|
|
78
|
+
(a change, also for empty cells), `"absolute"` (a given level, e.g. budget or actual) or `"total"`
|
|
79
|
+
(a level calculated from the rows before; its value is ignored).
|
|
80
|
+
|
|
81
|
+
| X | Y | measure |
|
|
82
|
+
|---|---|---|
|
|
83
|
+
| Budget | 100 | absolute |
|
|
84
|
+
| Volume | 2 | relative |
|
|
85
|
+
| Costs | -3.5 | relative |
|
|
86
|
+
| Actual | 102 | absolute |
|
|
87
|
+
|
|
88
|
+
If the changes do not add up to a given level, `reconcile` decides: `"other"` (default) inserts a bar
|
|
89
|
+
for the difference, labelled `reconcile_label` (`"Other"`), so the walk adds up; `"jump"` draws the
|
|
90
|
+
given level as it is; `"error"` raises a `ValueError`.
|
|
91
|
+
|
|
68
92
|
### Labels, number format and hover
|
|
69
93
|
|
|
70
94
|
Every bar is labelled with its change (signed, e.g. `+9`) or, for totals, its value; hovering shows
|
|
@@ -0,0 +1 @@
|
|
|
1
|
+
__version__ = "1.2.0"
|
|
@@ -32,6 +32,28 @@ DEFAULT_NET_GHOST: dict[str, Any] = {
|
|
|
32
32
|
SUBSTEP_FILL = 0.9
|
|
33
33
|
# helper column with each row's position in the original DataFrame (order of appearance)
|
|
34
34
|
ROW = "__plotlywaterfall_row__"
|
|
35
|
+
Measure = Literal["relative", "total", "absolute"]
|
|
36
|
+
MEASURES: tuple[str, ...] = get_args(Measure)
|
|
37
|
+
Reconcile = Literal["other", "jump", "error"]
|
|
38
|
+
RECONCILE: tuple[str, ...] = get_args(Reconcile)
|
|
39
|
+
|
|
40
|
+
|
|
41
|
+
class GapKey:
|
|
42
|
+
"""x-position of an inserted bar for the gap between a given level and the walk.
|
|
43
|
+
|
|
44
|
+
Several gaps may carry the same label ("Other"), so each is its own object."""
|
|
45
|
+
|
|
46
|
+
def __init__(self, label: str, before: Any):
|
|
47
|
+
self.label = label
|
|
48
|
+
self.before = before
|
|
49
|
+
|
|
50
|
+
def __str__(self) -> str:
|
|
51
|
+
return self.label
|
|
52
|
+
|
|
53
|
+
def __repr__(self) -> str:
|
|
54
|
+
return f"GapKey({self.label!r}, before={self.before!r})"
|
|
55
|
+
|
|
56
|
+
|
|
35
57
|
VALUE_LABELS: tuple[str, ...] = get_args(ValueLabels)
|
|
36
58
|
|
|
37
59
|
|
|
@@ -68,6 +90,10 @@ class Waterfall:
|
|
|
68
90
|
labels: dict | None = None,
|
|
69
91
|
category_orders: dict[str, list] | None = None,
|
|
70
92
|
x_format: str | Callable[[Any], str] | None = None,
|
|
93
|
+
measure: str | None = None,
|
|
94
|
+
start: Any = None,
|
|
95
|
+
reconcile: Reconcile = "other",
|
|
96
|
+
reconcile_label: str = "Other",
|
|
71
97
|
):
|
|
72
98
|
"""Instanciate Waterfall object. All configuration is done by handing the correct kwargs.
|
|
73
99
|
|
|
@@ -145,6 +171,21 @@ class Waterfall:
|
|
|
145
171
|
pattern for dates (e.g. "%b %Y"), or a callable taking an x-value and returning
|
|
146
172
|
its label. Defaults to None: dates are shown as "Jan 2026" when they are in
|
|
147
173
|
different months, else as "2026-01-31"; other values as str(value).
|
|
174
|
+
measure (str | None, optional): Column saying what each row's value is, as in
|
|
175
|
+
plotly's go.Waterfall: "relative" (a change; also for empty cells), "absolute"
|
|
176
|
+
(a given level, e.g. last year's EBIT) or "total" (a level calculated from the
|
|
177
|
+
rows before; its value is ignored). Levels are drawn like totals. All rows of
|
|
178
|
+
an x-value must have the same measure. Defaults to None (all relative).
|
|
179
|
+
start (Any, optional): x-value (or list of x-values) whose rows are given levels,
|
|
180
|
+
a shortcut for measure="absolute" on them, e.g. start="EBIT 2025".
|
|
181
|
+
Defaults to None.
|
|
182
|
+
reconcile (str, optional): What to do when a given level differs from the level
|
|
183
|
+
the changes before it lead to: "other" inserts a bar for the difference
|
|
184
|
+
(labelled reconcile_label) so that the walk adds up, "jump" just draws the
|
|
185
|
+
given level, "error" raises ValueError. A given level at the start has nothing
|
|
186
|
+
to reconcile. Defaults to "other".
|
|
187
|
+
reconcile_label (str, optional): Label of the bars inserted by reconcile="other".
|
|
188
|
+
Defaults to "Other".
|
|
148
189
|
|
|
149
190
|
Raises:
|
|
150
191
|
TypeError: If df is not a DataFrame or subtotals is not a dict.
|
|
@@ -202,6 +243,7 @@ class Waterfall:
|
|
|
202
243
|
negative_style=negative_style,
|
|
203
244
|
unit=None if number_unit == "auto" else number_unit,
|
|
204
245
|
)
|
|
246
|
+
self._measure_column = measure
|
|
205
247
|
self._test_df()
|
|
206
248
|
self._category_orders = dict(category_orders or {})
|
|
207
249
|
dimensions = [c for c in (x, group, category) if c is not None]
|
|
@@ -212,6 +254,11 @@ class Waterfall:
|
|
|
212
254
|
)
|
|
213
255
|
self._x_values = self._ordered_values(x)
|
|
214
256
|
self._x_label = self._x_labeller(x_format)
|
|
257
|
+
if reconcile not in RECONCILE:
|
|
258
|
+
raise ValueError(f"reconcile must be one of {RECONCILE}, got {reconcile!r}")
|
|
259
|
+
self._reconcile = reconcile
|
|
260
|
+
self._reconcile_label = reconcile_label
|
|
261
|
+
self._measures = self._read_measures(measure, start)
|
|
215
262
|
self._coloring = Coloring(
|
|
216
263
|
df,
|
|
217
264
|
group=group,
|
|
@@ -253,7 +300,8 @@ class Waterfall:
|
|
|
253
300
|
position = {value: i for i, value in enumerate(self._x_values)}
|
|
254
301
|
tdf = self._df.assign(**{ROW: np.arange(len(self._df))})
|
|
255
302
|
tdf = tdf.iloc[np.argsort(tdf[self._x].map(position).to_numpy(), kind="stable")]
|
|
256
|
-
|
|
303
|
+
tdf, gaps = self._apply_measures(tdf)
|
|
304
|
+
X = self._get_x_values(tdf, gaps)
|
|
257
305
|
if self._number_unit == "auto":
|
|
258
306
|
self._fmt.unit = auto_unit(self._chart_values(tdf))
|
|
259
307
|
self._coloring.resolve()
|
|
@@ -316,14 +364,17 @@ class Waterfall:
|
|
|
316
364
|
return values
|
|
317
365
|
|
|
318
366
|
def _test_df(self) -> None:
|
|
319
|
-
for argument in ("x", "y", "group", "category"):
|
|
320
|
-
column = getattr(self, f"_{argument}")
|
|
367
|
+
for argument in ("x", "y", "group", "category", "measure"):
|
|
368
|
+
column = getattr(self, "_measure_column" if argument == "measure" else f"_{argument}")
|
|
321
369
|
if column is not None and column not in self._df.columns:
|
|
322
370
|
raise ValueError(
|
|
323
371
|
f"{argument}={column!r} is not a column of df. "
|
|
324
372
|
f"Available columns: {list(self._df.columns)}"
|
|
325
373
|
)
|
|
326
374
|
missing = self._df[self._y].isna()
|
|
375
|
+
if self._measure_column is not None and self._measure_column in self._df.columns:
|
|
376
|
+
# rows with measure "total" need no value: the level is calculated
|
|
377
|
+
missing &= self._df[self._measure_column] != "total"
|
|
327
378
|
if missing.any():
|
|
328
379
|
raise ValueError(
|
|
329
380
|
f"Column {self._y!r} contains missing values (NaN) in rows "
|
|
@@ -348,6 +399,91 @@ class Waterfall:
|
|
|
348
399
|
raise ValueError(f"Cannot find value {x!r} in data column {self._x!r}")
|
|
349
400
|
self._subtotals[x] = name
|
|
350
401
|
|
|
402
|
+
def _read_measures(self, measure: str | None, start: Any) -> dict[Any, str]:
|
|
403
|
+
"""x-value -> "total" / "absolute" for x-values that are levels (others are changes)."""
|
|
404
|
+
measures: dict[Any, str] = {}
|
|
405
|
+
if measure is not None:
|
|
406
|
+
kinds = self._df[measure].fillna("relative")
|
|
407
|
+
invalid = sorted(set(kinds) - set(MEASURES), key=str)
|
|
408
|
+
if invalid:
|
|
409
|
+
raise ValueError(f"measure values must be one of {MEASURES}, got {invalid}")
|
|
410
|
+
per_x = kinds.groupby(self._df[self._x], sort=False, observed=True).unique()
|
|
411
|
+
mixed = [x for x, values in per_x.items() if len(values) > 1]
|
|
412
|
+
if mixed:
|
|
413
|
+
raise ValueError(
|
|
414
|
+
f"All rows of an x-value need the same measure; differs for {mixed}"
|
|
415
|
+
)
|
|
416
|
+
measures = {x: values[0] for x, values in per_x.items() if values[0] != "relative"}
|
|
417
|
+
if start is not None:
|
|
418
|
+
for x in start if isinstance(start, (list, tuple)) else [start]:
|
|
419
|
+
if x not in self._x_values:
|
|
420
|
+
raise ValueError(f"start={x!r} is not a value of column {self._x!r}")
|
|
421
|
+
measures[x] = "absolute"
|
|
422
|
+
return measures
|
|
423
|
+
|
|
424
|
+
def _apply_measures(self, tdf: pd.DataFrame) -> tuple[pd.DataFrame, dict[Any, GapKey]]:
|
|
425
|
+
"""Turn given levels into changes, so that the rest of the code only sees changes.
|
|
426
|
+
|
|
427
|
+
A row with measure "absolute" at x-position p holds a level. It is replaced by the
|
|
428
|
+
change that leads from the level before p to the given one, per group and category.
|
|
429
|
+
That change is placed at p itself (a total position, which shows the cumulative
|
|
430
|
+
value, i.e. the given level) or, with reconcile="other", in an inserted "Other" bar
|
|
431
|
+
before p. Rows with measure "total" are dropped: p shows the calculated level.
|
|
432
|
+
"""
|
|
433
|
+
if not self._measures:
|
|
434
|
+
return tdf, {}
|
|
435
|
+
totals = [x for x, kind in self._measures.items() if kind == "total"]
|
|
436
|
+
absolutes = [x for x in self._x_values if self._measures.get(x) == "absolute"]
|
|
437
|
+
tdf = tdf[~tdf[self._x].isin(totals)]
|
|
438
|
+
position = {x: i for i, x in enumerate(self._x_values)}
|
|
439
|
+
gaps: dict[Any, GapKey] = {}
|
|
440
|
+
frames = []
|
|
441
|
+
for groupname, group in self._groups(tdf) if self._group is not None else [(None, tdf)]:
|
|
442
|
+
for p in absolutes:
|
|
443
|
+
at = group[group[self._x] == p]
|
|
444
|
+
if at.empty: # this group has no given level here: shown as a calculated total
|
|
445
|
+
continue
|
|
446
|
+
# rows before p (inserted gap rows of earlier levels have no position: before)
|
|
447
|
+
rank = group[self._x].map(position).fillna(-1)
|
|
448
|
+
before = group[rank < position[p]]
|
|
449
|
+
by = self._category
|
|
450
|
+
given = at.groupby(by, sort=False)[self._y].sum() if by else at[self._y].sum()
|
|
451
|
+
if by:
|
|
452
|
+
reached = before.groupby(by, sort=False)[self._y].sum()
|
|
453
|
+
keys = list(dict.fromkeys([*reached.index, *given.index]))
|
|
454
|
+
change = given.reindex(keys, fill_value=0) - reached.reindex(keys, fill_value=0)
|
|
455
|
+
else:
|
|
456
|
+
change = pd.Series({None: given - before[self._y].sum()})
|
|
457
|
+
group = group[group[self._x] != p]
|
|
458
|
+
change = change[~np.isclose(change.to_numpy(dtype=float), 0)]
|
|
459
|
+
if change.empty:
|
|
460
|
+
continue
|
|
461
|
+
target: Any = p
|
|
462
|
+
if not before.empty: # a level at the start has nothing to reconcile
|
|
463
|
+
if self._reconcile == "error":
|
|
464
|
+
raise ValueError(
|
|
465
|
+
f"The given level at {p!r} differs from the level the changes "
|
|
466
|
+
f"before it lead to by {change.sum():g}"
|
|
467
|
+
+ ("" if groupname is None else f" (group {groupname!r})")
|
|
468
|
+
+ '; use reconcile="other" or "jump"'
|
|
469
|
+
)
|
|
470
|
+
if self._reconcile == "other":
|
|
471
|
+
target = gaps.setdefault(p, GapKey(self._reconcile_label, p))
|
|
472
|
+
rows = pd.DataFrame(
|
|
473
|
+
{
|
|
474
|
+
self._x: [target] * len(change),
|
|
475
|
+
self._y: change.to_numpy(dtype=float),
|
|
476
|
+
ROW: len(self._df) + np.arange(len(change)),
|
|
477
|
+
}
|
|
478
|
+
)
|
|
479
|
+
if by:
|
|
480
|
+
rows[by] = list(change.index)
|
|
481
|
+
if self._group is not None:
|
|
482
|
+
rows[self._group] = groupname
|
|
483
|
+
group = pd.concat([group, rows], ignore_index=True)
|
|
484
|
+
frames.append(group)
|
|
485
|
+
return pd.concat(frames, ignore_index=True), gaps
|
|
486
|
+
|
|
351
487
|
def _ordered_values(self, column: str) -> list:
|
|
352
488
|
"""Values of a column in display order: category_orders first, then a Categorical's
|
|
353
489
|
order, else the order of appearance."""
|
|
@@ -364,18 +500,21 @@ class Waterfall:
|
|
|
364
500
|
return values
|
|
365
501
|
|
|
366
502
|
def _x_labeller(self, x_format: str | Callable[[Any], str] | None) -> Callable[[Any], str]:
|
|
367
|
-
"""Function that turns an x-value into its axis / hover label.
|
|
503
|
+
"""Function that turns an x-value into its axis / hover label. Dates are formatted one
|
|
504
|
+
by one, so that they can be mixed with text labels such as "Opening"."""
|
|
368
505
|
if callable(x_format):
|
|
369
506
|
return x_format
|
|
370
507
|
dates = [v for v in self._x_values if isinstance(v, (datetime.date, np.datetime64))]
|
|
371
|
-
if
|
|
372
|
-
if
|
|
508
|
+
if not dates:
|
|
509
|
+
if x_format is not None:
|
|
373
510
|
raise ValueError(
|
|
374
511
|
"x_format as a string is a strftime pattern for date x-values; "
|
|
375
512
|
"use a callable for other values"
|
|
376
513
|
)
|
|
514
|
+
return str
|
|
515
|
+
if x_format is not None:
|
|
377
516
|
pattern = x_format
|
|
378
|
-
|
|
517
|
+
else:
|
|
379
518
|
stamps = pd.to_datetime(pd.Series(dates))
|
|
380
519
|
if (stamps != stamps.dt.normalize()).any():
|
|
381
520
|
pattern = "%Y-%m-%d %H:%M"
|
|
@@ -383,23 +522,37 @@ class Waterfall:
|
|
|
383
522
|
pattern = "%b %Y"
|
|
384
523
|
else:
|
|
385
524
|
pattern = "%Y-%m-%d"
|
|
386
|
-
|
|
387
|
-
|
|
388
|
-
|
|
525
|
+
|
|
526
|
+
def label(value: Any) -> str:
|
|
527
|
+
if isinstance(value, (datetime.date, np.datetime64)):
|
|
528
|
+
return pd.Timestamp(value).strftime(pattern)
|
|
529
|
+
return str(value)
|
|
530
|
+
|
|
531
|
+
return label
|
|
389
532
|
|
|
390
533
|
def _label(self, value: Any, is_total: bool) -> str:
|
|
391
534
|
"""Label of an x-axis position; totals and subtotals carry their name."""
|
|
392
|
-
|
|
535
|
+
if is_total or isinstance(value, GapKey):
|
|
536
|
+
return str(value)
|
|
537
|
+
return self._x_label(value)
|
|
393
538
|
|
|
394
539
|
def _offset(self, groupno: int) -> float:
|
|
395
540
|
"""Horizontal offset of the left edge of group `groupno`'s bars from the x-value."""
|
|
396
541
|
step = self._barwidth + self._gap / 2
|
|
397
542
|
return -step * self.__totalgroups / 2 + step * groupno
|
|
398
543
|
|
|
399
|
-
def _get_x_values(
|
|
400
|
-
|
|
401
|
-
|
|
402
|
-
|
|
544
|
+
def _get_x_values(
|
|
545
|
+
self, tdf: pd.DataFrame, gaps: dict[Any, GapKey] | None = None
|
|
546
|
+
) -> pd.DataFrame:
|
|
547
|
+
# Define x axis and include subtotals and totals; levels (measure) show like totals
|
|
548
|
+
labels: list = []
|
|
549
|
+
mt: list[bool] = []
|
|
550
|
+
for value in self._x_values:
|
|
551
|
+
if gaps and value in gaps:
|
|
552
|
+
labels.append(gaps[value])
|
|
553
|
+
mt.append(False)
|
|
554
|
+
labels.append(value)
|
|
555
|
+
mt.append(value in self._measures)
|
|
403
556
|
for total in self._subtotals:
|
|
404
557
|
pos = labels.index(total) + 1
|
|
405
558
|
labels.insert(pos, self._subtotals[total])
|
|
@@ -419,7 +572,13 @@ class Waterfall:
|
|
|
419
572
|
sums = group.groupby([self._x], sort=False)[self._y].sum()
|
|
420
573
|
steps = X.merge(pd.DataFrame(sums), left_index=True, right_index=True, how="left")[self._y]
|
|
421
574
|
# (positions without data of this group have no bar; their base stays 0 as before)
|
|
422
|
-
level =
|
|
575
|
+
level = (
|
|
576
|
+
steps.fillna(0)
|
|
577
|
+
.cumsum()
|
|
578
|
+
.shift(1)
|
|
579
|
+
.fillna(0)
|
|
580
|
+
.where(steps.notna() & ~X.makeTotal.astype(bool), 0)
|
|
581
|
+
)
|
|
423
582
|
|
|
424
583
|
# (category name, rows) pairs; a single unnamed "category" without a category column
|
|
425
584
|
categories: list[tuple[Any, pd.DataFrame]]
|
|
@@ -488,7 +647,10 @@ class Waterfall:
|
|
|
488
647
|
texts.append("")
|
|
489
648
|
continue
|
|
490
649
|
total = bool(is_total[p])
|
|
491
|
-
|
|
650
|
+
if categoryname is not None:
|
|
651
|
+
name = categoryname
|
|
652
|
+
else:
|
|
653
|
+
name = self._label(label, total) if total else "Change"
|
|
492
654
|
lines = [f"{name}: {self._fmt(value, signed=not total)}"]
|
|
493
655
|
if total and n_segments[p] > 1:
|
|
494
656
|
lines.append(f"{self._label(label, total)}: {self._fmt(net[p])}")
|
|
@@ -590,7 +752,7 @@ class Waterfall:
|
|
|
590
752
|
|
|
591
753
|
def _category_values(self, X: pd.DataFrame, category: pd.DataFrame) -> np.ndarray:
|
|
592
754
|
"""Segment heights of one category per x-position; totals hold the running sum."""
|
|
593
|
-
values = category.groupby([self._x])[self._y].sum()
|
|
755
|
+
values = category.groupby([self._x], sort=False)[self._y].sum()
|
|
594
756
|
y = X.merge(pd.DataFrame(values), left_index=True, right_index=True, how="left")[self._y]
|
|
595
757
|
return y.fillna(0).cumsum().where(X.makeTotal, y).to_numpy(dtype=float)
|
|
596
758
|
|
|
@@ -748,6 +910,10 @@ def waterfall(
|
|
|
748
910
|
labels: dict | None = None,
|
|
749
911
|
category_orders: dict[str, list] | None = None,
|
|
750
912
|
x_format: str | Callable[[Any], str] | None = None,
|
|
913
|
+
measure: str | None = None,
|
|
914
|
+
start: Any = None,
|
|
915
|
+
reconcile: Reconcile = "other",
|
|
916
|
+
reconcile_label: str = "Other",
|
|
751
917
|
mixed_signs: MixedSigns = "steps",
|
|
752
918
|
net_ghost: bool | dict = True,
|
|
753
919
|
step_order: StepOrder = "data",
|
|
@@ -789,6 +955,10 @@ def waterfall(
|
|
|
789
955
|
labels=labels,
|
|
790
956
|
category_orders=category_orders,
|
|
791
957
|
x_format=x_format,
|
|
958
|
+
measure=measure,
|
|
959
|
+
start=start,
|
|
960
|
+
reconcile=reconcile,
|
|
961
|
+
reconcile_label=reconcile_label,
|
|
792
962
|
mixed_signs=mixed_signs,
|
|
793
963
|
net_ghost=net_ghost,
|
|
794
964
|
step_order=step_order,
|
|
@@ -0,0 +1,247 @@
|
|
|
1
|
+
"""Given and calculated levels: measure, start, reconcile (1.2.0)."""
|
|
2
|
+
|
|
3
|
+
import numpy as np
|
|
4
|
+
import pandas as pd
|
|
5
|
+
import pytest
|
|
6
|
+
|
|
7
|
+
from plotlywaterfall import Waterfall, waterfall
|
|
8
|
+
|
|
9
|
+
INCREASE, DECREASE, TOTAL = "#2ca02c", "#d62728", "#7f7f7f"
|
|
10
|
+
|
|
11
|
+
|
|
12
|
+
@pytest.fixture
|
|
13
|
+
def bridge():
|
|
14
|
+
return pd.DataFrame(
|
|
15
|
+
{"X": ["EBIT 2025", "Volume", "Price", "FX", "Costs"], "Y": [100, 12, 5, -4, -9]}
|
|
16
|
+
)
|
|
17
|
+
|
|
18
|
+
|
|
19
|
+
@pytest.fixture
|
|
20
|
+
def two_years():
|
|
21
|
+
return pd.DataFrame(
|
|
22
|
+
{
|
|
23
|
+
"X": [
|
|
24
|
+
"EBIT 2024",
|
|
25
|
+
"Volume 25",
|
|
26
|
+
"Costs 25",
|
|
27
|
+
"EBIT 2025",
|
|
28
|
+
"Volume 26",
|
|
29
|
+
"Costs 26",
|
|
30
|
+
"EBIT 2026",
|
|
31
|
+
],
|
|
32
|
+
"Y": [100, 12, -5, 110, 8, -3, None],
|
|
33
|
+
"measure": [
|
|
34
|
+
"absolute",
|
|
35
|
+
"relative",
|
|
36
|
+
"relative",
|
|
37
|
+
"absolute",
|
|
38
|
+
"relative",
|
|
39
|
+
"relative",
|
|
40
|
+
"total",
|
|
41
|
+
],
|
|
42
|
+
}
|
|
43
|
+
)
|
|
44
|
+
|
|
45
|
+
|
|
46
|
+
def _bars(fig):
|
|
47
|
+
(trace,) = [t for t in fig.data if t["legendgroup"] != "direction"]
|
|
48
|
+
return trace
|
|
49
|
+
|
|
50
|
+
|
|
51
|
+
def _labels(fig):
|
|
52
|
+
return [a["text"] for a in fig.layout.annotations]
|
|
53
|
+
|
|
54
|
+
|
|
55
|
+
def _clean(values):
|
|
56
|
+
return [None if np.isnan(v) else float(v) for v in values]
|
|
57
|
+
|
|
58
|
+
|
|
59
|
+
# --- start shortcut ------------------------------------------------------------------------
|
|
60
|
+
|
|
61
|
+
|
|
62
|
+
def test_start_is_drawn_as_a_level(bridge):
|
|
63
|
+
fig = waterfall(
|
|
64
|
+
bridge, x="X", y="Y", start="EBIT 2025", total=True, total_column_name="EBIT 2026"
|
|
65
|
+
)
|
|
66
|
+
bars = _bars(fig)
|
|
67
|
+
assert list(fig.layout.xaxis.ticktext) == [
|
|
68
|
+
"EBIT 2025",
|
|
69
|
+
"Volume",
|
|
70
|
+
"Price",
|
|
71
|
+
"FX",
|
|
72
|
+
"Costs",
|
|
73
|
+
"EBIT 2026",
|
|
74
|
+
]
|
|
75
|
+
assert _clean(bars["y"]) == [100, 12, 5, -4, -9, 104]
|
|
76
|
+
assert list(bars["base"]) == [0, 100, 112, 117, 113, 0]
|
|
77
|
+
assert list(bars["marker"]["color"]) == [TOTAL, INCREASE, INCREASE, DECREASE, DECREASE, TOTAL]
|
|
78
|
+
assert _labels(fig) == ["100", "+12", "+5", "-4", "-9", "104"] # levels unsigned
|
|
79
|
+
assert bars["customdata"][0][1] == "EBIT 2025: 100"
|
|
80
|
+
assert "Increase" in [t["name"] for t in fig.data] # legend: the start is not an increase
|
|
81
|
+
assert [t["name"] for t in fig.data if t["legendgroup"] == "direction"] == [
|
|
82
|
+
"Increase",
|
|
83
|
+
"Decrease",
|
|
84
|
+
"Total",
|
|
85
|
+
]
|
|
86
|
+
|
|
87
|
+
|
|
88
|
+
def test_without_start_the_first_value_is_a_change(bridge):
|
|
89
|
+
fig = waterfall(bridge, x="X", y="Y")
|
|
90
|
+
assert _labels(fig)[0] == "+100"
|
|
91
|
+
|
|
92
|
+
|
|
93
|
+
def test_start_list_and_unknown_value(bridge):
|
|
94
|
+
fig = waterfall(bridge, x="X", y="Y", start=["EBIT 2025"])
|
|
95
|
+
assert _labels(fig)[0] == "100"
|
|
96
|
+
with pytest.raises(ValueError, match="start='EBIT 2030'"):
|
|
97
|
+
waterfall(bridge, x="X", y="Y", start="EBIT 2030")
|
|
98
|
+
|
|
99
|
+
|
|
100
|
+
# --- measure column ------------------------------------------------------------------------
|
|
101
|
+
|
|
102
|
+
|
|
103
|
+
def test_reconcile_other_inserts_the_gap(two_years):
|
|
104
|
+
fig = waterfall(two_years, x="X", y="Y", measure="measure")
|
|
105
|
+
bars = _bars(fig)
|
|
106
|
+
assert list(fig.layout.xaxis.ticktext) == [
|
|
107
|
+
"EBIT 2024", "Volume 25", "Costs 25", "Other", "EBIT 2025", "Volume 26", "Costs 26", "EBIT 2026",
|
|
108
|
+
] # fmt: skip
|
|
109
|
+
assert _clean(bars["y"]) == [100, 12, -5, 3, 110, 8, -3, 115]
|
|
110
|
+
assert list(bars["base"]) == [0, 100, 112, 107, 0, 110, 118, 0]
|
|
111
|
+
assert [s["y0"] for s in fig.layout.shapes] == [100, 112, 107, 110, 110, 118, 115]
|
|
112
|
+
assert bars["customdata"][3][1] == "Change: +3<br>Running total: 110"
|
|
113
|
+
|
|
114
|
+
|
|
115
|
+
def test_reconcile_jump_draws_the_given_level(two_years):
|
|
116
|
+
fig = waterfall(two_years, x="X", y="Y", measure="measure", reconcile="jump")
|
|
117
|
+
bars = _bars(fig)
|
|
118
|
+
assert "Other" not in list(fig.layout.xaxis.ticktext)
|
|
119
|
+
assert _clean(bars["y"]) == [100, 12, -5, 110, 8, -3, 115]
|
|
120
|
+
# the connector arrives at 107 and the next one leaves at 110: the jump stays visible
|
|
121
|
+
assert [s["y0"] for s in fig.layout.shapes] == [100, 112, 107, 110, 118, 115]
|
|
122
|
+
|
|
123
|
+
|
|
124
|
+
def test_reconcile_error(two_years):
|
|
125
|
+
with pytest.raises(ValueError, match=r"differs from the level .* by 3"):
|
|
126
|
+
waterfall(two_years, x="X", y="Y", measure="measure", reconcile="error")
|
|
127
|
+
|
|
128
|
+
|
|
129
|
+
def test_matching_levels_need_no_reconciliation(two_years):
|
|
130
|
+
two_years.loc[3, "Y"] = 107
|
|
131
|
+
for reconcile in ("other", "error"):
|
|
132
|
+
fig = waterfall(two_years, x="X", y="Y", measure="measure", reconcile=reconcile)
|
|
133
|
+
assert "Other" not in list(fig.layout.xaxis.ticktext)
|
|
134
|
+
assert _clean(_bars(fig)["y"])[3] == 107
|
|
135
|
+
|
|
136
|
+
|
|
137
|
+
def test_total_rows_are_calculated_and_their_values_ignored(two_years):
|
|
138
|
+
two_years.loc[6, "Y"] = 999
|
|
139
|
+
fig = waterfall(two_years, x="X", y="Y", measure="measure")
|
|
140
|
+
assert _clean(_bars(fig)["y"])[-1] == 115
|
|
141
|
+
|
|
142
|
+
|
|
143
|
+
def test_empty_measure_cells_are_changes():
|
|
144
|
+
df = pd.DataFrame({"X": ["Start", "A"], "Y": [10, 2], "measure": ["absolute", None]})
|
|
145
|
+
fig = waterfall(df, x="X", y="Y", measure="measure")
|
|
146
|
+
assert _labels(fig) == ["10", "+2"]
|
|
147
|
+
|
|
148
|
+
|
|
149
|
+
def test_reconcile_label_and_several_gaps():
|
|
150
|
+
df = pd.DataFrame(
|
|
151
|
+
{
|
|
152
|
+
"X": ["Q1", "a", "Q2", "b", "Q3"],
|
|
153
|
+
"Y": [10, 1, 12, 1, 15],
|
|
154
|
+
"measure": ["absolute", "relative", "absolute", "relative", "absolute"],
|
|
155
|
+
}
|
|
156
|
+
)
|
|
157
|
+
fig = waterfall(df, x="X", y="Y", measure="measure", reconcile_label="Unexplained")
|
|
158
|
+
assert list(fig.layout.xaxis.ticktext) == [
|
|
159
|
+
"Q1",
|
|
160
|
+
"a",
|
|
161
|
+
"Unexplained",
|
|
162
|
+
"Q2",
|
|
163
|
+
"b",
|
|
164
|
+
"Unexplained",
|
|
165
|
+
"Q3",
|
|
166
|
+
]
|
|
167
|
+
assert _clean(_bars(fig)["y"]) == [10, 1, 1, 12, 1, 2, 15]
|
|
168
|
+
|
|
169
|
+
|
|
170
|
+
# --- categories and groups -----------------------------------------------------------------
|
|
171
|
+
|
|
172
|
+
|
|
173
|
+
def test_plan_vs_actual_with_categories():
|
|
174
|
+
df = pd.DataFrame(
|
|
175
|
+
{
|
|
176
|
+
"X": ["Plan", "Plan", "Volume", "Volume", "Price", "Actual", "Actual"],
|
|
177
|
+
"Y": [60, 40, 5, -3, 2, 63, 38],
|
|
178
|
+
"category": ["A", "B", "A", "B", "A", "A", "B"],
|
|
179
|
+
"measure": ["absolute"] * 2 + ["relative"] * 3 + ["absolute"] * 2,
|
|
180
|
+
}
|
|
181
|
+
)
|
|
182
|
+
fig = waterfall(df, x="X", y="Y", category="category", measure="measure")
|
|
183
|
+
assert list(fig.layout.xaxis.ticktext) == ["Plan", "Volume", "Price", "Other", "Actual"]
|
|
184
|
+
traces = {t["name"]: t for t in fig.data}
|
|
185
|
+
# per category: A walks 60 -> 65 -> 67 -> 63 (gap -4), B walks 40 -> 37 -> 38 (gap +1)
|
|
186
|
+
assert _clean(traces["A"]["y"]) == [60, 5, 2, -4, 63]
|
|
187
|
+
assert _clean(traces["B"]["y"]) == [40, -3, None, 1, 38]
|
|
188
|
+
assert _labels(fig) == ["100", "+2", "+2", "-3", "101"]
|
|
189
|
+
|
|
190
|
+
|
|
191
|
+
def test_each_group_has_its_own_levels():
|
|
192
|
+
df = pd.DataFrame(
|
|
193
|
+
{
|
|
194
|
+
"X": ["Start", "A", "End"] * 2,
|
|
195
|
+
"Y": [10, 2, 12, 50, -5, 40],
|
|
196
|
+
"group": ["G1"] * 3 + ["G2"] * 3,
|
|
197
|
+
}
|
|
198
|
+
)
|
|
199
|
+
fig = waterfall(df, x="X", y="Y", group="group", start=["Start", "End"])
|
|
200
|
+
bars = {t["name"]: t for t in fig.data if t["legendgroup"] != "direction"}
|
|
201
|
+
# G1 needs no reconciliation (10 + 2 = 12), G2 does (50 - 5 = 45, given 40)
|
|
202
|
+
assert list(fig.layout.xaxis.ticktext) == ["Start", "A", "Other", "End"]
|
|
203
|
+
assert _clean(bars["G1"]["y"]) == [10, 2, None, 12]
|
|
204
|
+
assert _clean(bars["G2"]["y"]) == [50, -5, -5, 40]
|
|
205
|
+
|
|
206
|
+
|
|
207
|
+
def test_group_without_a_given_level_shows_the_calculated_one():
|
|
208
|
+
df = pd.DataFrame(
|
|
209
|
+
{
|
|
210
|
+
"X": ["Start", "A", "End", "Start", "A"],
|
|
211
|
+
"Y": [10, 2, 20, 5, 1],
|
|
212
|
+
"group": ["G1"] * 3 + ["G2"] * 2,
|
|
213
|
+
}
|
|
214
|
+
)
|
|
215
|
+
fig = waterfall(df, x="X", y="Y", group="group", start=["Start", "End"], reconcile="jump")
|
|
216
|
+
bars = {t["name"]: t for t in fig.data if t["legendgroup"] != "direction"}
|
|
217
|
+
assert _clean(bars["G2"]["y"]) == [5, 1, 6]
|
|
218
|
+
|
|
219
|
+
|
|
220
|
+
def test_sumtotal_uses_the_final_level(bridge):
|
|
221
|
+
fig = waterfall(bridge, x="X", y="Y", start="EBIT 2025", total=True, total_type="sumtotal")
|
|
222
|
+
total = next(t for t in fig.data if t["name"] == "Total")
|
|
223
|
+
assert list(total["y"]) == [104]
|
|
224
|
+
|
|
225
|
+
|
|
226
|
+
# --- validation ----------------------------------------------------------------------------
|
|
227
|
+
|
|
228
|
+
|
|
229
|
+
def test_invalid_measures(two_years):
|
|
230
|
+
with pytest.raises(ValueError, match="measure='kind' is not a column"):
|
|
231
|
+
waterfall(two_years, x="X", y="Y", measure="kind")
|
|
232
|
+
bad = two_years.assign(measure=two_years.measure.replace("absolute", "level"))
|
|
233
|
+
with pytest.raises(ValueError, match="measure values must be one of"):
|
|
234
|
+
waterfall(bad, x="X", y="Y", measure="measure")
|
|
235
|
+
mixed = pd.DataFrame(
|
|
236
|
+
{"X": ["A", "A"], "Y": [1, 2], "measure": ["absolute", "relative"], "c": ["c1", "c2"]}
|
|
237
|
+
)
|
|
238
|
+
with pytest.raises(ValueError, match="same measure"):
|
|
239
|
+
waterfall(mixed, x="X", y="Y", category="c", measure="measure")
|
|
240
|
+
with pytest.raises(ValueError, match="reconcile"):
|
|
241
|
+
Waterfall(two_years, x="X", y="Y", measure="measure", reconcile="ignore") # type: ignore[arg-type]
|
|
242
|
+
|
|
243
|
+
|
|
244
|
+
def test_missing_values_still_rejected_outside_total_rows(two_years):
|
|
245
|
+
two_years.loc[1, "Y"] = None
|
|
246
|
+
with pytest.raises(ValueError, match="missing values"):
|
|
247
|
+
waterfall(two_years, x="X", y="Y", measure="measure")
|
|
@@ -139,6 +139,14 @@ def test_dates_with_times_and_python_dates():
|
|
|
139
139
|
assert _ticks(waterfall(df, x="X", y="Y")) == ["Jan 2026", "Feb 2026"]
|
|
140
140
|
|
|
141
141
|
|
|
142
|
+
def test_dates_mixed_with_text_labels():
|
|
143
|
+
df = pd.DataFrame(
|
|
144
|
+
{"X": ["Opening", *pd.date_range("2026-01-31", periods=2, freq="ME")], "Y": [100, 5, -3]}
|
|
145
|
+
)
|
|
146
|
+
fig = waterfall(df, x="X", y="Y", start="Opening", total=True, total_column_name="Closing")
|
|
147
|
+
assert _ticks(fig) == ["Opening", "Jan 2026", "Feb 2026", "Closing"]
|
|
148
|
+
|
|
149
|
+
|
|
142
150
|
def test_x_format():
|
|
143
151
|
df = pd.DataFrame({"X": pd.date_range("2026-01-31", periods=2, freq="ME"), "Y": [1, 2]})
|
|
144
152
|
assert _ticks(waterfall(df, x="X", y="Y", x_format="%m/%y")) == ["01/26", "02/26"]
|
|
@@ -1 +0,0 @@
|
|
|
1
|
-
__version__ = "1.1.0"
|
|
File without changes
|
|
File without changes
|
|
File without changes
|
|
File without changes
|
|
File without changes
|
|
File without changes
|
|
File without changes
|
|
File without changes
|
|
File without changes
|
|
File without changes
|
|
File without changes
|
|
File without changes
|
|
File without changes
|
|
File without changes
|