plotlywaterfall 1.0.0__tar.gz → 1.2.0__tar.gz
This diff represents the content of publicly available package versions that have been released to one of the supported registries. The information contained in this diff is provided for informational purposes only and reflects changes between package versions as they appear in their respective public registries.
- {plotlywaterfall-1.0.0 → plotlywaterfall-1.2.0}/CHANGELOG.md +37 -0
- {plotlywaterfall-1.0.0 → plotlywaterfall-1.2.0}/PKG-INFO +34 -1
- {plotlywaterfall-1.0.0 → plotlywaterfall-1.2.0}/README.md +33 -0
- plotlywaterfall-1.2.0/src/plotlywaterfall/__about__.py +1 -0
- {plotlywaterfall-1.0.0 → plotlywaterfall-1.2.0}/src/plotlywaterfall/_coloring.py +9 -2
- plotlywaterfall-1.2.0/src/plotlywaterfall/_format.py +84 -0
- {plotlywaterfall-1.0.0 → plotlywaterfall-1.2.0}/src/plotlywaterfall/waterfall.py +339 -28
- plotlywaterfall-1.2.0/tests/test_measure.py +247 -0
- plotlywaterfall-1.2.0/tests/test_order_and_format.py +217 -0
- plotlywaterfall-1.0.0/src/plotlywaterfall/__about__.py +0 -1
- plotlywaterfall-1.0.0/src/plotlywaterfall/_format.py +0 -46
- {plotlywaterfall-1.0.0 → plotlywaterfall-1.2.0}/.gitignore +0 -0
- {plotlywaterfall-1.0.0 → plotlywaterfall-1.2.0}/LICENSE +0 -0
- {plotlywaterfall-1.0.0 → plotlywaterfall-1.2.0}/pyproject.toml +0 -0
- {plotlywaterfall-1.0.0 → plotlywaterfall-1.2.0}/src/plotlywaterfall/__init__.py +0 -0
- {plotlywaterfall-1.0.0 → plotlywaterfall-1.2.0}/src/plotlywaterfall/py.typed +0 -0
- {plotlywaterfall-1.0.0 → plotlywaterfall-1.2.0}/tests/test_basic.py +0 -0
- {plotlywaterfall-1.0.0 → plotlywaterfall-1.2.0}/tests/test_colors.py +0 -0
- {plotlywaterfall-1.0.0 → plotlywaterfall-1.2.0}/tests/test_function.py +0 -0
- {plotlywaterfall-1.0.0 → plotlywaterfall-1.2.0}/tests/test_labels.py +0 -0
- {plotlywaterfall-1.0.0 → plotlywaterfall-1.2.0}/tests/test_mixed_signs.py +0 -0
- {plotlywaterfall-1.0.0 → plotlywaterfall-1.2.0}/tests/test_readme.py +0 -0
- {plotlywaterfall-1.0.0 → plotlywaterfall-1.2.0}/tests/test_regressions.py +0 -0
|
@@ -2,6 +2,43 @@
|
|
|
2
2
|
|
|
3
3
|
## [Unreleased]
|
|
4
4
|
|
|
5
|
+
## [1.2.0] - 2026-11-05
|
|
6
|
+
|
|
7
|
+
### Added
|
|
8
|
+
- **Start and end levels for bridges**: `start="EBIT 2025"` marks x-values that hold a level, not a
|
|
9
|
+
change; they are drawn like totals (grey with direction colours, unsigned labels).
|
|
10
|
+
- **`measure` column** with plotly's `go.Waterfall` names: `"relative"` (change), `"absolute"`
|
|
11
|
+
(given level, e.g. budget or actual) and `"total"` (calculated level, value ignored). Works with
|
|
12
|
+
categories (stacked levels) and groups (each group its own levels).
|
|
13
|
+
- **`reconcile`** for given levels that the changes before them do not add up to: `"other"` (default)
|
|
14
|
+
inserts a bar for the difference (`reconcile_label`, default `"Other"`), `"jump"` draws the given
|
|
15
|
+
level, `"error"` raises `ValueError`.
|
|
16
|
+
- Example gallery: a new first part with finance examples (EBIT bridge, budget vs actual by segment,
|
|
17
|
+
monthly cash-flow walk, one bridge per region, from a ledger to a bridge) and sections on order,
|
|
18
|
+
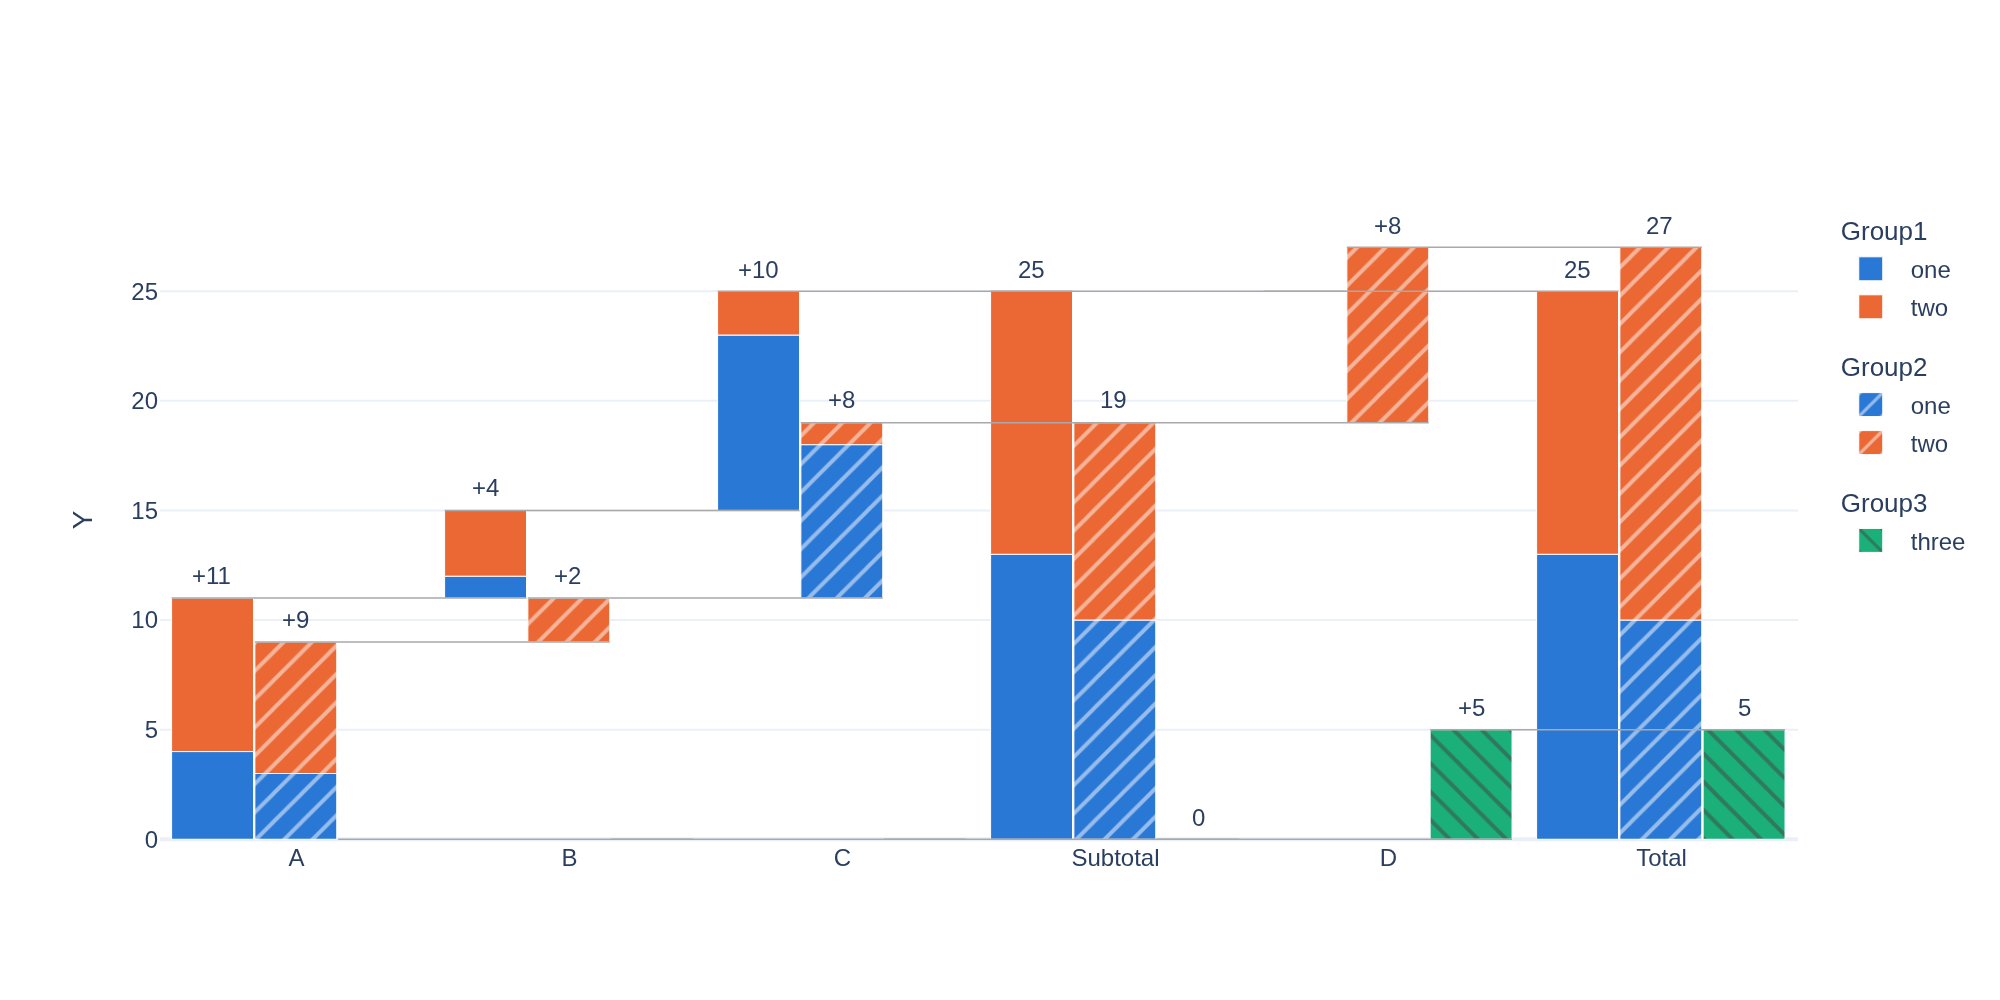
dates and export.
|
|
19
|
+
|
|
20
|
+
### Changed
|
|
21
|
+
- Hover text of totals without categories names the total (`Subtotal: 5`) instead of `Total: 5`.
|
|
22
|
+
- Dates mixed with text labels on the x-axis (e.g. `"Opening"` and month ends) are formatted one by one.
|
|
23
|
+
|
|
24
|
+
## [1.1.0] - 2026-11-05
|
|
25
|
+
|
|
26
|
+
### Fixed
|
|
27
|
+
- **Wrong levels with groups whose rows are in a different order**: running levels were accumulated
|
|
28
|
+
in each group's own row order instead of the x-axis order, so such a group's bars started at the
|
|
29
|
+
wrong height. They now always follow the x-axis.
|
|
30
|
+
- **Dates on the x-axis** were labelled `Timestamp('2026-01-31 00:00:00')`; they are now shown as
|
|
31
|
+
`Jan 2026` (dates in different months) or `2026-01-31`, in tick labels and hover.
|
|
32
|
+
- **The order of a pandas `Categorical` x column** was ignored; it now sets the order of the bars
|
|
33
|
+
(and of groups and categories).
|
|
34
|
+
|
|
35
|
+
### Added
|
|
36
|
+
- `category_orders` (as in plotly express) to set the order of x, group and category values;
|
|
37
|
+
the colour palette is assigned in that order.
|
|
38
|
+
- `x_format`: strftime pattern for date x-values or a function for any x-values.
|
|
39
|
+
- `number_unit` (`"k"`, `"M"`, `"bn"` or `"auto"` = one unit for the whole chart) and
|
|
40
|
+
`negative_style="parentheses"` for accounting-style labels such as `($0.73M)`.
|
|
41
|
+
|
|
5
42
|
## [1.0.0] - 2026-11-05
|
|
6
43
|
|
|
7
44
|
First stable release: a one-call `waterfall()` function, mixed signs within a bar, a plotly-express
|
|
@@ -1,6 +1,6 @@
|
|
|
1
1
|
Metadata-Version: 2.5
|
|
2
2
|
Name: plotlywaterfall
|
|
3
|
-
Version: 1.
|
|
3
|
+
Version: 1.2.0
|
|
4
4
|
Summary: Plotly-express-style waterfall charts with groups, stacked categories, subtotals and custom colors.
|
|
5
5
|
Project-URL: Homepage, https://github.com/docdru/plotlywaterfall
|
|
6
6
|
Project-URL: Source, https://github.com/docdru/plotlywaterfall
|
|
@@ -97,6 +97,30 @@ fig
|
|
|
97
97
|
|
|
98
98
|
|
|
99
99
|
|
|
100
|
+
### Bridges: start and end levels
|
|
101
|
+
|
|
102
|
+
A finance bridge goes from one level to another, e.g. from last year's EBIT to this year's.
|
|
103
|
+
`start` marks the x-value that holds a level instead of a change; it is drawn like a total:
|
|
104
|
+
|
|
105
|
+
```python
|
|
106
|
+
waterfall(df, x="item", y="MEUR", start="EBIT 2025", total=True, total_column_name="EBIT 2026")
|
|
107
|
+
```
|
|
108
|
+
|
|
109
|
+
When the data says what each row is, pass a `measure` column with plotly's names: `"relative"`
|
|
110
|
+
(a change, also for empty cells), `"absolute"` (a given level, e.g. budget or actual) or `"total"`
|
|
111
|
+
(a level calculated from the rows before; its value is ignored).
|
|
112
|
+
|
|
113
|
+
| X | Y | measure |
|
|
114
|
+
|---|---|---|
|
|
115
|
+
| Budget | 100 | absolute |
|
|
116
|
+
| Volume | 2 | relative |
|
|
117
|
+
| Costs | -3.5 | relative |
|
|
118
|
+
| Actual | 102 | absolute |
|
|
119
|
+
|
|
120
|
+
If the changes do not add up to a given level, `reconcile` decides: `"other"` (default) inserts a bar
|
|
121
|
+
for the difference, labelled `reconcile_label` (`"Other"`), so the walk adds up; `"jump"` draws the
|
|
122
|
+
given level as it is; `"error"` raises a `ValueError`.
|
|
123
|
+
|
|
100
124
|
### Labels, number format and hover
|
|
101
125
|
|
|
102
126
|
Every bar is labelled with its change (signed, e.g. `+9`) or, for totals, its value; hovering shows
|
|
@@ -107,12 +131,21 @@ the step, its category and the running total.
|
|
|
107
131
|
| `value_labels` | `"bar"` (one label per bar, outside), `"segment"` (inside each stacked segment), `"both"`, or `None` / `False` for no labels | `"bar"` |
|
|
108
132
|
| `number_format` | Python format spec for the absolute value (e.g. `",.1f"`) or a function | thousands separators, up to two decimals |
|
|
109
133
|
| `number_prefix` / `number_suffix` | Units around the number; the sign stays in front (`-$5M`) | `""` |
|
|
134
|
+
| `number_unit` | `"k"`, `"M"`, `"bn"` (e.g. 12500000 → `12.5M`), or `"auto"` for one unit chosen from the chart's largest value | `None` |
|
|
135
|
+
| `negative_style` | `"minus"` (`-7`, changes `+9`) or `"parentheses"` (accounting: `(7)`, changes unsigned) | `"minus"` |
|
|
110
136
|
| `title` | Figure title | `None` |
|
|
111
137
|
| `labels` | Display names for columns, like plotly express (`{"Y": "Cashflow [MUSD]"}`); titles the axes | y-axis titled with the y column |
|
|
138
|
+
| `category_orders` | Order of x, group or category values, like plotly express (`{"X": ["Revenue", "Costs"]}`) | order of a pandas `Categorical`, else of appearance |
|
|
139
|
+
| `x_format` | Labels of the x-values: a strftime pattern for dates (`"%b %Y"`) or a function | dates as `Jan 2026` (one per month) or `2026-01-31` |
|
|
112
140
|
|
|
113
141
|
waterfall(df, x="X", y="Y", total=True, number_prefix="$", number_suffix="M",
|
|
114
142
|
title="Cash bridge", labels={"Y": "Cashflow [MUSD]"})
|
|
115
143
|
|
|
144
|
+
For financial statements: one unit for all labels and accounting negatives,
|
|
145
|
+
|
|
146
|
+
waterfall(df, x="X", y="Y", total=True, number_unit="auto", negative_style="parentheses",
|
|
147
|
+
number_prefix="$") # $1.25M, ($0.73M), …
|
|
148
|
+
|
|
116
149
|
### Colors
|
|
117
150
|
|
|
118
151
|
Colours work like in plotly express:
|
|
@@ -65,6 +65,30 @@ fig
|
|
|
65
65
|
|
|
66
66
|

|
|
67
67
|
|
|
68
|
+
### Bridges: start and end levels
|
|
69
|
+
|
|
70
|
+
A finance bridge goes from one level to another, e.g. from last year's EBIT to this year's.
|
|
71
|
+
`start` marks the x-value that holds a level instead of a change; it is drawn like a total:
|
|
72
|
+
|
|
73
|
+
```python
|
|
74
|
+
waterfall(df, x="item", y="MEUR", start="EBIT 2025", total=True, total_column_name="EBIT 2026")
|
|
75
|
+
```
|
|
76
|
+
|
|
77
|
+
When the data says what each row is, pass a `measure` column with plotly's names: `"relative"`
|
|
78
|
+
(a change, also for empty cells), `"absolute"` (a given level, e.g. budget or actual) or `"total"`
|
|
79
|
+
(a level calculated from the rows before; its value is ignored).
|
|
80
|
+
|
|
81
|
+
| X | Y | measure |
|
|
82
|
+
|---|---|---|
|
|
83
|
+
| Budget | 100 | absolute |
|
|
84
|
+
| Volume | 2 | relative |
|
|
85
|
+
| Costs | -3.5 | relative |
|
|
86
|
+
| Actual | 102 | absolute |
|
|
87
|
+
|
|
88
|
+
If the changes do not add up to a given level, `reconcile` decides: `"other"` (default) inserts a bar
|
|
89
|
+
for the difference, labelled `reconcile_label` (`"Other"`), so the walk adds up; `"jump"` draws the
|
|
90
|
+
given level as it is; `"error"` raises a `ValueError`.
|
|
91
|
+
|
|
68
92
|
### Labels, number format and hover
|
|
69
93
|
|
|
70
94
|
Every bar is labelled with its change (signed, e.g. `+9`) or, for totals, its value; hovering shows
|
|
@@ -75,12 +99,21 @@ the step, its category and the running total.
|
|
|
75
99
|
| `value_labels` | `"bar"` (one label per bar, outside), `"segment"` (inside each stacked segment), `"both"`, or `None` / `False` for no labels | `"bar"` |
|
|
76
100
|
| `number_format` | Python format spec for the absolute value (e.g. `",.1f"`) or a function | thousands separators, up to two decimals |
|
|
77
101
|
| `number_prefix` / `number_suffix` | Units around the number; the sign stays in front (`-$5M`) | `""` |
|
|
102
|
+
| `number_unit` | `"k"`, `"M"`, `"bn"` (e.g. 12500000 → `12.5M`), or `"auto"` for one unit chosen from the chart's largest value | `None` |
|
|
103
|
+
| `negative_style` | `"minus"` (`-7`, changes `+9`) or `"parentheses"` (accounting: `(7)`, changes unsigned) | `"minus"` |
|
|
78
104
|
| `title` | Figure title | `None` |
|
|
79
105
|
| `labels` | Display names for columns, like plotly express (`{"Y": "Cashflow [MUSD]"}`); titles the axes | y-axis titled with the y column |
|
|
106
|
+
| `category_orders` | Order of x, group or category values, like plotly express (`{"X": ["Revenue", "Costs"]}`) | order of a pandas `Categorical`, else of appearance |
|
|
107
|
+
| `x_format` | Labels of the x-values: a strftime pattern for dates (`"%b %Y"`) or a function | dates as `Jan 2026` (one per month) or `2026-01-31` |
|
|
80
108
|
|
|
81
109
|
waterfall(df, x="X", y="Y", total=True, number_prefix="$", number_suffix="M",
|
|
82
110
|
title="Cash bridge", labels={"Y": "Cashflow [MUSD]"})
|
|
83
111
|
|
|
112
|
+
For financial statements: one unit for all labels and accounting negatives,
|
|
113
|
+
|
|
114
|
+
waterfall(df, x="X", y="Y", total=True, number_unit="auto", negative_style="parentheses",
|
|
115
|
+
number_prefix="$") # $1.25M, ($0.73M), …
|
|
116
|
+
|
|
84
117
|
### Colors
|
|
85
118
|
|
|
86
119
|
Colours work like in plotly express:
|
|
@@ -0,0 +1 @@
|
|
|
1
|
+
__version__ = "1.2.0"
|
|
@@ -50,6 +50,7 @@ class Coloring:
|
|
|
50
50
|
pattern_shape: str | None,
|
|
51
51
|
pattern_shape_map: dict | None,
|
|
52
52
|
total_name: str = "Total",
|
|
53
|
+
orders: dict[str, list] | None = None,
|
|
53
54
|
):
|
|
54
55
|
self._group = group
|
|
55
56
|
self._category = category
|
|
@@ -74,8 +75,14 @@ class Coloring:
|
|
|
74
75
|
)
|
|
75
76
|
self.pattern_shape = pattern_shape
|
|
76
77
|
|
|
77
|
-
|
|
78
|
-
|
|
78
|
+
# display order of the group / category values (palette colours are handed out in it)
|
|
79
|
+
orders = orders or {}
|
|
80
|
+
|
|
81
|
+
def values(column: str) -> list:
|
|
82
|
+
return list(orders[column]) if column in orders else list(df[column].unique())
|
|
83
|
+
|
|
84
|
+
self._color_values = [] if color == DIRECTION else values(color)
|
|
85
|
+
self._pattern_values = [] if pattern_shape is None else values(pattern_shape)
|
|
79
86
|
self._warn_unknown_keys(df)
|
|
80
87
|
|
|
81
88
|
# ------------------------------------------------------------------ validation
|
|
@@ -0,0 +1,84 @@
|
|
|
1
|
+
"""Number formatting shared by value labels and hover texts."""
|
|
2
|
+
|
|
3
|
+
from collections.abc import Callable, Iterable
|
|
4
|
+
from typing import Literal, get_args
|
|
5
|
+
|
|
6
|
+
NumberFormat = str | Callable[[float], str] | None
|
|
7
|
+
NegativeStyle = Literal["minus", "parentheses"]
|
|
8
|
+
NumberUnit = Literal["k", "M", "bn", "auto"]
|
|
9
|
+
|
|
10
|
+
NEGATIVE_STYLES: tuple[str, ...] = get_args(NegativeStyle)
|
|
11
|
+
NUMBER_UNITS: tuple[str, ...] = get_args(NumberUnit)
|
|
12
|
+
UNIT_DIVISORS = {"k": 1e3, "M": 1e6, "bn": 1e9}
|
|
13
|
+
|
|
14
|
+
|
|
15
|
+
def auto_unit(values: Iterable[float]) -> str | None:
|
|
16
|
+
"""The unit for a chart whose largest absolute value is max(|values|): one unit for all
|
|
17
|
+
labels, so that a chart never mixes "950k" and "1.2M"."""
|
|
18
|
+
largest = max((abs(v) for v in values), default=0.0)
|
|
19
|
+
for unit in ("bn", "M", "k"):
|
|
20
|
+
if largest >= UNIT_DIVISORS[unit]:
|
|
21
|
+
return unit
|
|
22
|
+
return None
|
|
23
|
+
|
|
24
|
+
|
|
25
|
+
class NumberFormatter:
|
|
26
|
+
"""Format numbers as `[sign][prefix]number[unit][suffix]`.
|
|
27
|
+
|
|
28
|
+
`number_format` is a Python format spec applied to the absolute value (e.g. ",.1f"), a
|
|
29
|
+
callable returning the text for the absolute value, or None for the default: thousands
|
|
30
|
+
separators and up to two decimals without trailing zeros (9, 0.5, 1,234.57).
|
|
31
|
+
The sign is written by the formatter itself, so that currency prefixes come out right
|
|
32
|
+
("-$5", not "$-5"); changes (steps) are always signed ("+9", "-7"), levels and totals only
|
|
33
|
+
when negative. With negative_style="parentheses" negatives are written as in accounting,
|
|
34
|
+
"(7)", and positive changes get no "+".
|
|
35
|
+
`unit` ("k", "M", "bn") divides values by thousand, million or billion and writes the unit
|
|
36
|
+
after the number ("12.5M").
|
|
37
|
+
"""
|
|
38
|
+
|
|
39
|
+
def __init__(
|
|
40
|
+
self,
|
|
41
|
+
number_format: NumberFormat = None,
|
|
42
|
+
prefix: str = "",
|
|
43
|
+
suffix: str = "",
|
|
44
|
+
negative_style: NegativeStyle = "minus",
|
|
45
|
+
unit: str | None = None,
|
|
46
|
+
):
|
|
47
|
+
if number_format is not None and not callable(number_format):
|
|
48
|
+
try:
|
|
49
|
+
format(1234.5, number_format)
|
|
50
|
+
except (ValueError, TypeError) as exc:
|
|
51
|
+
raise ValueError(f"Invalid number_format {number_format!r}: {exc}") from exc
|
|
52
|
+
if negative_style not in NEGATIVE_STYLES:
|
|
53
|
+
raise ValueError(
|
|
54
|
+
f"negative_style must be one of {NEGATIVE_STYLES}, got {negative_style!r}"
|
|
55
|
+
)
|
|
56
|
+
if unit is not None and unit not in UNIT_DIVISORS:
|
|
57
|
+
raise ValueError(f"unit must be one of {tuple(UNIT_DIVISORS)} or None, got {unit!r}")
|
|
58
|
+
self._format = number_format
|
|
59
|
+
self._prefix = prefix
|
|
60
|
+
self._suffix = suffix
|
|
61
|
+
self._negative_style = negative_style
|
|
62
|
+
self.unit = unit
|
|
63
|
+
|
|
64
|
+
def _body(self, value: float) -> str:
|
|
65
|
+
if self._format is None:
|
|
66
|
+
text = f"{value:,.2f}"
|
|
67
|
+
return text.rstrip("0").rstrip(".") if "." in text else text
|
|
68
|
+
if callable(self._format):
|
|
69
|
+
return self._format(value)
|
|
70
|
+
return format(value, self._format)
|
|
71
|
+
|
|
72
|
+
def __call__(self, value: float, signed: bool = False) -> str:
|
|
73
|
+
divisor = UNIT_DIVISORS[self.unit] if self.unit else 1.0
|
|
74
|
+
body = self._body(abs(value) / divisor)
|
|
75
|
+
is_zero = body.strip("0.,") == ""
|
|
76
|
+
number = f"{self._prefix}{body}{self.unit or ''}{self._suffix}"
|
|
77
|
+
negative = value < 0 and not is_zero
|
|
78
|
+
if self._negative_style == "parentheses":
|
|
79
|
+
return f"({number})" if negative else number
|
|
80
|
+
if negative:
|
|
81
|
+
return f"-{number}"
|
|
82
|
+
if signed and value > 0 and not is_zero:
|
|
83
|
+
return f"+{number}"
|
|
84
|
+
return number
|