plotlywaterfall 0.9.3__tar.gz → 1.0.0__tar.gz
This diff represents the content of publicly available package versions that have been released to one of the supported registries. The information contained in this diff is provided for informational purposes only and reflects changes between package versions as they appear in their respective public registries.
- plotlywaterfall-1.0.0/CHANGELOG.md +101 -0
- {plotlywaterfall-0.9.3 → plotlywaterfall-1.0.0}/LICENSE +3 -1
- plotlywaterfall-1.0.0/PKG-INFO +226 -0
- plotlywaterfall-1.0.0/README.md +194 -0
- plotlywaterfall-1.0.0/pyproject.toml +179 -0
- plotlywaterfall-1.0.0/src/plotlywaterfall/__about__.py +1 -0
- plotlywaterfall-1.0.0/src/plotlywaterfall/__init__.py +6 -0
- plotlywaterfall-1.0.0/src/plotlywaterfall/_coloring.py +197 -0
- plotlywaterfall-1.0.0/src/plotlywaterfall/_format.py +46 -0
- plotlywaterfall-1.0.0/src/plotlywaterfall/waterfall.py +657 -0
- plotlywaterfall-1.0.0/tests/test_basic.py +354 -0
- plotlywaterfall-1.0.0/tests/test_colors.py +266 -0
- plotlywaterfall-1.0.0/tests/test_function.py +69 -0
- plotlywaterfall-1.0.0/tests/test_labels.py +199 -0
- plotlywaterfall-1.0.0/tests/test_mixed_signs.py +200 -0
- plotlywaterfall-1.0.0/tests/test_readme.py +25 -0
- plotlywaterfall-1.0.0/tests/test_regressions.py +161 -0
- plotlywaterfall-0.9.3/CHANGELOG.md +0 -10
- plotlywaterfall-0.9.3/PKG-INFO +0 -85
- plotlywaterfall-0.9.3/README.md +0 -63
- plotlywaterfall-0.9.3/examples/example.png +0 -0
- plotlywaterfall-0.9.3/examples/example_df.png +0 -0
- plotlywaterfall-0.9.3/examples/examples.ipynb +0 -11381
- plotlywaterfall-0.9.3/pyproject.toml +0 -99
- plotlywaterfall-0.9.3/requirements.txt +0 -2
- plotlywaterfall-0.9.3/src/plotlywaterfall/__about__.py +0 -1
- plotlywaterfall-0.9.3/src/plotlywaterfall/waterfall.py +0 -211
- plotlywaterfall-0.9.3/tests/test_basic.py +0 -264
- {plotlywaterfall-0.9.3 → plotlywaterfall-1.0.0}/.gitignore +0 -0
- /plotlywaterfall-0.9.3/src/plotlywaterfall/__init__.py → /plotlywaterfall-1.0.0/src/plotlywaterfall/py.typed +0 -0
|
@@ -0,0 +1,101 @@
|
|
|
1
|
+
# Changelog
|
|
2
|
+
|
|
3
|
+
## [Unreleased]
|
|
4
|
+
|
|
5
|
+
## [1.0.0] - 2026-11-05
|
|
6
|
+
|
|
7
|
+
First stable release: a one-call `waterfall()` function, mixed signs within a bar, a plotly-express
|
|
8
|
+
style colour API, value labels and hover texts, type hints, and an
|
|
9
|
+
[example gallery](https://docdru.github.io/plotlywaterfall/).
|
|
10
|
+
|
|
11
|
+
### Upgrading from 0.9
|
|
12
|
+
- **`colors` was removed.** Use `color` and `color_discrete_map`:
|
|
13
|
+
|
|
14
|
+
| 0.9 `colors=` | 1.0 |
|
|
15
|
+
|---|---|
|
|
16
|
+
| `{"one": "red", "two": "blue"}` (per category) | `color_discrete_map={"one": "red", "two": "blue"}` |
|
|
17
|
+
| `{"Group1": "red", "Group2": "blue"}` (per group) | `color="group", color_discrete_map={"Group1": "red", "Group2": "blue"}` (with your group column name) |
|
|
18
|
+
| `{"Group1": {"one": "red"}}` (per group and category) | `color_discrete_map={("Group1", "one"): "red"}` |
|
|
19
|
+
|
|
20
|
+
- **Charts look different by default:** bars carry value labels (`value_labels=None` turns them
|
|
21
|
+
off), charts without category and group are coloured by direction (green / red / grey), a category
|
|
22
|
+
keeps its colour across groups, and the y-axis is titled with the y column.
|
|
23
|
+
- **Mixed signs within one bar are drawn** as sub-steps instead of raising `NotImplementedError`;
|
|
24
|
+
`mixed_signs="error"` restores the old behaviour.
|
|
25
|
+
- **Python 3.11 or newer** is required.
|
|
26
|
+
|
|
27
|
+
### Added
|
|
28
|
+
- **Type hints throughout** and a `py.typed` marker, so type checkers (mypy, pyright) use the
|
|
29
|
+
package's annotations.
|
|
30
|
+
- Options with a fixed set of values (`total_type`, `mixed_signs`, `step_order`, `value_labels`) are
|
|
31
|
+
typed as `Literal`s, so editors suggest the valid values and type checkers catch typos.
|
|
32
|
+
- **`waterfall(df, x=..., y=..., ...)`**: one call that returns the figure, like plotly express'
|
|
33
|
+
`px.bar`. Same arguments as `Waterfall` (keyword-only after `x` and `y`); `Waterfall` stays for
|
|
34
|
+
building subtotals step by step.
|
|
35
|
+
- **New colour API in plotly-express style**: `color` (category column, group column or
|
|
36
|
+
`"direction"`), `color_discrete_map` (value → colour; `(group, category)` tuples for one group's
|
|
37
|
+
category), `color_discrete_sequence`, `pattern_shape` and `pattern_shape_map`.
|
|
38
|
+
- `color="direction"` colours increases, decreases and totals (default green / red / grey) and adds
|
|
39
|
+
a legend for them.
|
|
40
|
+
- Keys of `color_discrete_map` / `pattern_shape_map` that match no value raise a `UserWarning`.
|
|
41
|
+
- **Value labels**: `value_labels` (`"bar"` default, `"segment"`, `"both"`, `None` / `False`), with one number
|
|
42
|
+
format for labels and hover: `number_format` (Python format spec or function), `number_prefix`,
|
|
43
|
+
`number_suffix`. Changes are signed (`+9`, `-7`), totals not.
|
|
44
|
+
- **Hover texts** show the x label, the segment's category and value, the step for split bars and the
|
|
45
|
+
running total (previously plotly's default hover showed the internal numeric x-position).
|
|
46
|
+
- `title` and `labels` (column display names, as in plotly express) arguments.
|
|
47
|
+
- **Mixed signs within one bar**: categories of one bar (at an x-value or in a total) may now have
|
|
48
|
+
different signs. The bar is split into narrow sub-steps that walk from its start to its end level,
|
|
49
|
+
with a "net ghost" bar behind them showing the net change. New arguments `mixed_signs`
|
|
50
|
+
(`"steps"` default, `"error"` for the previous behaviour), `net_ghost` and `step_order`.
|
|
51
|
+
|
|
52
|
+
### Changed
|
|
53
|
+
- `import plotlywaterfall.waterfall as m` now gives the `waterfall` function (the package exports it under
|
|
54
|
+
that name). `from plotlywaterfall.waterfall import Waterfall` keeps working.
|
|
55
|
+
- **Value labels are shown by default** (`value_labels=None` restores unlabelled bars) and the y-axis is
|
|
56
|
+
titled with the y column name (or its `labels` entry). The axis range leaves room for the labels.
|
|
57
|
+
- **Minimum Python is now 3.11** (3.8–3.10 are end-of-life; the code never ran on 3.8/3.9).
|
|
58
|
+
- `numpy` is now declared as a dependency (it was imported but not declared); dependencies are declared in
|
|
59
|
+
`pyproject.toml` and `requirements.txt` was removed.
|
|
60
|
+
- **Default colours**: charts without category and group are coloured by direction. Charts with
|
|
61
|
+
categories or groups get one colour per category (or group) taken from the template's colorway,
|
|
62
|
+
so a category has the same colour in every group (previously plotly cycled colours per trace).
|
|
63
|
+
- Clear `ValueError`s for invalid input: unknown column names, missing values (NaN) in `y`,
|
|
64
|
+
unknown `total_type`, and subtotal keys that are not x-values (now also checked in the constructor).
|
|
65
|
+
- `Waterfall` can be imported directly: `from plotlywaterfall import Waterfall`
|
|
66
|
+
(`from plotlywaterfall.waterfall import Waterfall` keeps working); `plotlywaterfall.__version__` added.
|
|
67
|
+
- Internal cleanup: removed dead code in `add_subtotal`, one helper for bar offsets and one for colors.
|
|
68
|
+
|
|
69
|
+
### Removed
|
|
70
|
+
- The `colors` argument, replaced by `color` / `color_discrete_map` (see "Upgrading from 0.9").
|
|
71
|
+
|
|
72
|
+
### Fixed
|
|
73
|
+
- `total_type="sumtotal"` with groups raised `KeyError: 'Y'` unless the value column was named `Y`.
|
|
74
|
+
- Groups with opposite signs at the same x-value (or opposite-signed totals) raised
|
|
75
|
+
"mixed signed categories in totals"; the sign check now only compares stacked bars within one group.
|
|
76
|
+
- The `subtotals` dict passed by the caller is no longer modified (with `total=True` it used to gain
|
|
77
|
+
the total, which added an extra bar when the dict was reused).
|
|
78
|
+
- The `connector_line` default is no longer a dict shared between instances.
|
|
79
|
+
|
|
80
|
+
### Development
|
|
81
|
+
- mypy runs with `disallow_untyped_defs` and `disallow_incomplete_defs`; CI checks that the wheel
|
|
82
|
+
contains `py.typed`.
|
|
83
|
+
- Example gallery: CI executes the example notebook and publishes it as HTML with interactive charts on
|
|
84
|
+
GitHub Pages (pull requests: `docs-site` artifact); the README image is rendered by CI as well.
|
|
85
|
+
- Modern development setup: uv with `uv.lock`, PEP 735 dependency groups, ruff (lint + format), mypy, pre-commit.
|
|
86
|
+
- GitHub Actions CI: lint, type check, tests on Python 3.11–3.15 (Linux/Windows/macOS), lowest-dependency and
|
|
87
|
+
pre-release dependency jobs, example-notebook execution, package build; weekly scheduled run.
|
|
88
|
+
- Automated PyPI releases on version tags via Trusted Publishing with attestations; Dependabot for actions and dependencies.
|
|
89
|
+
- Automated AI pull-request review (Mistral) posted as a PR comment; see README "AI pull-request review".
|
|
90
|
+
|
|
91
|
+
## [0.9.3] - 2024-02-20
|
|
92
|
+
- Bugfix legend groups
|
|
93
|
+
|
|
94
|
+
## [0.9.2] - 2024-02-20
|
|
95
|
+
- Bugfix line placement in case of empty bars at certain x in other then the first group
|
|
96
|
+
|
|
97
|
+
## [0.9.1] - 2024-01-04
|
|
98
|
+
- Added CHANGELOG.md and using full URLs for images in README.md
|
|
99
|
+
|
|
100
|
+
## [0.9.0] - 2024-01-04
|
|
101
|
+
- Initial release on pypi.org
|
|
@@ -0,0 +1,226 @@
|
|
|
1
|
+
Metadata-Version: 2.5
|
|
2
|
+
Name: plotlywaterfall
|
|
3
|
+
Version: 1.0.0
|
|
4
|
+
Summary: Plotly-express-style waterfall charts with groups, stacked categories, subtotals and custom colors.
|
|
5
|
+
Project-URL: Homepage, https://github.com/docdru/plotlywaterfall
|
|
6
|
+
Project-URL: Source, https://github.com/docdru/plotlywaterfall
|
|
7
|
+
Project-URL: Issues, https://github.com/docdru/plotlywaterfall/issues
|
|
8
|
+
Project-URL: Changelog, https://github.com/docdru/plotlywaterfall/blob/main/CHANGELOG.md
|
|
9
|
+
Author-email: Daniel Rüffer <docdru.plotlywaterfall@gmail.com>
|
|
10
|
+
License-Expression: MIT
|
|
11
|
+
License-File: LICENSE
|
|
12
|
+
Keywords: cashflow,chart,finance,jupyter,plotly,visualization,waterfall
|
|
13
|
+
Classifier: Development Status :: 5 - Production/Stable
|
|
14
|
+
Classifier: Framework :: Jupyter
|
|
15
|
+
Classifier: Intended Audience :: Financial and Insurance Industry
|
|
16
|
+
Classifier: Intended Audience :: Science/Research
|
|
17
|
+
Classifier: Programming Language :: Python
|
|
18
|
+
Classifier: Programming Language :: Python :: 3
|
|
19
|
+
Classifier: Programming Language :: Python :: 3 :: Only
|
|
20
|
+
Classifier: Programming Language :: Python :: 3.11
|
|
21
|
+
Classifier: Programming Language :: Python :: 3.12
|
|
22
|
+
Classifier: Programming Language :: Python :: 3.13
|
|
23
|
+
Classifier: Programming Language :: Python :: 3.14
|
|
24
|
+
Classifier: Programming Language :: Python :: 3.15
|
|
25
|
+
Classifier: Programming Language :: Python :: Implementation :: CPython
|
|
26
|
+
Classifier: Topic :: Scientific/Engineering :: Visualization
|
|
27
|
+
Requires-Python: >=3.11
|
|
28
|
+
Requires-Dist: numpy>=1.26
|
|
29
|
+
Requires-Dist: pandas>=2.2
|
|
30
|
+
Requires-Dist: plotly>=5.24
|
|
31
|
+
Description-Content-Type: text/markdown
|
|
32
|
+
|
|
33
|
+
# plotlywaterfall
|
|
34
|
+
|
|
35
|
+
[](https://github.com/docdru/plotlywaterfall/actions/workflows/ci.yml)
|
|
36
|
+
[](https://pypi.org/project/plotlywaterfall/)
|
|
37
|
+
[](https://pypi.org/project/plotlywaterfall/)
|
|
38
|
+
[](https://github.com/astral-sh/uv)
|
|
39
|
+
[](https://github.com/astral-sh/ruff)
|
|
40
|
+
[](https://docdru.github.io/plotlywaterfall/)
|
|
41
|
+
|
|
42
|
+
## Description
|
|
43
|
+
|
|
44
|
+
A small package adding simple waterfall plotting capabilities on top of the plotly graphing package. Waterfall graphs are useful to display e.g. financial data such as cashflow statements in an easily digestible format.
|
|
45
|
+
|
|
46
|
+
While plotly includes basic capabilities to plot waterfall graphs, it ships only limited features. The *plotlywaterfall* package provides simple, plotly-express-style waterfall graphs with grouping, multiple stacked categories and variable colors.
|
|
47
|
+
|
|
48
|
+
## Installation
|
|
49
|
+
|
|
50
|
+
Requires Python 3.11 or newer.
|
|
51
|
+
|
|
52
|
+
```bash
|
|
53
|
+
pip install plotlywaterfall
|
|
54
|
+
# or
|
|
55
|
+
uv add plotlywaterfall
|
|
56
|
+
```
|
|
57
|
+
|
|
58
|
+
## Usage
|
|
59
|
+
|
|
60
|
+
**[Example gallery](https://docdru.github.io/plotlywaterfall/)** with interactive charts for every feature (rendered from
|
|
61
|
+
[`examples/examples.ipynb`](https://github.com/docdru/plotlywaterfall/blob/main/examples/examples.ipynb) by CI).
|
|
62
|
+
|
|
63
|
+
`waterfall(df, x=..., y=..., ...)` returns a plotly figure, like plotly express' `px.bar`. The class
|
|
64
|
+
`Waterfall` takes the same arguments (`Waterfall(...).get_fig()`) and also lets you add subtotals step by
|
|
65
|
+
step with `add_subtotal`.
|
|
66
|
+
|
|
67
|
+
A complete example with groups, stacked categories, a subtotal and a total:
|
|
68
|
+
|
|
69
|
+
```python
|
|
70
|
+
import pandas as pd
|
|
71
|
+
|
|
72
|
+
from plotlywaterfall import waterfall
|
|
73
|
+
|
|
74
|
+
df = pd.DataFrame(
|
|
75
|
+
{
|
|
76
|
+
"X": ["A", "B", "C"] * 4 + ["D", "D"],
|
|
77
|
+
"Y": [4, 1, 8, 7, 3, 2] + [i - 1 for i in [4, 1, 8, 7, 3, 2]] + [8, 5],
|
|
78
|
+
"category": ["one"] * 3 + ["two"] * 3 + ["one"] * 3 + ["two"] * 3 + ["two", "three"],
|
|
79
|
+
"group": ["Group1"] * 6 + ["Group2"] * 6 + ["Group2", "Group3"],
|
|
80
|
+
}
|
|
81
|
+
)
|
|
82
|
+
|
|
83
|
+
fig = waterfall(
|
|
84
|
+
df,
|
|
85
|
+
x="X",
|
|
86
|
+
y="Y",
|
|
87
|
+
category="category",
|
|
88
|
+
group="group",
|
|
89
|
+
total=True,
|
|
90
|
+
subtotals={"C": "Subtotal"},
|
|
91
|
+
color_discrete_map={"one": "#2a78d6", "two": "#eb6834", "three": "#1baf7a"},
|
|
92
|
+
pattern_shape="group",
|
|
93
|
+
)
|
|
94
|
+
fig.update_layout(template="plotly_white")
|
|
95
|
+
fig
|
|
96
|
+
```
|
|
97
|
+
|
|
98
|
+
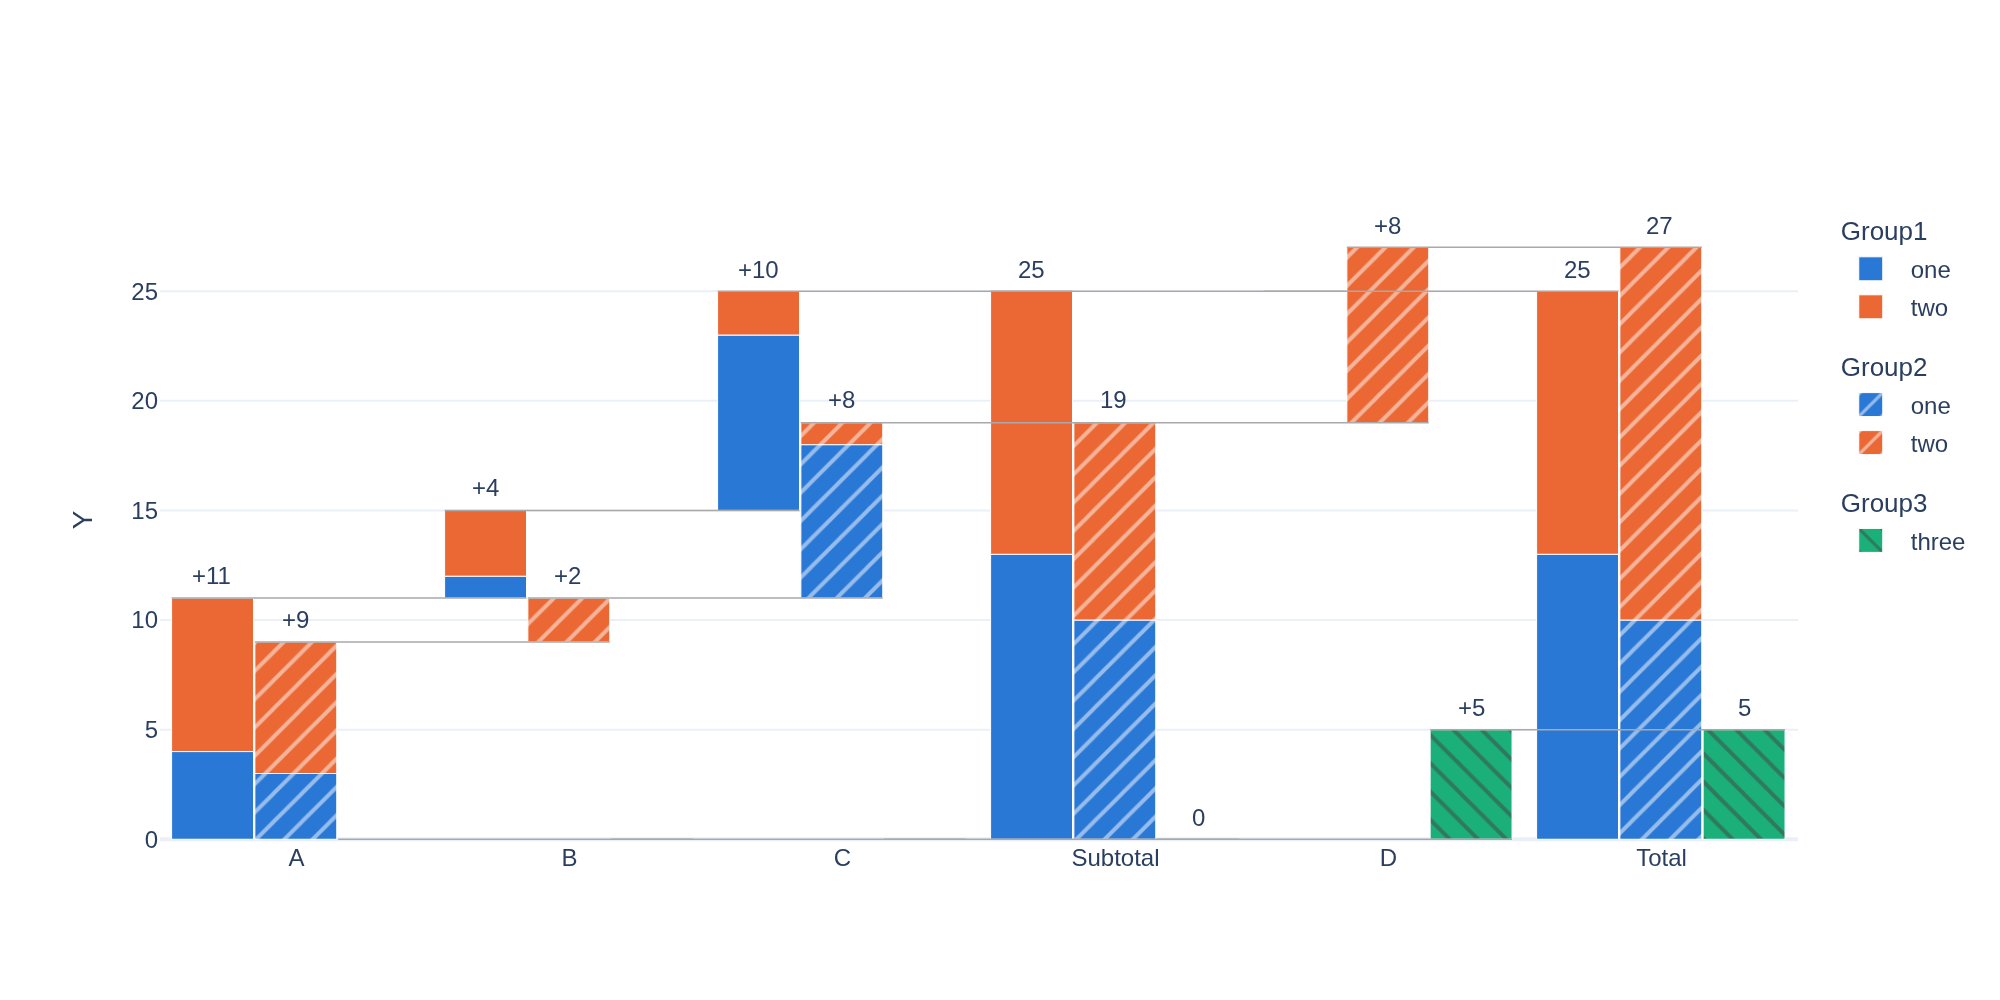
|
|
99
|
+
|
|
100
|
+
### Labels, number format and hover
|
|
101
|
+
|
|
102
|
+
Every bar is labelled with its change (signed, e.g. `+9`) or, for totals, its value; hovering shows
|
|
103
|
+
the step, its category and the running total.
|
|
104
|
+
|
|
105
|
+
| Argument | Meaning | Default |
|
|
106
|
+
|---|---|---|
|
|
107
|
+
| `value_labels` | `"bar"` (one label per bar, outside), `"segment"` (inside each stacked segment), `"both"`, or `None` / `False` for no labels | `"bar"` |
|
|
108
|
+
| `number_format` | Python format spec for the absolute value (e.g. `",.1f"`) or a function | thousands separators, up to two decimals |
|
|
109
|
+
| `number_prefix` / `number_suffix` | Units around the number; the sign stays in front (`-$5M`) | `""` |
|
|
110
|
+
| `title` | Figure title | `None` |
|
|
111
|
+
| `labels` | Display names for columns, like plotly express (`{"Y": "Cashflow [MUSD]"}`); titles the axes | y-axis titled with the y column |
|
|
112
|
+
|
|
113
|
+
waterfall(df, x="X", y="Y", total=True, number_prefix="$", number_suffix="M",
|
|
114
|
+
title="Cash bridge", labels={"Y": "Cashflow [MUSD]"})
|
|
115
|
+
|
|
116
|
+
### Colors
|
|
117
|
+
|
|
118
|
+
Colours work like in plotly express:
|
|
119
|
+
|
|
120
|
+
| Argument | Meaning |
|
|
121
|
+
|---|---|
|
|
122
|
+
| `color` | What drives the colour: the category column, the group column, or `"direction"` (increase / decrease / total). Default: the category column if given, else the group column, else `"direction"`. |
|
|
123
|
+
| `color_discrete_map` | Colour per value, e.g. `{"one": "red"}`. `(group, category)` tuples colour one group's category. With `color="direction"` the keys are `"increase"`, `"decrease"`, `"total"` (default green / red / grey). Keys that match no value raise a warning. |
|
|
124
|
+
| `color_discrete_sequence` | Colours for values missing from the map, assigned in order. Default: the colorway of the active plotly template. |
|
|
125
|
+
| `pattern_shape` | The group or category column, to give its values different fill patterns, e.g. colour by category and pattern by group. |
|
|
126
|
+
| `pattern_shape_map` | Pattern per value, e.g. `{"Actual": "/"}`. |
|
|
127
|
+
|
|
128
|
+
Colours are assigned per value, so a category has the same colour in every group:
|
|
129
|
+
|
|
130
|
+
waterfall(df, x="X", y="Y", category="category", group="group", total=True,
|
|
131
|
+
pattern_shape="group")
|
|
132
|
+
|
|
133
|
+
Coming from version 0.9? The `colors` argument was replaced by `color` / `color_discrete_map`; see
|
|
134
|
+
[Upgrading from 0.9](https://github.com/docdru/plotlywaterfall/blob/main/CHANGELOG.md#upgrading-from-09).
|
|
135
|
+
|
|
136
|
+
### Mixed signs
|
|
137
|
+
|
|
138
|
+
Categories of one bar may have different signs, e.g. a subsidy (+1) and a restructuring charge (−4)
|
|
139
|
+
at the same x-value, or a total that combines positive and negative categories. Such a bar is split
|
|
140
|
+
into one narrow sub-step per category that walks from the level where the bar starts to where it
|
|
141
|
+
ends, with a light "net ghost" bar behind it showing the net change:
|
|
142
|
+
|
|
143
|
+
df = pd.DataFrame({
|
|
144
|
+
"X": ["Revenue", "Costs", "Other", "Other"],
|
|
145
|
+
"Y": [9, -7, 1, -4],
|
|
146
|
+
"category": ["Operating", "Operating", "Operating", "One-off"],
|
|
147
|
+
})
|
|
148
|
+
waterfall(df, x="X", y="Y", category="category", total=True)
|
|
149
|
+
|
|
150
|
+
Options:
|
|
151
|
+
|
|
152
|
+
| Argument | Values | Default |
|
|
153
|
+
|---|---|---|
|
|
154
|
+
| `mixed_signs` | `"steps"` (split into sub-steps), `"error"` (raise `NotImplementedError`, the behaviour before 1.0) | `"steps"` |
|
|
155
|
+
| `net_ghost` | `True`, `False`, or a dict of plotly marker properties for the net bar | `True` |
|
|
156
|
+
| `step_order` | `"data"` (order of the categories in the DataFrame), `"positive_first"`, `"largest_first"` | `"data"` |
|
|
157
|
+
|
|
158
|
+
Bars whose categories share a sign are drawn as normal stacked bars. With several groups each group's
|
|
159
|
+
bar walks on its own; with many groups and categories the sub-steps get narrow, so increase `barwidth`.
|
|
160
|
+
|
|
161
|
+
|
|
162
|
+
## Disclaimer
|
|
163
|
+
|
|
164
|
+
I might maintain and improve the package. I might also not.
|
|
165
|
+
|
|
166
|
+
|
|
167
|
+
## Development
|
|
168
|
+
|
|
169
|
+
The project uses [uv](https://docs.astral.sh/uv/) for environments and dependency locking.
|
|
170
|
+
|
|
171
|
+
```bash
|
|
172
|
+
git clone https://github.com/docdru/plotlywaterfall.git
|
|
173
|
+
cd plotlywaterfall
|
|
174
|
+
uv sync # creates .venv with the package + all dev tools
|
|
175
|
+
uv run pre-commit install # optional: run checks on every commit
|
|
176
|
+
```
|
|
177
|
+
|
|
178
|
+
Common tasks:
|
|
179
|
+
|
|
180
|
+
| Task | Command |
|
|
181
|
+
|---|---|
|
|
182
|
+
| Run tests | `uv run pytest` |
|
|
183
|
+
| Tests with coverage | `uv run pytest --cov` |
|
|
184
|
+
| Test another Python | `uv run --python 3.11 pytest` |
|
|
185
|
+
| Lint / auto-fix | `uv run ruff check --fix` |
|
|
186
|
+
| Format | `uv run ruff format` |
|
|
187
|
+
| Type check | `uv run mypy` |
|
|
188
|
+
| Execute example notebook | `uv run pytest --nbmake examples/ -p no:warnings` |
|
|
189
|
+
| Build the docs site (gallery + README image) | `uv run --group notebook --with nbconvert --with kaleido python scripts/build_docs.py --out site` |
|
|
190
|
+
| Open notebooks | `uv run --with jupyterlab jupyter lab` |
|
|
191
|
+
| Build sdist + wheel | `uv build` |
|
|
192
|
+
|
|
193
|
+
CI (GitHub Actions) runs lint, type checks, the test suite on Python 3.11–3.15 (Linux, plus Windows; macOS on `main` and the weekly run),
|
|
194
|
+
a test against the lowest supported dependency versions, the docs site, and a package build.
|
|
195
|
+
|
|
196
|
+
The **docs site** job executes `examples/examples.ipynb`, renders it to HTML with interactive charts and
|
|
197
|
+
renders the README image from `examples/readme_example.py` (keep it in sync with the README code).
|
|
198
|
+
Pull requests get the result as the `docs-site` artifact of the CI run; on `main` it is published to
|
|
199
|
+
[GitHub Pages](https://docdru.github.io/plotlywaterfall/). Nothing generated is committed. One-time setup: *Settings → Pages →
|
|
200
|
+
Build and deployment → Source: GitHub Actions*.
|
|
201
|
+
|
|
202
|
+
### AI pull-request review
|
|
203
|
+
|
|
204
|
+
Pull requests get an automated review comment (correctness and tests, API/docs consistency,
|
|
205
|
+
security and supply chain, surprising changes) from `.github/workflows/ai-review.yml`, which runs
|
|
206
|
+
`scripts/ai_review.py` against the Mistral API. The comment is updated on every push.
|
|
207
|
+
|
|
208
|
+
- **Setup:** add the repository secret `MISTRAL_API_KEY` (*Settings → Secrets and variables → Actions*).
|
|
209
|
+
Optionally set the repository variable `AI_REVIEW_MODEL` to override the default model (`mistral-large-2512`).
|
|
210
|
+
- **Scope:** runs for non-draft PRs from branches in this repository by authors with write access;
|
|
211
|
+
fork, bot and draft PRs are skipped. Mark a draft "Ready for review" to trigger it.
|
|
212
|
+
- **Try locally** (prints the prompt, calls nothing, posts nothing):
|
|
213
|
+
`GITHUB_REPOSITORY=docdru/plotlywaterfall GITHUB_TOKEN=$(gh auth token) python scripts/ai_review.py --pr 1 --dry-run`
|
|
214
|
+
|
|
215
|
+
The review is advisory: it is not part of the required checks, and its findings should be verified.
|
|
216
|
+
|
|
217
|
+
### Releasing
|
|
218
|
+
|
|
219
|
+
1. Bump `__version__` in `src/plotlywaterfall/__about__.py` and add a `CHANGELOG.md` entry.
|
|
220
|
+
2. Commit, then tag and push: `git tag v0.9.4 && git push origin v0.9.4`.
|
|
221
|
+
3. The `Release` workflow builds the package and publishes it to PyPI via
|
|
222
|
+
[Trusted Publishing](https://docs.pypi.org/trusted-publishers/) (no API token needed).
|
|
223
|
+
|
|
224
|
+
## Changelog
|
|
225
|
+
|
|
226
|
+
Refer to [CHANGELOG.md](https://github.com/docdru/plotlywaterfall/blob/main/CHANGELOG.md)
|
|
@@ -0,0 +1,194 @@
|
|
|
1
|
+
# plotlywaterfall
|
|
2
|
+
|
|
3
|
+
[](https://github.com/docdru/plotlywaterfall/actions/workflows/ci.yml)
|
|
4
|
+
[](https://pypi.org/project/plotlywaterfall/)
|
|
5
|
+
[](https://pypi.org/project/plotlywaterfall/)
|
|
6
|
+
[](https://github.com/astral-sh/uv)
|
|
7
|
+
[](https://github.com/astral-sh/ruff)
|
|
8
|
+
[](https://docdru.github.io/plotlywaterfall/)
|
|
9
|
+
|
|
10
|
+
## Description
|
|
11
|
+
|
|
12
|
+
A small package adding simple waterfall plotting capabilities on top of the plotly graphing package. Waterfall graphs are useful to display e.g. financial data such as cashflow statements in an easily digestible format.
|
|
13
|
+
|
|
14
|
+
While plotly includes basic capabilities to plot waterfall graphs, it ships only limited features. The *plotlywaterfall* package provides simple, plotly-express-style waterfall graphs with grouping, multiple stacked categories and variable colors.
|
|
15
|
+
|
|
16
|
+
## Installation
|
|
17
|
+
|
|
18
|
+
Requires Python 3.11 or newer.
|
|
19
|
+
|
|
20
|
+
```bash
|
|
21
|
+
pip install plotlywaterfall
|
|
22
|
+
# or
|
|
23
|
+
uv add plotlywaterfall
|
|
24
|
+
```
|
|
25
|
+
|
|
26
|
+
## Usage
|
|
27
|
+
|
|
28
|
+
**[Example gallery](https://docdru.github.io/plotlywaterfall/)** with interactive charts for every feature (rendered from
|
|
29
|
+
[`examples/examples.ipynb`](https://github.com/docdru/plotlywaterfall/blob/main/examples/examples.ipynb) by CI).
|
|
30
|
+
|
|
31
|
+
`waterfall(df, x=..., y=..., ...)` returns a plotly figure, like plotly express' `px.bar`. The class
|
|
32
|
+
`Waterfall` takes the same arguments (`Waterfall(...).get_fig()`) and also lets you add subtotals step by
|
|
33
|
+
step with `add_subtotal`.
|
|
34
|
+
|
|
35
|
+
A complete example with groups, stacked categories, a subtotal and a total:
|
|
36
|
+
|
|
37
|
+
```python
|
|
38
|
+
import pandas as pd
|
|
39
|
+
|
|
40
|
+
from plotlywaterfall import waterfall
|
|
41
|
+
|
|
42
|
+
df = pd.DataFrame(
|
|
43
|
+
{
|
|
44
|
+
"X": ["A", "B", "C"] * 4 + ["D", "D"],
|
|
45
|
+
"Y": [4, 1, 8, 7, 3, 2] + [i - 1 for i in [4, 1, 8, 7, 3, 2]] + [8, 5],
|
|
46
|
+
"category": ["one"] * 3 + ["two"] * 3 + ["one"] * 3 + ["two"] * 3 + ["two", "three"],
|
|
47
|
+
"group": ["Group1"] * 6 + ["Group2"] * 6 + ["Group2", "Group3"],
|
|
48
|
+
}
|
|
49
|
+
)
|
|
50
|
+
|
|
51
|
+
fig = waterfall(
|
|
52
|
+
df,
|
|
53
|
+
x="X",
|
|
54
|
+
y="Y",
|
|
55
|
+
category="category",
|
|
56
|
+
group="group",
|
|
57
|
+
total=True,
|
|
58
|
+
subtotals={"C": "Subtotal"},
|
|
59
|
+
color_discrete_map={"one": "#2a78d6", "two": "#eb6834", "three": "#1baf7a"},
|
|
60
|
+
pattern_shape="group",
|
|
61
|
+
)
|
|
62
|
+
fig.update_layout(template="plotly_white")
|
|
63
|
+
fig
|
|
64
|
+
```
|
|
65
|
+
|
|
66
|
+

|
|
67
|
+
|
|
68
|
+
### Labels, number format and hover
|
|
69
|
+
|
|
70
|
+
Every bar is labelled with its change (signed, e.g. `+9`) or, for totals, its value; hovering shows
|
|
71
|
+
the step, its category and the running total.
|
|
72
|
+
|
|
73
|
+
| Argument | Meaning | Default |
|
|
74
|
+
|---|---|---|
|
|
75
|
+
| `value_labels` | `"bar"` (one label per bar, outside), `"segment"` (inside each stacked segment), `"both"`, or `None` / `False` for no labels | `"bar"` |
|
|
76
|
+
| `number_format` | Python format spec for the absolute value (e.g. `",.1f"`) or a function | thousands separators, up to two decimals |
|
|
77
|
+
| `number_prefix` / `number_suffix` | Units around the number; the sign stays in front (`-$5M`) | `""` |
|
|
78
|
+
| `title` | Figure title | `None` |
|
|
79
|
+
| `labels` | Display names for columns, like plotly express (`{"Y": "Cashflow [MUSD]"}`); titles the axes | y-axis titled with the y column |
|
|
80
|
+
|
|
81
|
+
waterfall(df, x="X", y="Y", total=True, number_prefix="$", number_suffix="M",
|
|
82
|
+
title="Cash bridge", labels={"Y": "Cashflow [MUSD]"})
|
|
83
|
+
|
|
84
|
+
### Colors
|
|
85
|
+
|
|
86
|
+
Colours work like in plotly express:
|
|
87
|
+
|
|
88
|
+
| Argument | Meaning |
|
|
89
|
+
|---|---|
|
|
90
|
+
| `color` | What drives the colour: the category column, the group column, or `"direction"` (increase / decrease / total). Default: the category column if given, else the group column, else `"direction"`. |
|
|
91
|
+
| `color_discrete_map` | Colour per value, e.g. `{"one": "red"}`. `(group, category)` tuples colour one group's category. With `color="direction"` the keys are `"increase"`, `"decrease"`, `"total"` (default green / red / grey). Keys that match no value raise a warning. |
|
|
92
|
+
| `color_discrete_sequence` | Colours for values missing from the map, assigned in order. Default: the colorway of the active plotly template. |
|
|
93
|
+
| `pattern_shape` | The group or category column, to give its values different fill patterns, e.g. colour by category and pattern by group. |
|
|
94
|
+
| `pattern_shape_map` | Pattern per value, e.g. `{"Actual": "/"}`. |
|
|
95
|
+
|
|
96
|
+
Colours are assigned per value, so a category has the same colour in every group:
|
|
97
|
+
|
|
98
|
+
waterfall(df, x="X", y="Y", category="category", group="group", total=True,
|
|
99
|
+
pattern_shape="group")
|
|
100
|
+
|
|
101
|
+
Coming from version 0.9? The `colors` argument was replaced by `color` / `color_discrete_map`; see
|
|
102
|
+
[Upgrading from 0.9](https://github.com/docdru/plotlywaterfall/blob/main/CHANGELOG.md#upgrading-from-09).
|
|
103
|
+
|
|
104
|
+
### Mixed signs
|
|
105
|
+
|
|
106
|
+
Categories of one bar may have different signs, e.g. a subsidy (+1) and a restructuring charge (−4)
|
|
107
|
+
at the same x-value, or a total that combines positive and negative categories. Such a bar is split
|
|
108
|
+
into one narrow sub-step per category that walks from the level where the bar starts to where it
|
|
109
|
+
ends, with a light "net ghost" bar behind it showing the net change:
|
|
110
|
+
|
|
111
|
+
df = pd.DataFrame({
|
|
112
|
+
"X": ["Revenue", "Costs", "Other", "Other"],
|
|
113
|
+
"Y": [9, -7, 1, -4],
|
|
114
|
+
"category": ["Operating", "Operating", "Operating", "One-off"],
|
|
115
|
+
})
|
|
116
|
+
waterfall(df, x="X", y="Y", category="category", total=True)
|
|
117
|
+
|
|
118
|
+
Options:
|
|
119
|
+
|
|
120
|
+
| Argument | Values | Default |
|
|
121
|
+
|---|---|---|
|
|
122
|
+
| `mixed_signs` | `"steps"` (split into sub-steps), `"error"` (raise `NotImplementedError`, the behaviour before 1.0) | `"steps"` |
|
|
123
|
+
| `net_ghost` | `True`, `False`, or a dict of plotly marker properties for the net bar | `True` |
|
|
124
|
+
| `step_order` | `"data"` (order of the categories in the DataFrame), `"positive_first"`, `"largest_first"` | `"data"` |
|
|
125
|
+
|
|
126
|
+
Bars whose categories share a sign are drawn as normal stacked bars. With several groups each group's
|
|
127
|
+
bar walks on its own; with many groups and categories the sub-steps get narrow, so increase `barwidth`.
|
|
128
|
+
|
|
129
|
+
|
|
130
|
+
## Disclaimer
|
|
131
|
+
|
|
132
|
+
I might maintain and improve the package. I might also not.
|
|
133
|
+
|
|
134
|
+
|
|
135
|
+
## Development
|
|
136
|
+
|
|
137
|
+
The project uses [uv](https://docs.astral.sh/uv/) for environments and dependency locking.
|
|
138
|
+
|
|
139
|
+
```bash
|
|
140
|
+
git clone https://github.com/docdru/plotlywaterfall.git
|
|
141
|
+
cd plotlywaterfall
|
|
142
|
+
uv sync # creates .venv with the package + all dev tools
|
|
143
|
+
uv run pre-commit install # optional: run checks on every commit
|
|
144
|
+
```
|
|
145
|
+
|
|
146
|
+
Common tasks:
|
|
147
|
+
|
|
148
|
+
| Task | Command |
|
|
149
|
+
|---|---|
|
|
150
|
+
| Run tests | `uv run pytest` |
|
|
151
|
+
| Tests with coverage | `uv run pytest --cov` |
|
|
152
|
+
| Test another Python | `uv run --python 3.11 pytest` |
|
|
153
|
+
| Lint / auto-fix | `uv run ruff check --fix` |
|
|
154
|
+
| Format | `uv run ruff format` |
|
|
155
|
+
| Type check | `uv run mypy` |
|
|
156
|
+
| Execute example notebook | `uv run pytest --nbmake examples/ -p no:warnings` |
|
|
157
|
+
| Build the docs site (gallery + README image) | `uv run --group notebook --with nbconvert --with kaleido python scripts/build_docs.py --out site` |
|
|
158
|
+
| Open notebooks | `uv run --with jupyterlab jupyter lab` |
|
|
159
|
+
| Build sdist + wheel | `uv build` |
|
|
160
|
+
|
|
161
|
+
CI (GitHub Actions) runs lint, type checks, the test suite on Python 3.11–3.15 (Linux, plus Windows; macOS on `main` and the weekly run),
|
|
162
|
+
a test against the lowest supported dependency versions, the docs site, and a package build.
|
|
163
|
+
|
|
164
|
+
The **docs site** job executes `examples/examples.ipynb`, renders it to HTML with interactive charts and
|
|
165
|
+
renders the README image from `examples/readme_example.py` (keep it in sync with the README code).
|
|
166
|
+
Pull requests get the result as the `docs-site` artifact of the CI run; on `main` it is published to
|
|
167
|
+
[GitHub Pages](https://docdru.github.io/plotlywaterfall/). Nothing generated is committed. One-time setup: *Settings → Pages →
|
|
168
|
+
Build and deployment → Source: GitHub Actions*.
|
|
169
|
+
|
|
170
|
+
### AI pull-request review
|
|
171
|
+
|
|
172
|
+
Pull requests get an automated review comment (correctness and tests, API/docs consistency,
|
|
173
|
+
security and supply chain, surprising changes) from `.github/workflows/ai-review.yml`, which runs
|
|
174
|
+
`scripts/ai_review.py` against the Mistral API. The comment is updated on every push.
|
|
175
|
+
|
|
176
|
+
- **Setup:** add the repository secret `MISTRAL_API_KEY` (*Settings → Secrets and variables → Actions*).
|
|
177
|
+
Optionally set the repository variable `AI_REVIEW_MODEL` to override the default model (`mistral-large-2512`).
|
|
178
|
+
- **Scope:** runs for non-draft PRs from branches in this repository by authors with write access;
|
|
179
|
+
fork, bot and draft PRs are skipped. Mark a draft "Ready for review" to trigger it.
|
|
180
|
+
- **Try locally** (prints the prompt, calls nothing, posts nothing):
|
|
181
|
+
`GITHUB_REPOSITORY=docdru/plotlywaterfall GITHUB_TOKEN=$(gh auth token) python scripts/ai_review.py --pr 1 --dry-run`
|
|
182
|
+
|
|
183
|
+
The review is advisory: it is not part of the required checks, and its findings should be verified.
|
|
184
|
+
|
|
185
|
+
### Releasing
|
|
186
|
+
|
|
187
|
+
1. Bump `__version__` in `src/plotlywaterfall/__about__.py` and add a `CHANGELOG.md` entry.
|
|
188
|
+
2. Commit, then tag and push: `git tag v0.9.4 && git push origin v0.9.4`.
|
|
189
|
+
3. The `Release` workflow builds the package and publishes it to PyPI via
|
|
190
|
+
[Trusted Publishing](https://docs.pypi.org/trusted-publishers/) (no API token needed).
|
|
191
|
+
|
|
192
|
+
## Changelog
|
|
193
|
+
|
|
194
|
+
Refer to [CHANGELOG.md](https://github.com/docdru/plotlywaterfall/blob/main/CHANGELOG.md)
|