plotly-print 0.1.0__tar.gz → 0.2.0__tar.gz
This diff represents the content of publicly available package versions that have been released to one of the supported registries. The information contained in this diff is provided for informational purposes only and reflects changes between package versions as they appear in their respective public registries.
- {plotly_print-0.1.0 → plotly_print-0.2.0}/.cursor/rules/artifacts.mdc +1 -2
- {plotly_print-0.1.0 → plotly_print-0.2.0}/CONTRIBUTING.md +4 -4
- plotly_print-0.2.0/PKG-INFO +256 -0
- plotly_print-0.2.0/README.md +230 -0
- {plotly_print-0.1.0 → plotly_print-0.2.0}/THIRD_PARTY_NOTICES.md +5 -5
- plotly_print-0.2.0/assets/benchmarks/benchmark_summary.json +292 -0
- plotly_print-0.2.0/assets/benchmarks/compare_annotations_arrowheads.png +0 -0
- plotly_print-0.2.0/assets/benchmarks/compare_annotations_long_arrows.png +0 -0
- plotly_print-0.2.0/assets/benchmarks/compare_bar.png +0 -0
- plotly_print-0.2.0/assets/benchmarks/compare_barpolar.png +0 -0
- plotly_print-0.2.0/assets/benchmarks/compare_box.png +0 -0
- plotly_print-0.2.0/assets/benchmarks/compare_candlestick.png +0 -0
- plotly_print-0.2.0/assets/benchmarks/compare_carpet.png +0 -0
- plotly_print-0.2.0/assets/benchmarks/compare_contour.png +0 -0
- plotly_print-0.2.0/assets/benchmarks/compare_funnel.png +0 -0
- plotly_print-0.2.0/assets/benchmarks/compare_funnelarea.png +0 -0
- plotly_print-0.2.0/assets/benchmarks/compare_heatmap.png +0 -0
- plotly_print-0.2.0/assets/benchmarks/compare_histogram.png +0 -0
- plotly_print-0.2.0/assets/benchmarks/compare_histogram2d.png +0 -0
- plotly_print-0.2.0/assets/benchmarks/compare_icicle.png +0 -0
- plotly_print-0.2.0/assets/benchmarks/compare_indicator.png +0 -0
- plotly_print-0.2.0/assets/benchmarks/compare_ohlc.png +0 -0
- plotly_print-0.2.0/assets/benchmarks/compare_parcats.png +0 -0
- plotly_print-0.2.0/assets/benchmarks/compare_pie.png +0 -0
- plotly_print-0.2.0/assets/benchmarks/compare_rotated_ticks_45.png +0 -0
- plotly_print-0.2.0/assets/benchmarks/compare_rotated_ticks_90.png +0 -0
- plotly_print-0.2.0/assets/benchmarks/compare_sankey.png +0 -0
- plotly_print-0.2.0/assets/benchmarks/compare_scatter_line.png +0 -0
- plotly_print-0.2.0/assets/benchmarks/compare_scatterpolar.png +0 -0
- plotly_print-0.2.0/assets/benchmarks/compare_scatterternary.png +0 -0
- plotly_print-0.2.0/assets/benchmarks/compare_sunburst.png +0 -0
- plotly_print-0.2.0/assets/benchmarks/compare_table.png +0 -0
- plotly_print-0.2.0/assets/benchmarks/compare_treemap.png +0 -0
- plotly_print-0.2.0/assets/benchmarks/compare_violin.png +0 -0
- plotly_print-0.2.0/assets/benchmarks/compare_waterfall.png +0 -0
- {plotly_print-0.1.0 → plotly_print-0.2.0}/benchmark/cases.py +34 -0
- plotly_print-0.2.0/benchmark/collage.py +71 -0
- plotly_print-0.2.0/benchmark/report.py +95 -0
- {plotly_print-0.1.0 → plotly_print-0.2.0}/benchmark/runner.py +13 -27
- {plotly_print-0.1.0 → plotly_print-0.2.0}/pyproject.toml +1 -2
- {plotly_print-0.1.0 → plotly_print-0.2.0}/src/plotly_print/engine.py +2 -2
- {plotly_print-0.1.0 → plotly_print-0.2.0}/src/plotly_print/js/micro_dom.js +543 -0
- plotly_print-0.2.0/src/plotly_print/js/plotly_comprehensive_2d.js +121 -0
- {plotly_print-0.1.0 → plotly_print-0.2.0}/tests/test_kaleido_visual.py +4 -4
- plotly_print-0.2.0/tests/test_svg_path_geometry.py +263 -0
- {plotly_print-0.1.0 → plotly_print-0.2.0}/uv.lock +1 -1
- plotly_print-0.1.0/PKG-INFO +0 -66
- plotly_print-0.1.0/README.md +0 -40
- plotly_print-0.1.0/benchmark/collage.py +0 -89
- plotly_print-0.1.0/benchmark/report.py +0 -39
- plotly_print-0.1.0/src/plotly_print/js/plotly-cartesian.min.js +0 -149
- {plotly_print-0.1.0 → plotly_print-0.2.0}/.cursor/rules/global.mdc +0 -0
- {plotly_print-0.1.0 → plotly_print-0.2.0}/.cursor/rules/markdown.mdc +0 -0
- {plotly_print-0.1.0 → plotly_print-0.2.0}/.github/workflows/check-tag.yml +0 -0
- {plotly_print-0.1.0 → plotly_print-0.2.0}/.github/workflows/publish.yml +0 -0
- {plotly_print-0.1.0 → plotly_print-0.2.0}/.github/workflows/quality-checks.yml +0 -0
- {plotly_print-0.1.0 → plotly_print-0.2.0}/.github/workflows/version-check.yml +0 -0
- {plotly_print-0.1.0 → plotly_print-0.2.0}/.gitignore +0 -0
- {plotly_print-0.1.0 → plotly_print-0.2.0}/.mdformat.toml +0 -0
- {plotly_print-0.1.0 → plotly_print-0.2.0}/.pre-commit-config.yaml +0 -0
- {plotly_print-0.1.0 → plotly_print-0.2.0}/AGENTS.md +0 -0
- {plotly_print-0.1.0 → plotly_print-0.2.0}/LICENSE +0 -0
- {plotly_print-0.1.0 → plotly_print-0.2.0}/benchmark/__init__.py +0 -0
- {plotly_print-0.1.0 → plotly_print-0.2.0}/benchmark/__main__.py +0 -0
- {plotly_print-0.1.0 → plotly_print-0.2.0}/benchmark/compare.py +0 -0
- {plotly_print-0.1.0 → plotly_print-0.2.0}/src/plotly_print/__init__.py +0 -0
- {plotly_print-0.1.0 → plotly_print-0.2.0}/src/plotly_print/core.py +0 -0
- {plotly_print-0.1.0 → plotly_print-0.2.0}/src/plotly_print/fonts.py +0 -0
- {plotly_print-0.1.0 → plotly_print-0.2.0}/src/plotly_print/plotly_hook.py +0 -0
- {plotly_print-0.1.0 → plotly_print-0.2.0}/src/plotly_print/raster.py +0 -0
- {plotly_print-0.1.0 → plotly_print-0.2.0}/tests/test_background.py +0 -0
- {plotly_print-0.1.0 → plotly_print-0.2.0}/tests/test_bar.py +0 -0
- {plotly_print-0.1.0 → plotly_print-0.2.0}/tests/test_cartesian_types.py +0 -0
- {plotly_print-0.1.0 → plotly_print-0.2.0}/tests/test_comprehensive_2d.py +0 -0
- {plotly_print-0.1.0 → plotly_print-0.2.0}/tests/test_heatmap.py +0 -0
- {plotly_print-0.1.0 → plotly_print-0.2.0}/tests/test_json_types.py +0 -0
- {plotly_print-0.1.0 → plotly_print-0.2.0}/tests/test_legend.py +0 -0
- {plotly_print-0.1.0 → plotly_print-0.2.0}/tests/test_pie.py +0 -0
- {plotly_print-0.1.0 → plotly_print-0.2.0}/tests/test_plotly_hook.py +0 -0
- {plotly_print-0.1.0 → plotly_print-0.2.0}/tests/test_raster.py +0 -0
- {plotly_print-0.1.0 → plotly_print-0.2.0}/tests/test_scatter.py +0 -0
- {plotly_print-0.1.0 → plotly_print-0.2.0}/tests/test_svg_transforms.py +0 -0
|
@@ -7,9 +7,8 @@ alwaysApply: true
|
|
|
7
7
|
|
|
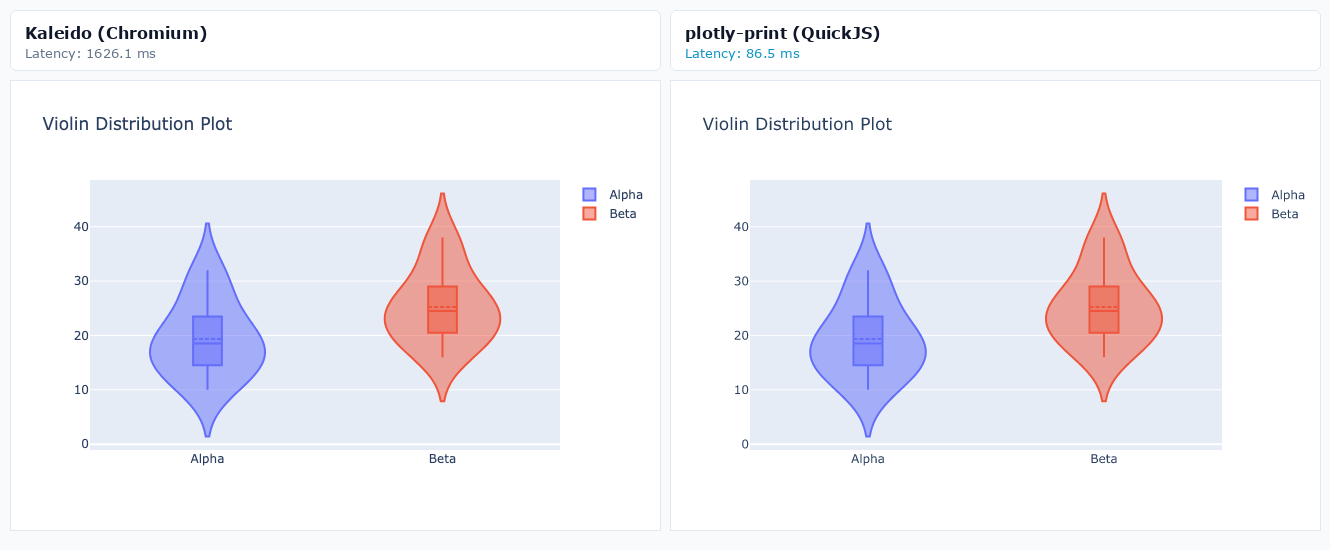
8
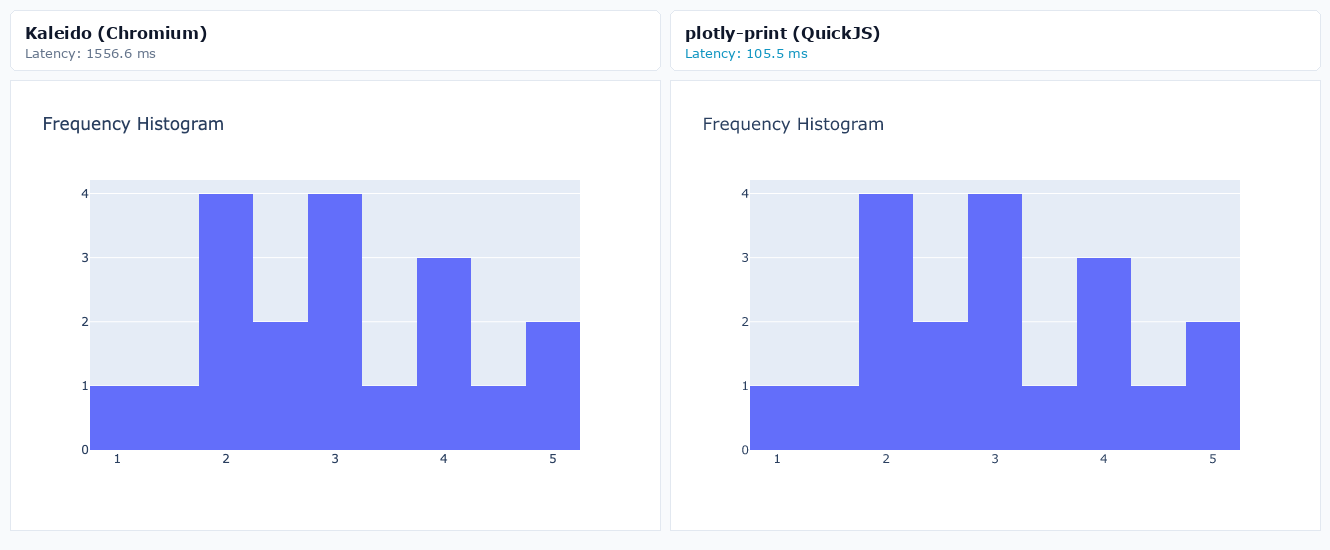
8
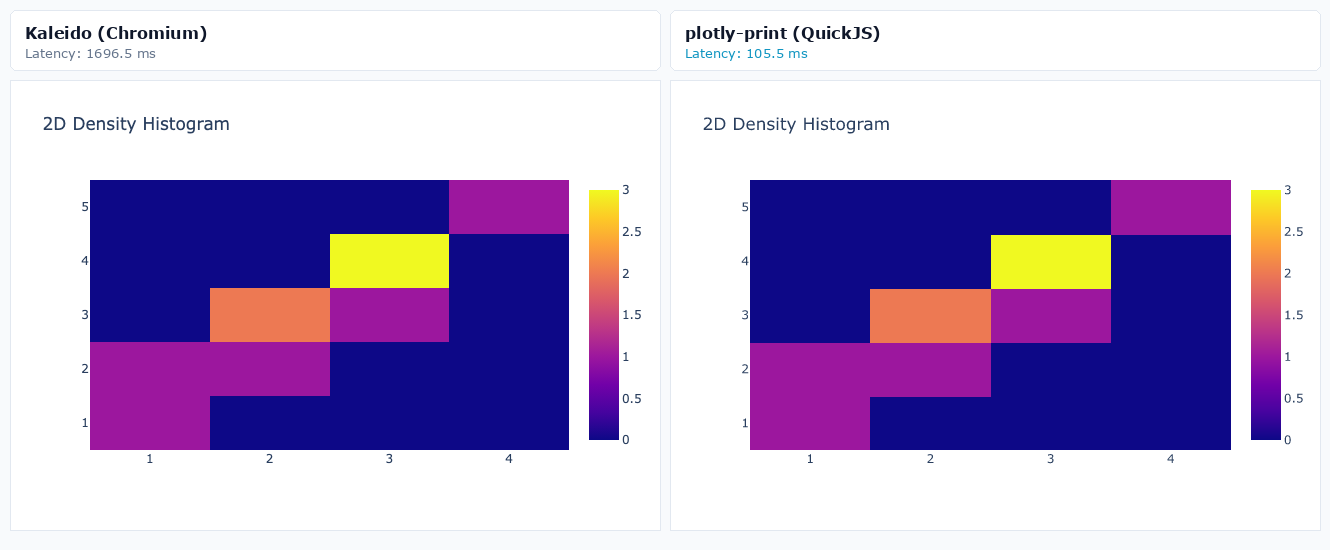
|
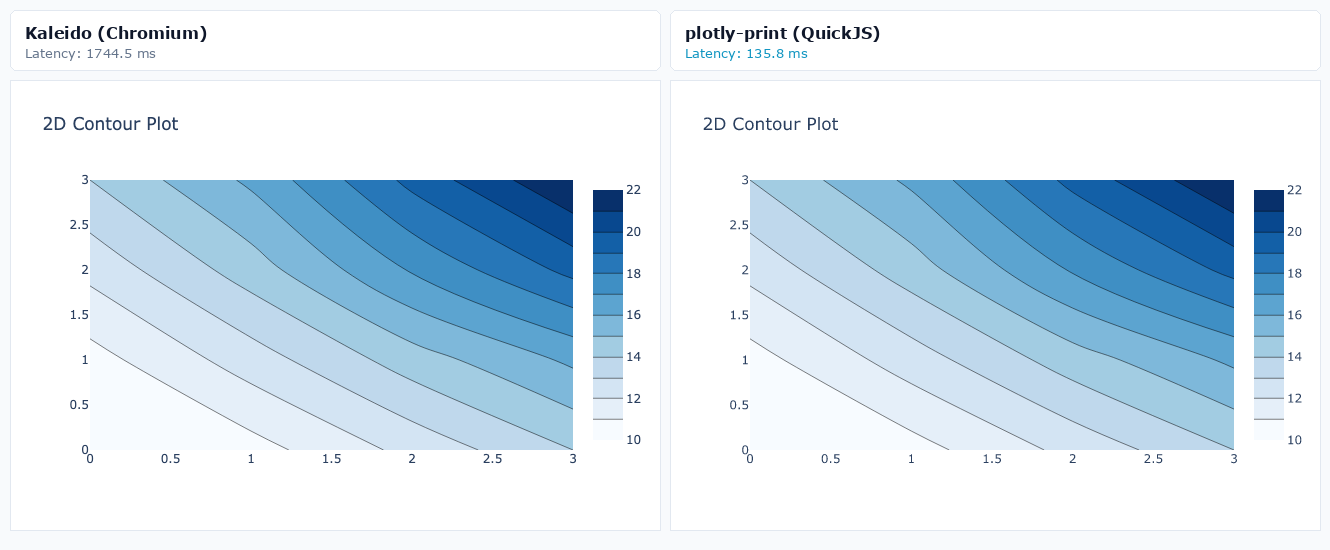
The repo root `.artifacts/` directory is **gitignored**. Use it for:
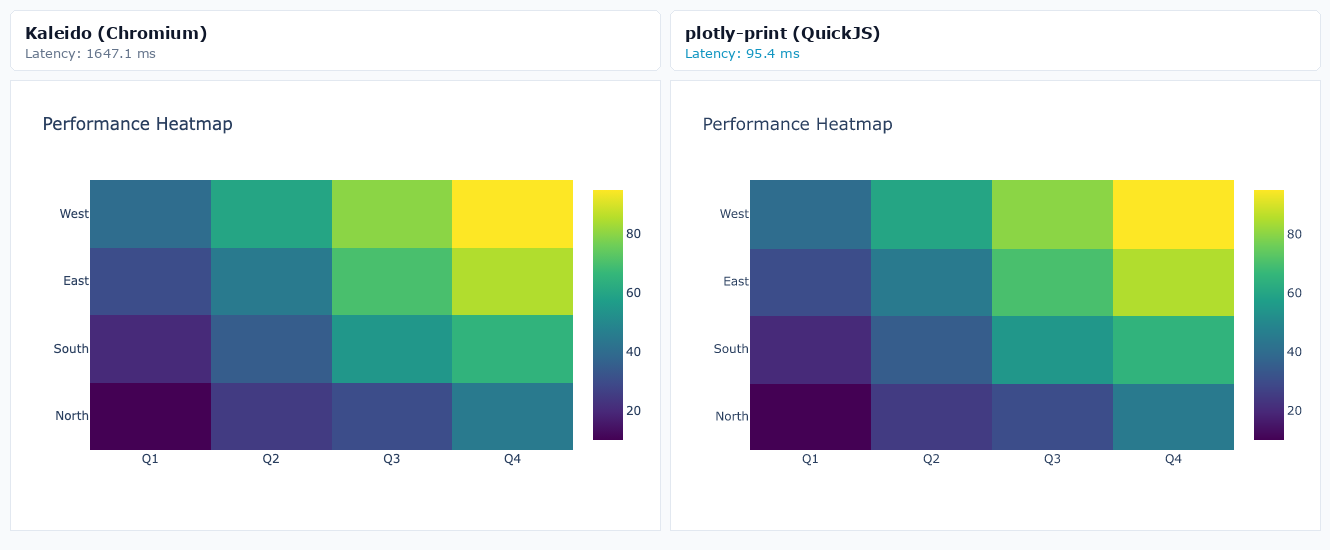
|
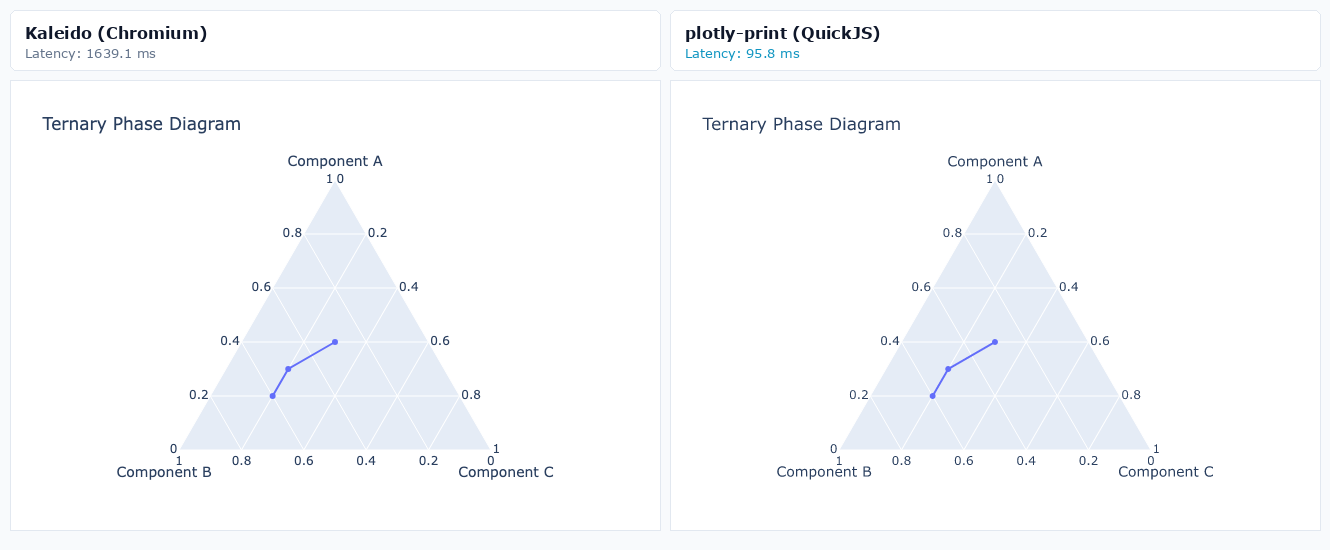
|
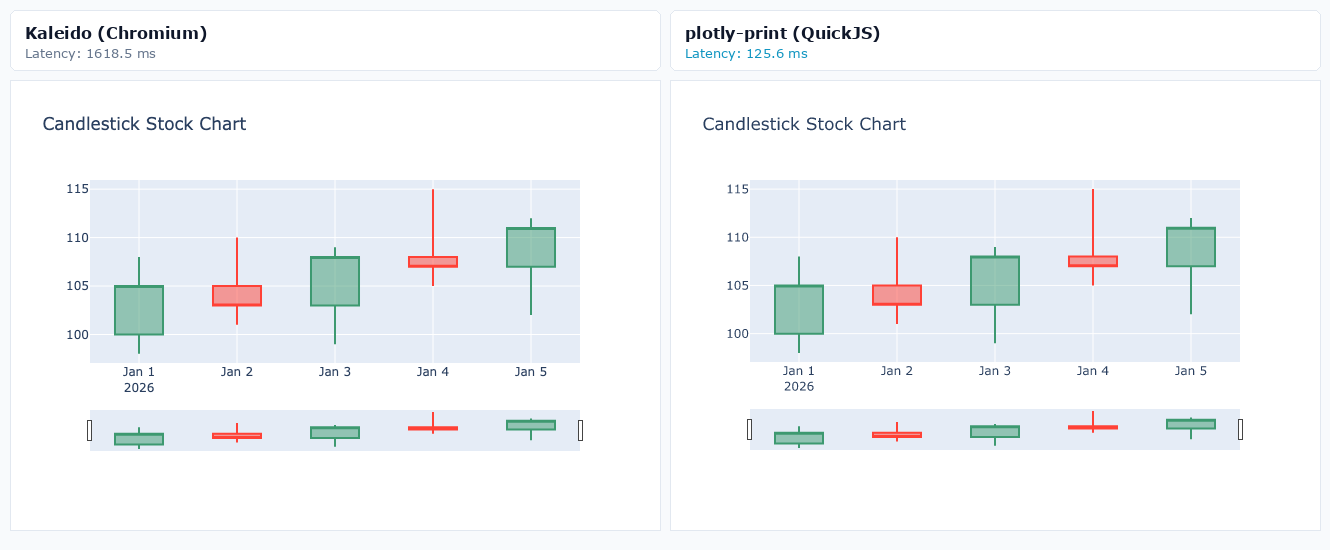
9
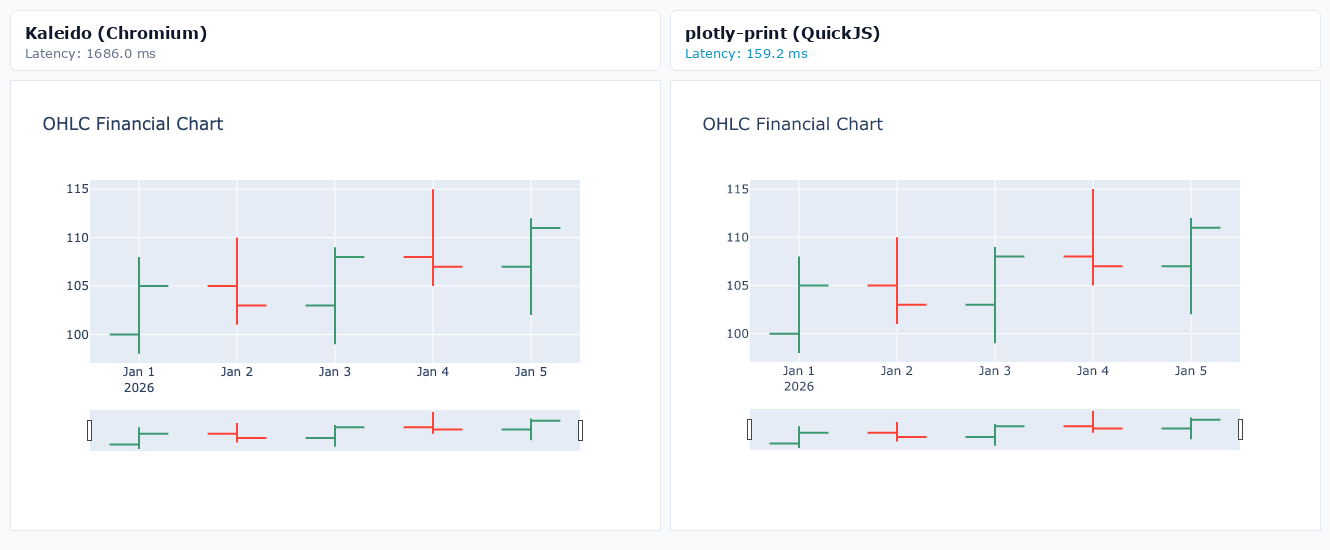
9
|
|
|
10
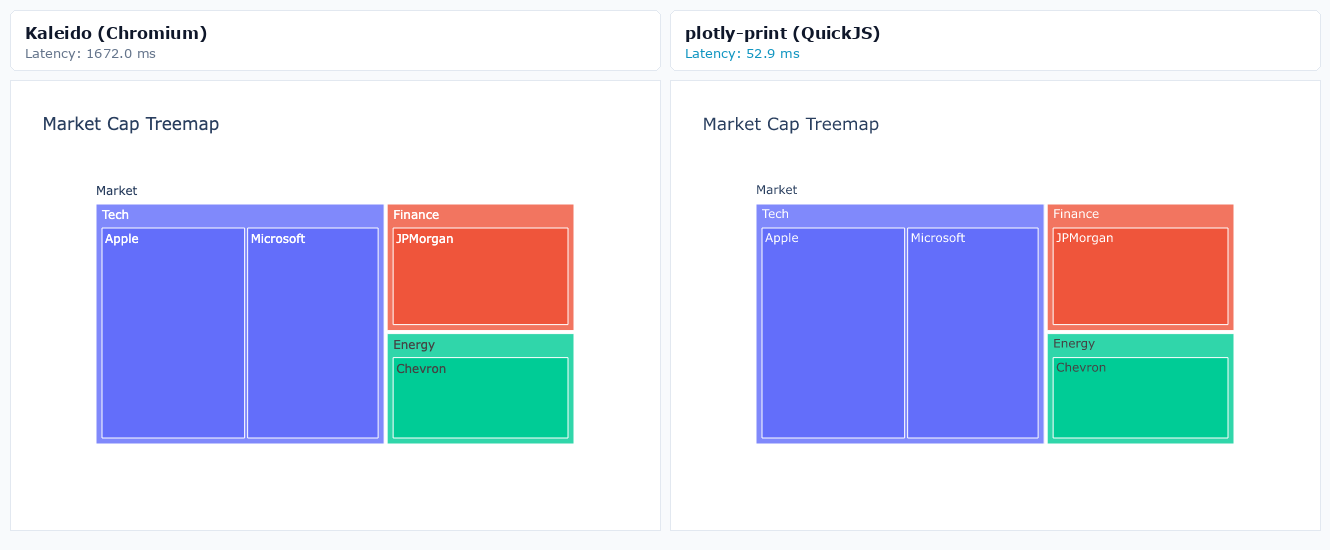
|
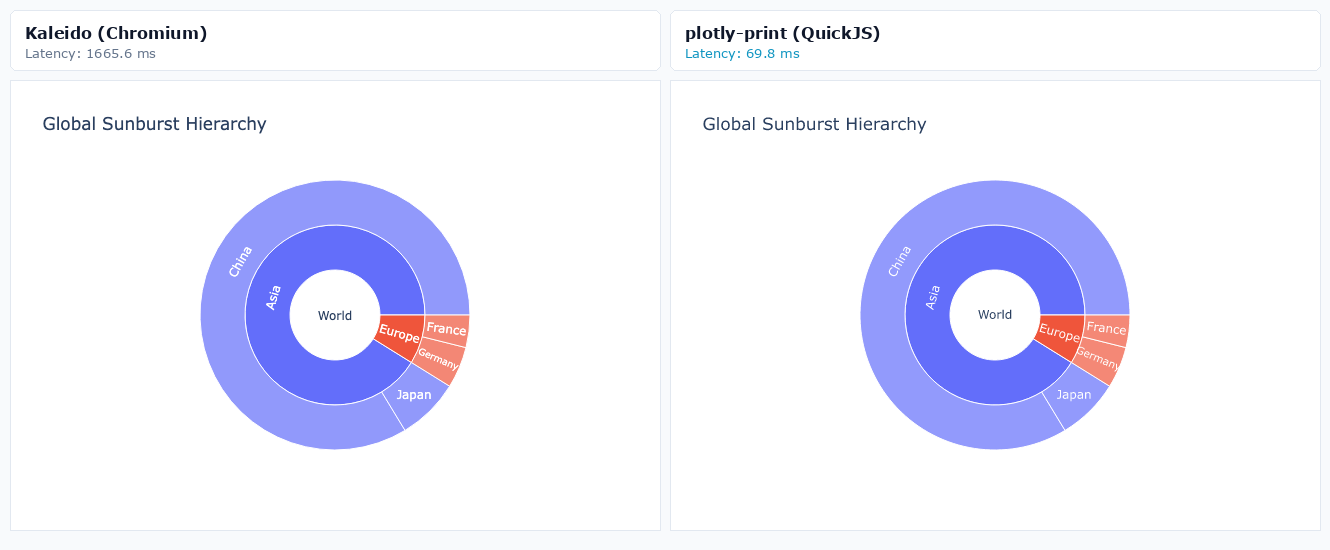
-
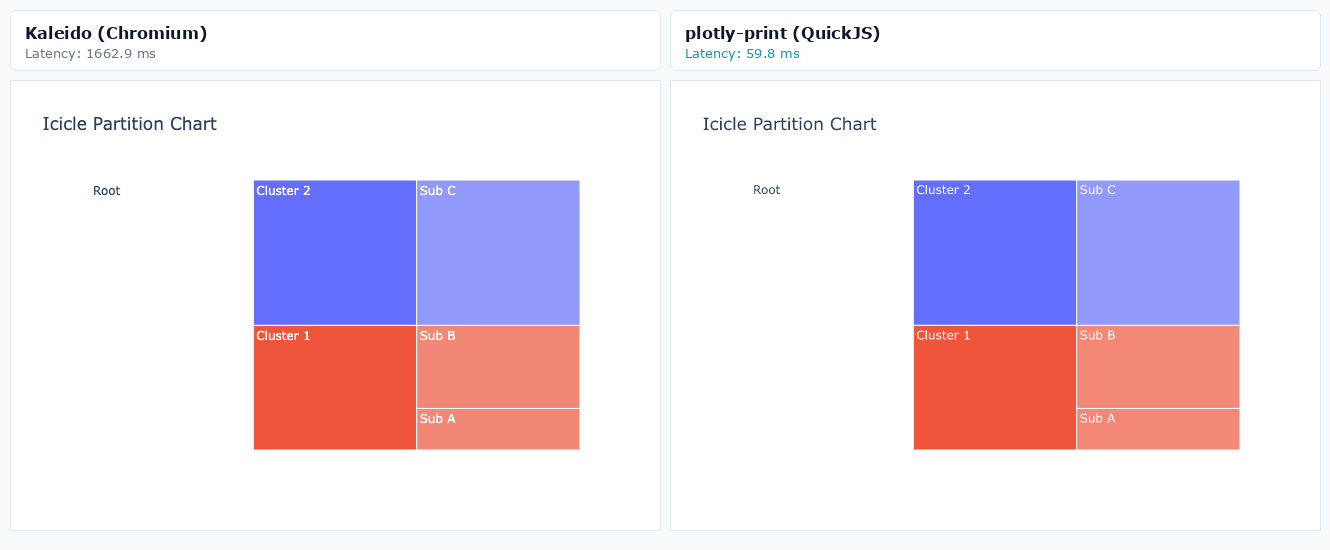
- Benchmark output (`poe benchmark` writes to `.artifacts/benchmark/`)
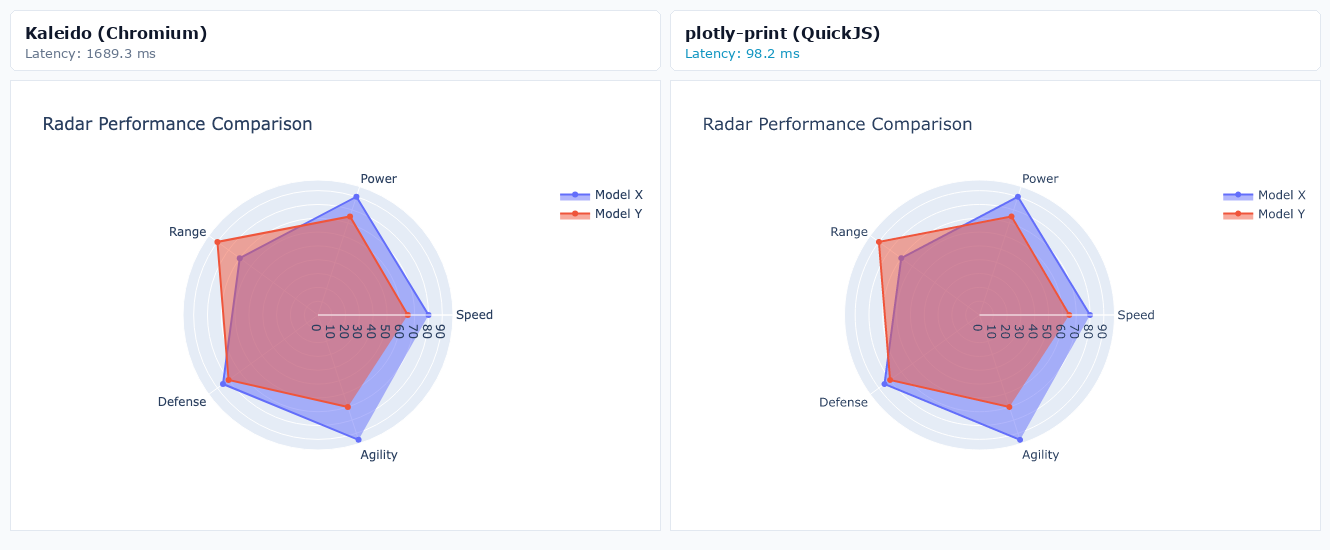
|
|
11
10
|
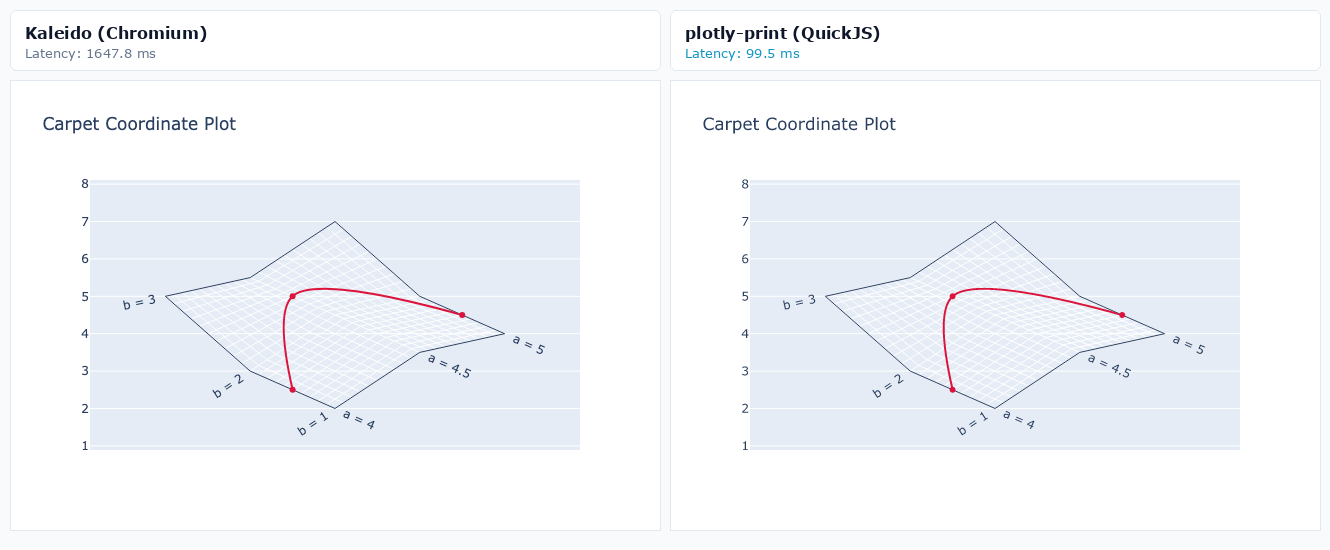
- LLM research notes, comparison reports, scratch exports, and other **temporary local artifacts**
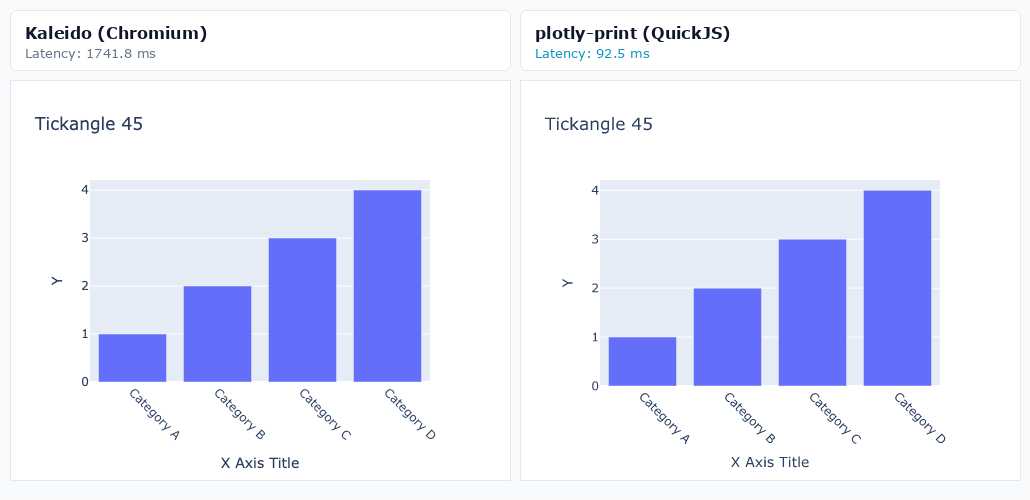
|
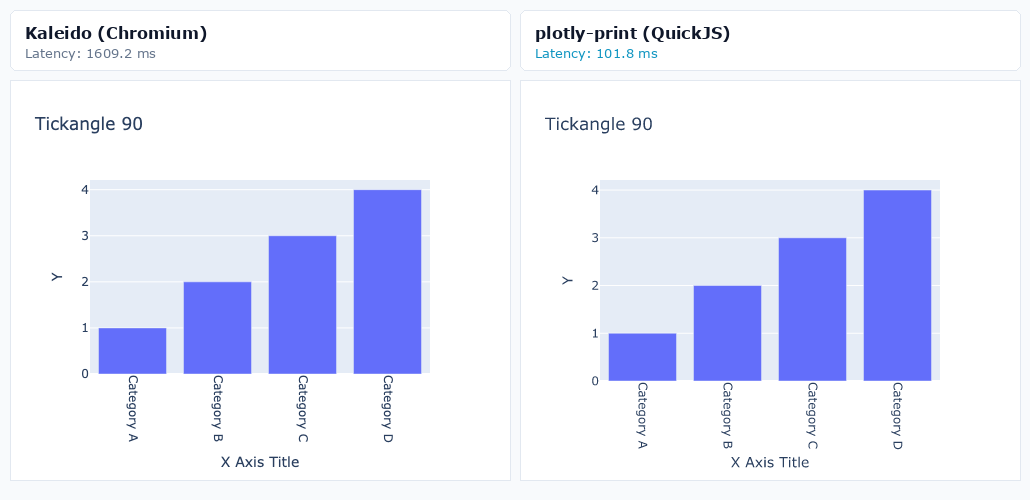
|
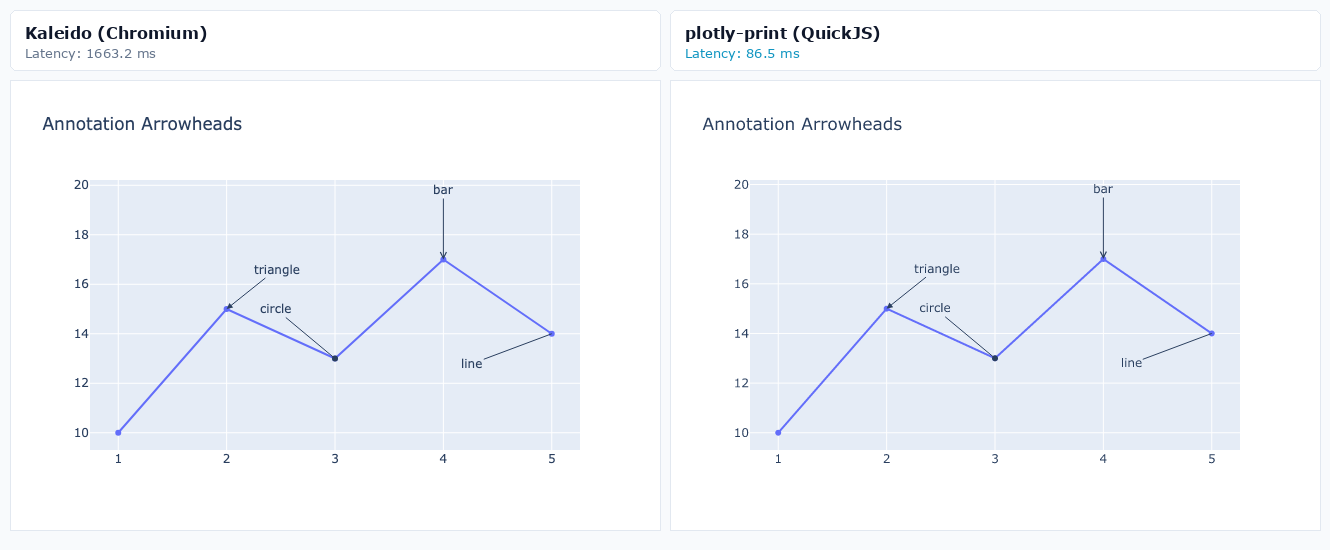
12
11
|
|
|
13
12
|
Do not commit files under `.artifacts/`. Nothing there is shipped on PyPI or in the wheel.
|
|
14
13
|
|
|
15
|
-
When generating
|
|
14
|
+
When generating research or large binary outputs for the user to review (outside the benchmark), prefer paths under `.artifacts/` unless they ask for another location.
|
|
@@ -22,15 +22,15 @@ poe test
|
|
|
22
22
|
|
|
23
23
|
## Kaleido visual benchmark
|
|
24
24
|
|
|
25
|
-
Compare plotly-print
|
|
25
|
+
Compare plotly-print to Kaleido (dev-only; not in the PyPI wheel). Kaleido is in the `test` dependency group and is installed by `poe install` / `uv sync`.
|
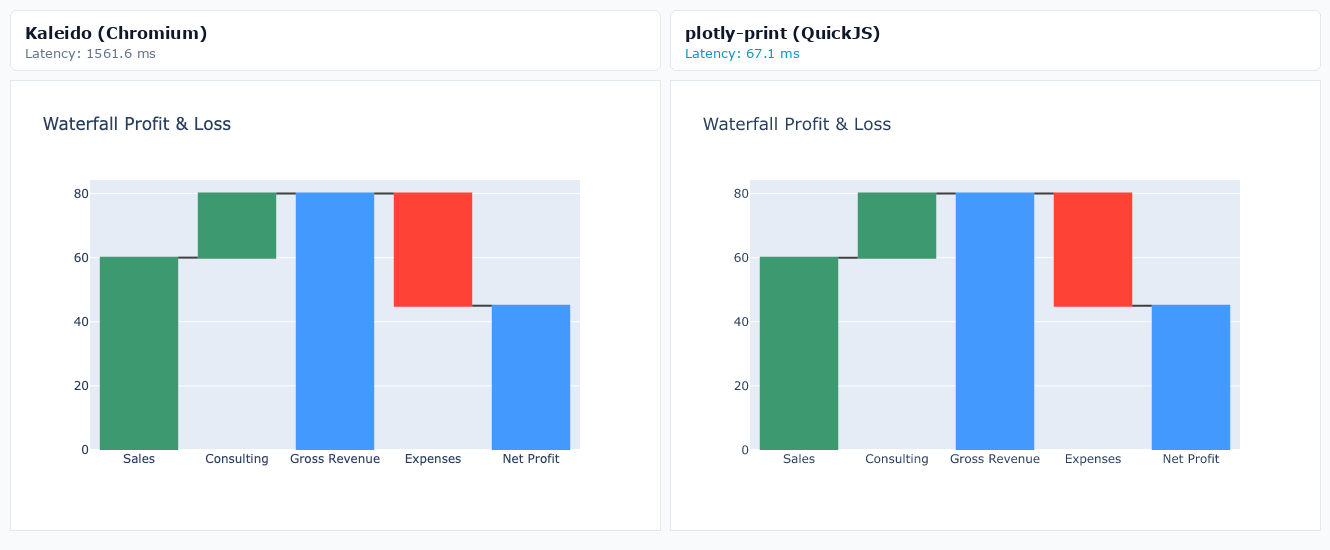
|
26
26
|
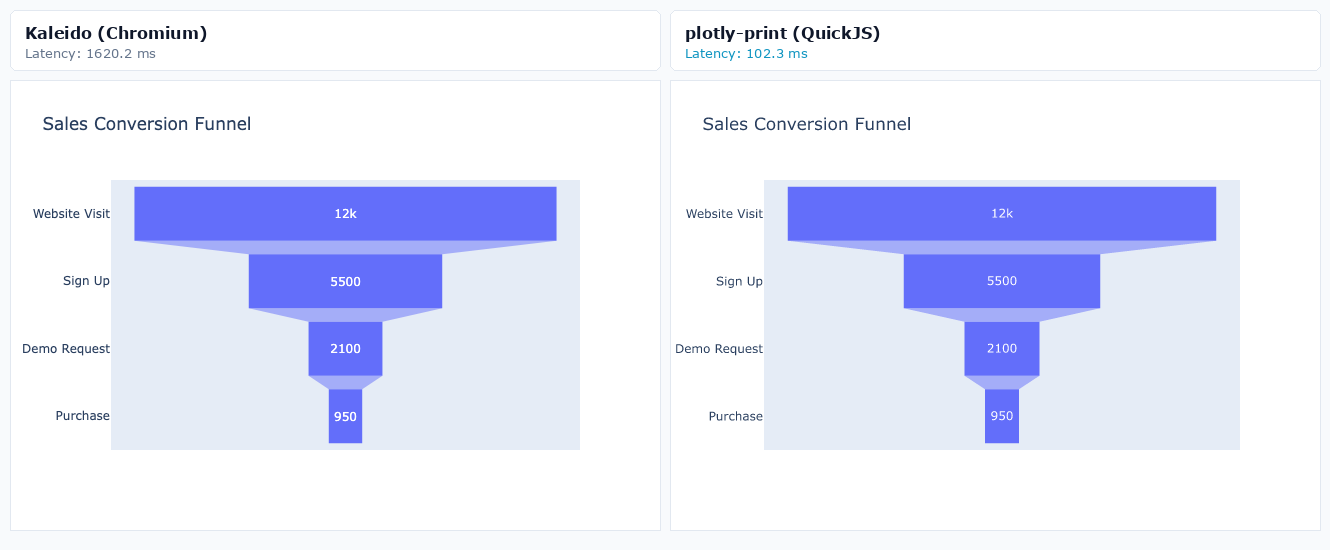
|
|
27
27
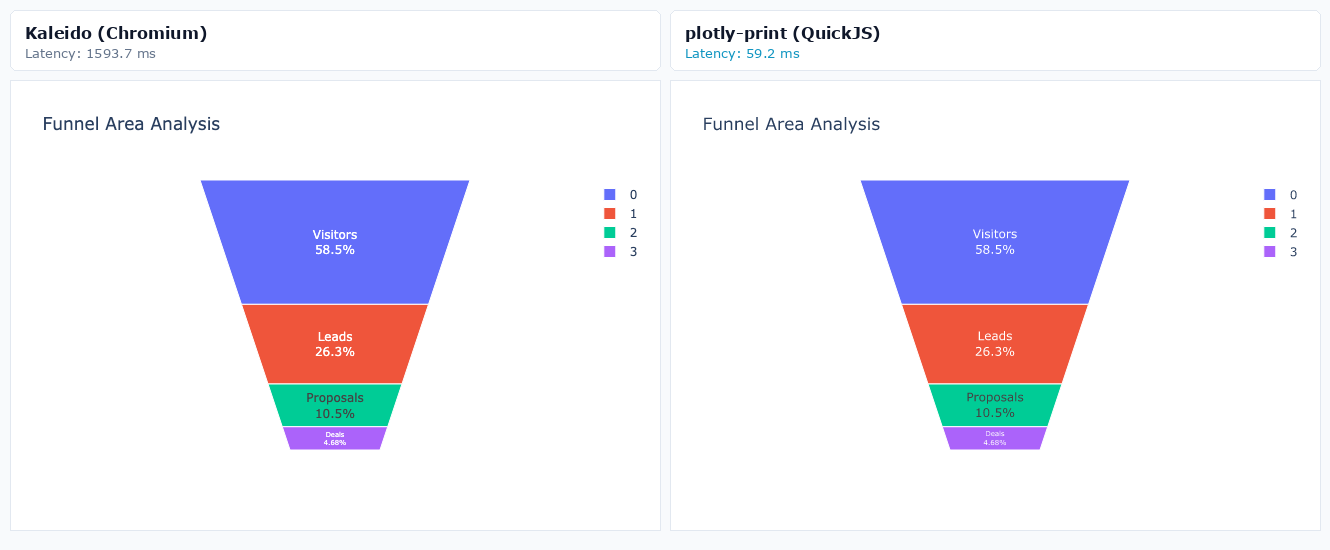
|
```shell
|
|
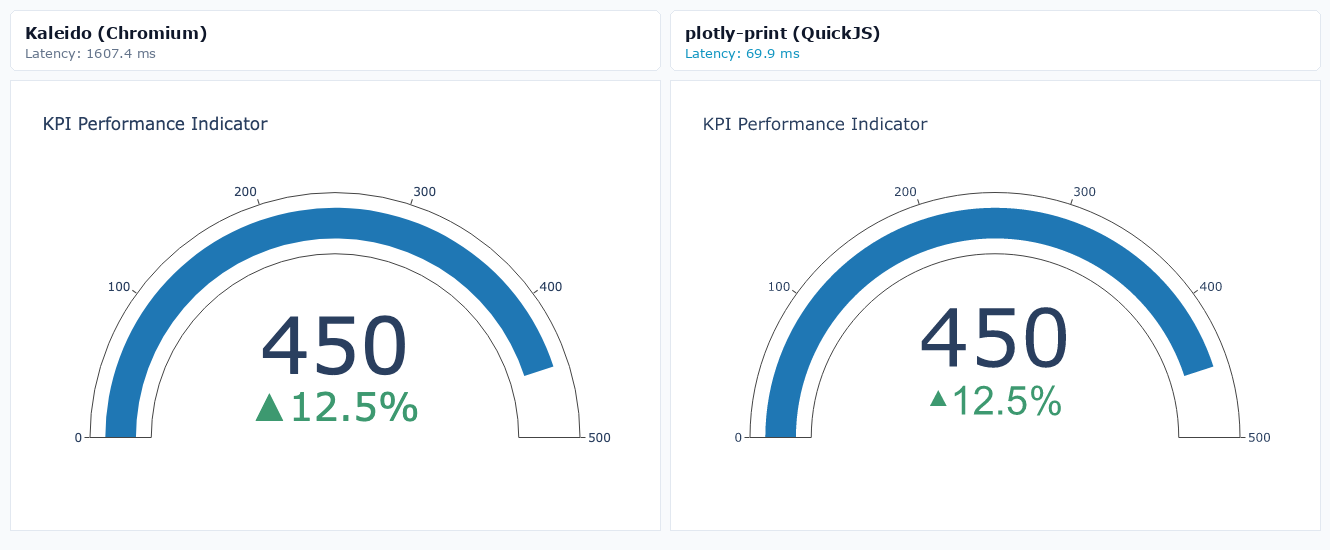
28
|
-
poe
|
|
28
|
+
poe benchmark
|
|
29
29
|
```
|
|
30
30
|
|
|
31
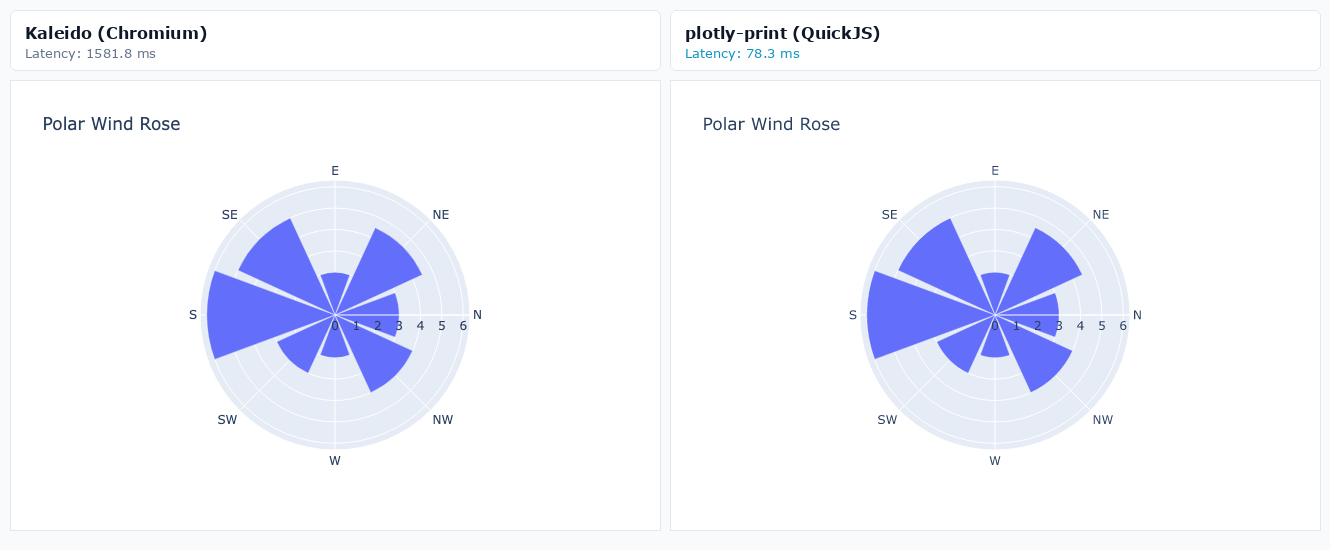
|
-
|
|
31
|
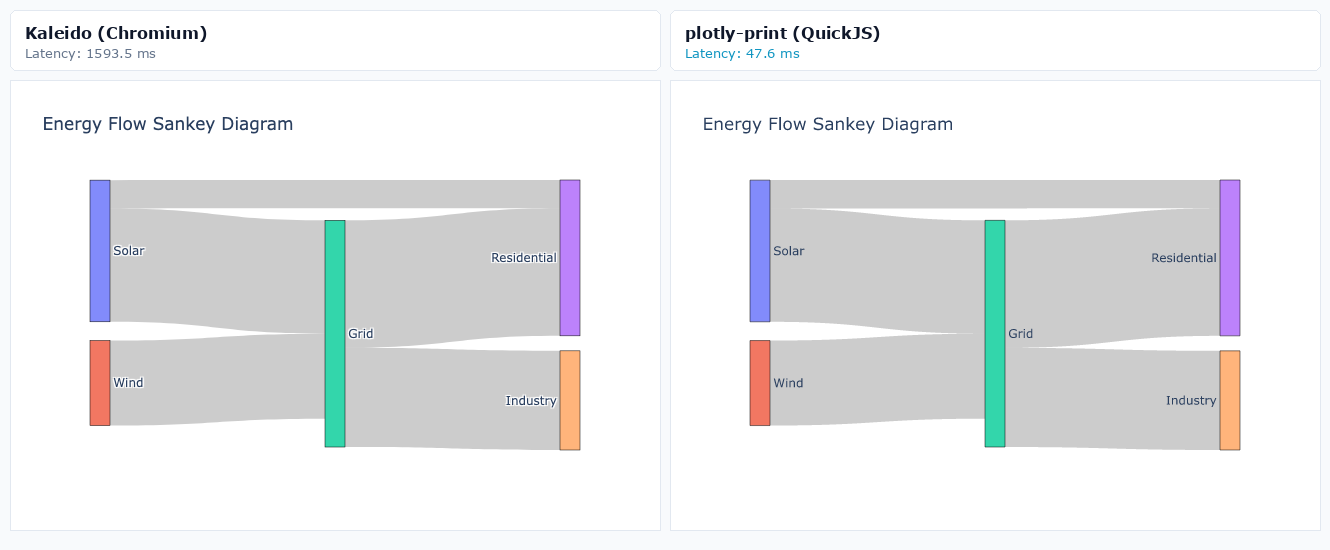
+
Writes side-by-side PNGs (Kaleido / Chromium left, plotly-print / QuickJS right) and `benchmark_summary.json` under `assets/benchmarks/`, and refreshes the speed/visual sections in `README.md` (image links use absolute `raw.githubusercontent.com` URLs). Commit those assets with the README when timings or visuals change.
|
|
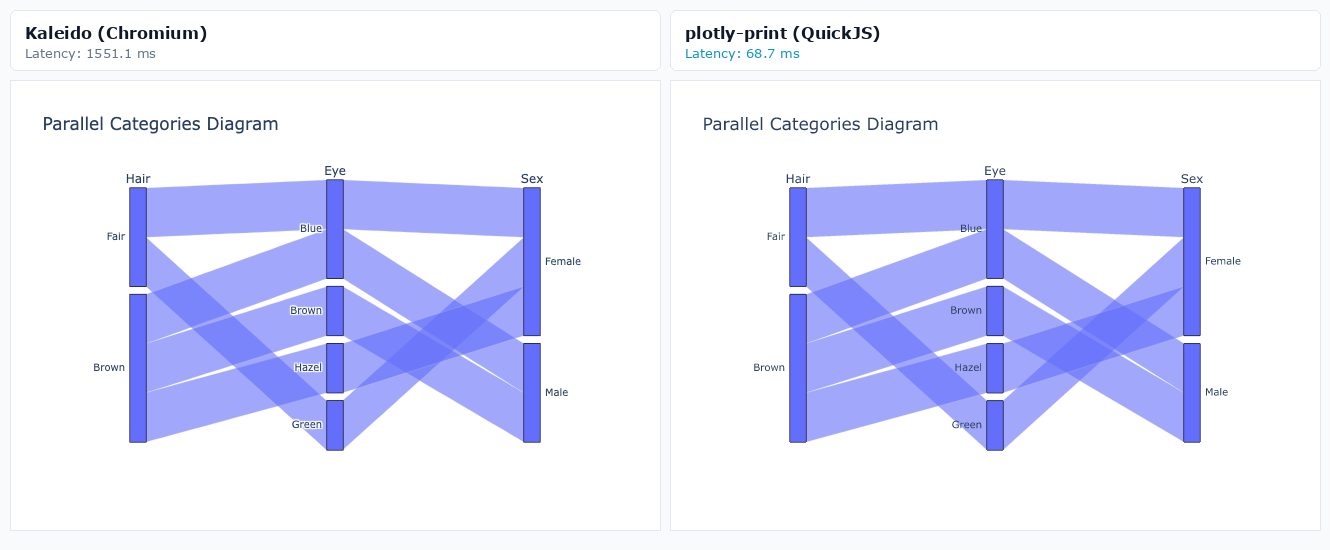
32
32
|
|
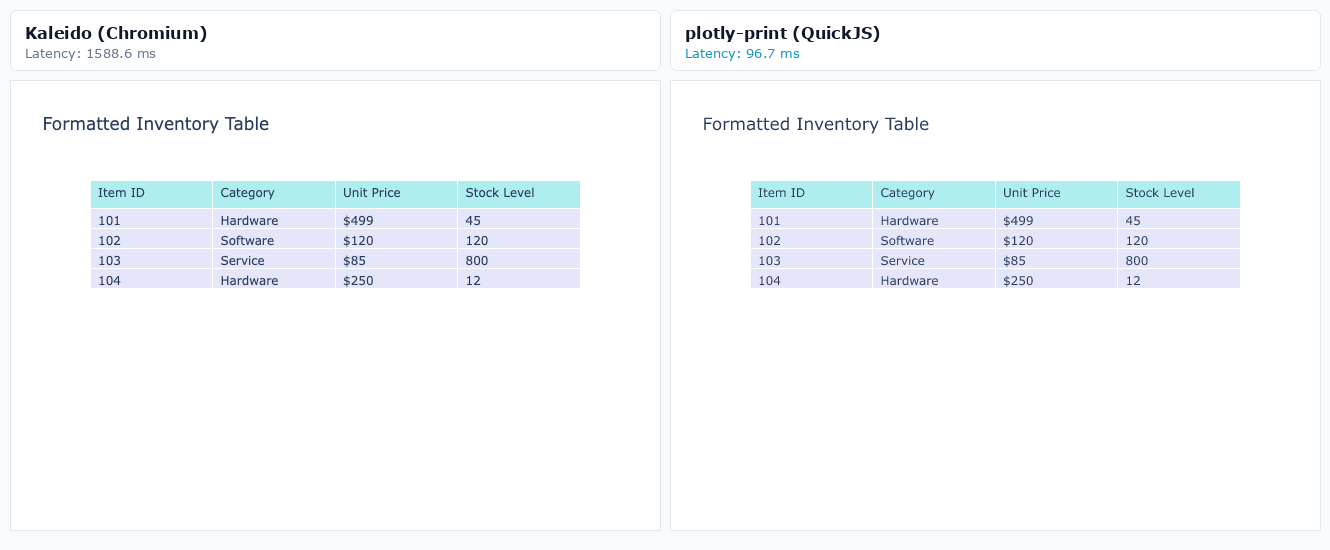
|
33
|
-
|
|
33
|
+
`poe test` includes a Kaleido mean-pixel-diff check for **every** chart fixture in `benchmark/cases.py` (skipped if Kaleido is not installed).
|
|
34
34
|
|
|
35
35
|
## Release
|
|
36
36
|
|
|
@@ -0,0 +1,256 @@
|
|
|
1
|
+
Metadata-Version: 2.5
|
|
2
|
+
Name: plotly-print
|
|
3
|
+
Version: 0.2.0
|
|
4
|
+
Summary: Lightweight, browser-less static image exporter for Plotly
|
|
5
|
+
Project-URL: Homepage, https://github.com/roman-kaczanowski/plotly-print
|
|
6
|
+
Project-URL: Repository, https://github.com/roman-kaczanowski/plotly-print
|
|
7
|
+
Project-URL: Issues, https://github.com/roman-kaczanowski/plotly-print/issues
|
|
8
|
+
Author-email: Roman Kaczanowski <roman.kaczanowski.pl@gmail.com>
|
|
9
|
+
License-Expression: MIT
|
|
10
|
+
License-File: LICENSE
|
|
11
|
+
License-File: THIRD_PARTY_NOTICES.md
|
|
12
|
+
Keywords: export,headless,kaleido,plotly,png,svg,visualization
|
|
13
|
+
Classifier: License :: OSI Approved :: MIT License
|
|
14
|
+
Classifier: Operating System :: OS Independent
|
|
15
|
+
Classifier: Programming Language :: Python :: 3
|
|
16
|
+
Classifier: Programming Language :: Python :: 3 :: Only
|
|
17
|
+
Classifier: Programming Language :: Python :: 3.12
|
|
18
|
+
Classifier: Programming Language :: Python :: 3.13
|
|
19
|
+
Classifier: Topic :: Scientific/Engineering :: Visualization
|
|
20
|
+
Requires-Python: >=3.12
|
|
21
|
+
Requires-Dist: pillow>=9.0.0
|
|
22
|
+
Requires-Dist: plotly>=5.0.0
|
|
23
|
+
Requires-Dist: quickjs>=1.19.0
|
|
24
|
+
Requires-Dist: resvg-py>=0.4.0
|
|
25
|
+
Description-Content-Type: text/markdown
|
|
26
|
+
|
|
27
|
+
# plotly-print
|
|
28
|
+
|
|
29
|
+
[](https://github.com/roman-kaczanowski/plotly-print/actions/workflows/quality-checks.yml) [](https://pypi.org/project/plotly-print/) [](https://docs.python.org/3/) [](LICENSE)
|
|
30
|
+
|
|
31
|
+
Export Plotly figures to SVG, PNG, JPEG, or WebP without launching Chrome.
|
|
32
|
+
|
|
33
|
+
plotly-print runs a bundled Plotly.js 2D build in QuickJS, then uses `resvg-py` for raster output. It works offline, has no browser process to install or manage, and can replace Plotly's image-export methods with one call.
|
|
34
|
+
|
|
35
|
+
- Browser-free: no Chrome, Chromium, or Playwright.
|
|
36
|
+
- Fast: avoids browser startup; see the measured [benchmarks](#benchmarks).
|
|
37
|
+
- Familiar: use the direct API or patch Plotly's existing `to_image` and `write_image` methods.
|
|
38
|
+
|
|
39
|
+
[Install](#installation) | [Direct API](#direct-api) | [Plotly integration](#plotly-integration) | [Benchmarks](#benchmarks)
|
|
40
|
+
|
|
41
|
+
## Installation
|
|
42
|
+
|
|
43
|
+
```bash
|
|
44
|
+
pip install plotly-print
|
|
45
|
+
```
|
|
46
|
+
|
|
47
|
+
Requires Python 3.12 or newer.
|
|
48
|
+
|
|
49
|
+
## Direct API
|
|
50
|
+
|
|
51
|
+
```python
|
|
52
|
+
import plotly.express as px
|
|
53
|
+
import plotly_print
|
|
54
|
+
|
|
55
|
+
fig = px.scatter(x=[1, 2, 3, 4], y=[10, 11, 12, 13], title='Sales Growth')
|
|
56
|
+
|
|
57
|
+
svg = plotly_print.to_svg(fig)
|
|
58
|
+
png = plotly_print.to_image(fig, format='png', scale=2)
|
|
59
|
+
plotly_print.write_image(fig, 'chart.png')
|
|
60
|
+
```
|
|
61
|
+
|
|
62
|
+
`to_image` returns bytes. `write_image` writes to a path or binary file object. Supported formats are SVG, PNG, JPEG, and WebP.
|
|
63
|
+
|
|
64
|
+
## Plotly integration
|
|
65
|
+
|
|
66
|
+
Patch Plotly's existing image-export methods:
|
|
67
|
+
|
|
68
|
+
```python
|
|
69
|
+
import plotly_print
|
|
70
|
+
|
|
71
|
+
plotly_print.register()
|
|
72
|
+
```
|
|
73
|
+
|
|
74
|
+
After registration, existing calls such as `fig.write_image("chart.png")` use plotly-print. Call `plotly_print.unregister()` to restore Plotly's original methods.
|
|
75
|
+
|
|
76
|
+
plotly-print targets 2D static charts. The bundled Plotly.js build and its licenses are documented in [THIRD_PARTY_NOTICES.md](THIRD_PARTY_NOTICES.md).
|
|
77
|
+
|
|
78
|
+
<!-- BENCHMARK-START -->
|
|
79
|
+
|
|
80
|
+
## Benchmarks
|
|
81
|
+
|
|
82
|
+
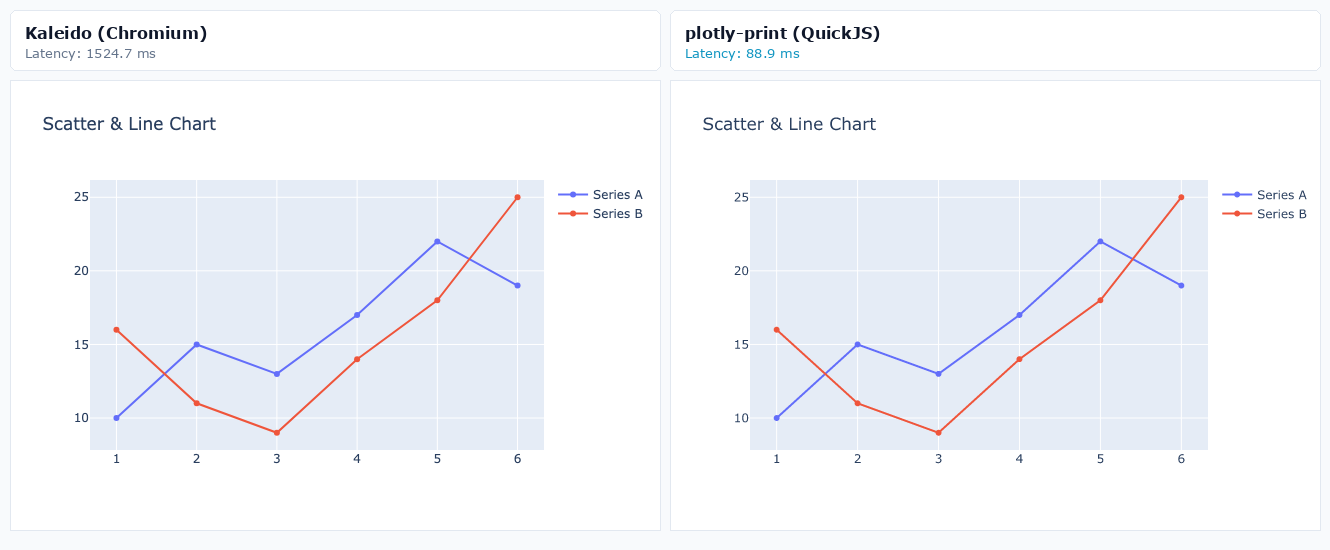
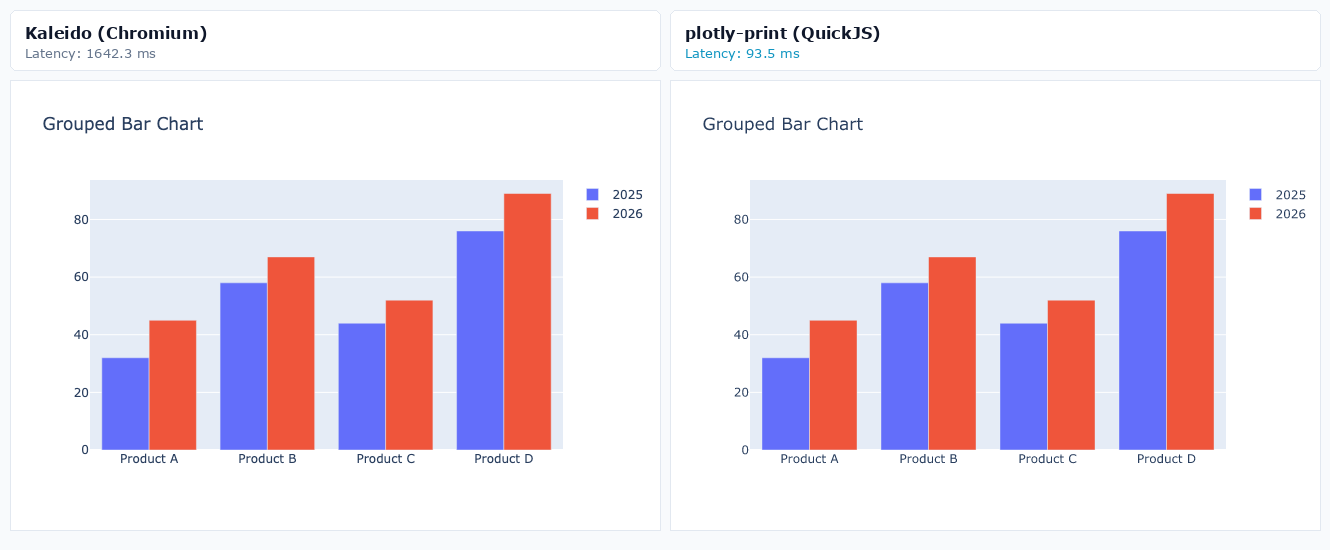
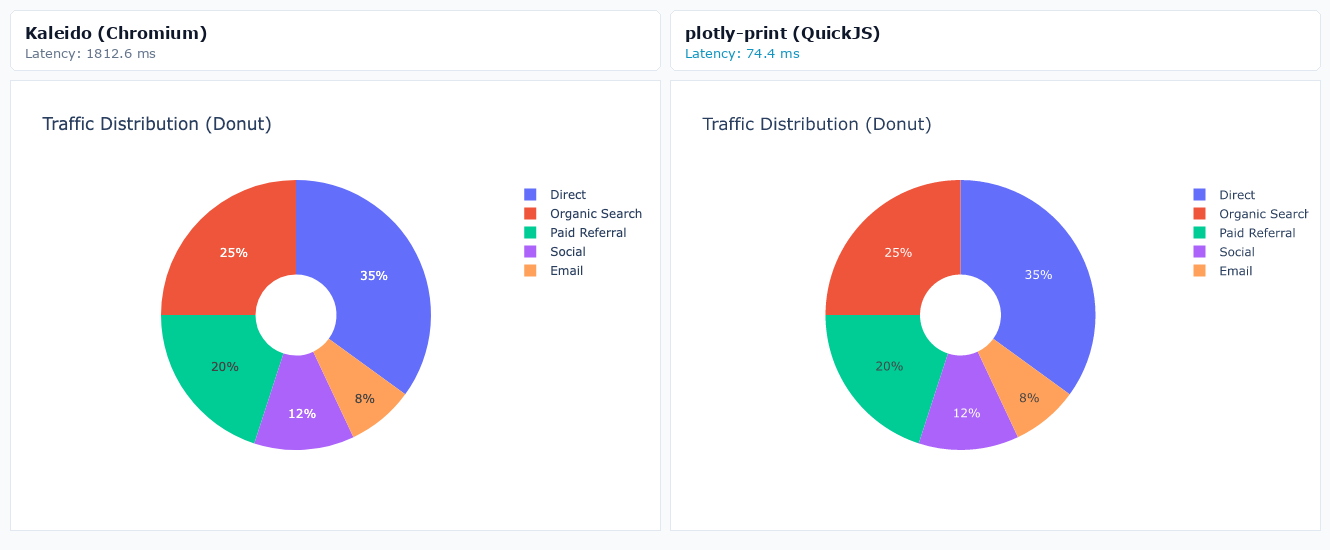
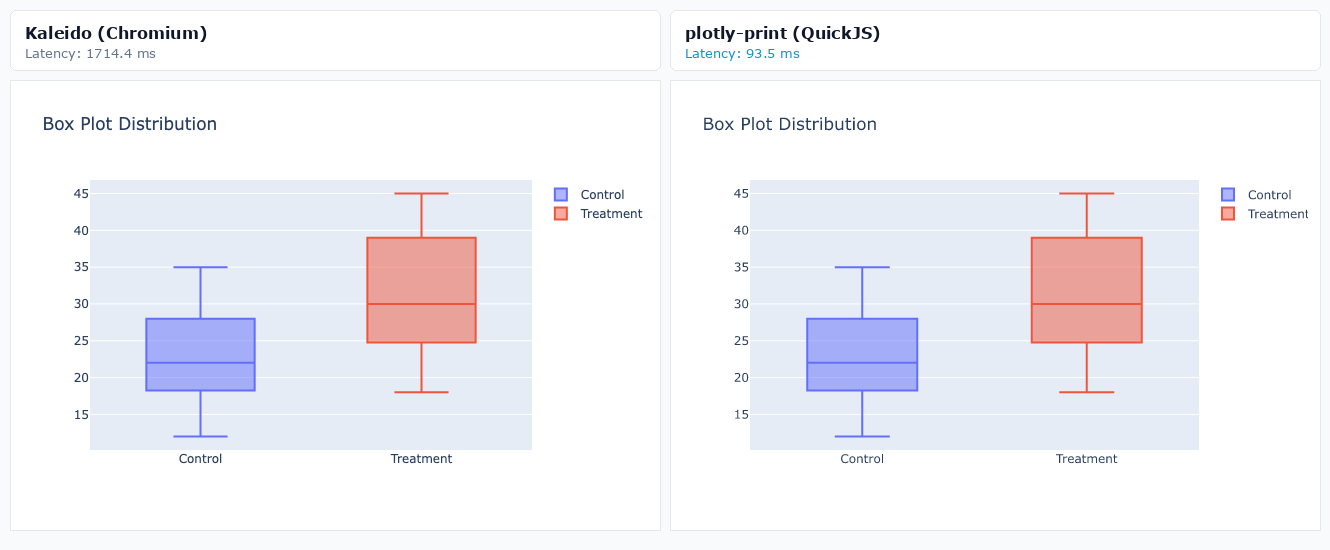
On this run, plotly-print exported all 29 chart types **11x to 33x faster** than Kaleido.
|
|
83
|
+
|
|
84
|
+
These are mean per-image PNG export times after both engines were warmed up. Timings are machine-specific; use the side-by-side images below to evaluate rendering differences.
|
|
85
|
+
|
|
86
|
+
See the [raw results](assets/benchmarks/benchmark_summary.json) or [run the benchmark locally](CONTRIBUTING.md#kaleido-visual-benchmark).
|
|
87
|
+
|
|
88
|
+
| Category | Chart Type | plotly-print | Kaleido | Speedup |
|
|
89
|
+
| :----------------------- | :---------------------------------------- | :----------: | :-------: | :-------: |
|
|
90
|
+
| **Core Cartesian** | Scatter & Line Chart | **88.9 ms** | 1524.7 ms | **17.1x** |
|
|
91
|
+
| **Core Cartesian** | Grouped Bar Chart | **93.5 ms** | 1642.3 ms | **17.6x** |
|
|
92
|
+
| **Core Cartesian** | Donut / Pie Chart | **74.4 ms** | 1812.6 ms | **24.4x** |
|
|
93
|
+
| **Core Cartesian** | Box Plot | **93.5 ms** | 1714.4 ms | **18.3x** |
|
|
94
|
+
| **Core Cartesian** | Violin Plot | **86.5 ms** | 1626.1 ms | **18.8x** |
|
|
95
|
+
| **Core Cartesian** | Frequency Histogram | **105.5 ms** | 1556.6 ms | **14.8x** |
|
|
96
|
+
| **Core Cartesian** | 2D Density Histogram | **105.5 ms** | 1696.5 ms | **16.1x** |
|
|
97
|
+
| **Core Cartesian** | 2D Contour Plot | **135.8 ms** | 1744.5 ms | **12.8x** |
|
|
98
|
+
| **Core Cartesian** | Performance Heatmap | **95.4 ms** | 1647.1 ms | **17.3x** |
|
|
99
|
+
| **Core Cartesian** | Ternary Phase Diagram | **95.8 ms** | 1639.1 ms | **17.1x** |
|
|
100
|
+
| **Financial & Business** | Candlestick Stock Chart | **125.6 ms** | 1618.5 ms | **12.9x** |
|
|
101
|
+
| **Financial & Business** | OHLC Financial Chart | **159.2 ms** | 1686.0 ms | **10.6x** |
|
|
102
|
+
| **Financial & Business** | Waterfall Profit & Loss | **67.1 ms** | 1561.6 ms | **23.3x** |
|
|
103
|
+
| **Financial & Business** | Sales Conversion Funnel | **102.3 ms** | 1620.2 ms | **15.8x** |
|
|
104
|
+
| **Financial & Business** | Funnel Area Analysis | **59.2 ms** | 1593.7 ms | **26.9x** |
|
|
105
|
+
| **Financial & Business** | KPI Performance Indicator | **69.9 ms** | 1607.4 ms | **23.0x** |
|
|
106
|
+
| **Hierarchical** | Market Cap Treemap | **52.9 ms** | 1672.0 ms | **31.6x** |
|
|
107
|
+
| **Hierarchical** | Global Sunburst Hierarchy | **69.8 ms** | 1665.6 ms | **23.9x** |
|
|
108
|
+
| **Hierarchical** | Icicle Partition Chart | **59.8 ms** | 1662.9 ms | **27.8x** |
|
|
109
|
+
| **Radial & Polar** | Radar Performance Comparison | **98.2 ms** | 1689.3 ms | **17.2x** |
|
|
110
|
+
| **Radial & Polar** | Polar Wind Rose | **78.3 ms** | 1581.8 ms | **20.2x** |
|
|
111
|
+
| **Specialized Diagrams** | Energy Flow Sankey Diagram | **47.6 ms** | 1593.5 ms | **33.5x** |
|
|
112
|
+
| **Specialized Diagrams** | Parallel Categories Diagram | **68.7 ms** | 1551.1 ms | **22.6x** |
|
|
113
|
+
| **Specialized Diagrams** | Formatted Data Table | **96.7 ms** | 1588.6 ms | **16.4x** |
|
|
114
|
+
| **Specialized Diagrams** | Carpet Coordinate Plot | **99.5 ms** | 1647.8 ms | **16.6x** |
|
|
115
|
+
| **Layout edge cases** | Bar chart with X labels at 45 deg | **92.5 ms** | 1741.8 ms | **18.8x** |
|
|
116
|
+
| **Layout edge cases** | Bar chart with X labels at 90 deg | **101.8 ms** | 1609.2 ms | **15.8x** |
|
|
117
|
+
| **Layout edge cases** | Annotation arrowheads (incl. circle) | **86.5 ms** | 1663.2 ms | **19.2x** |
|
|
118
|
+
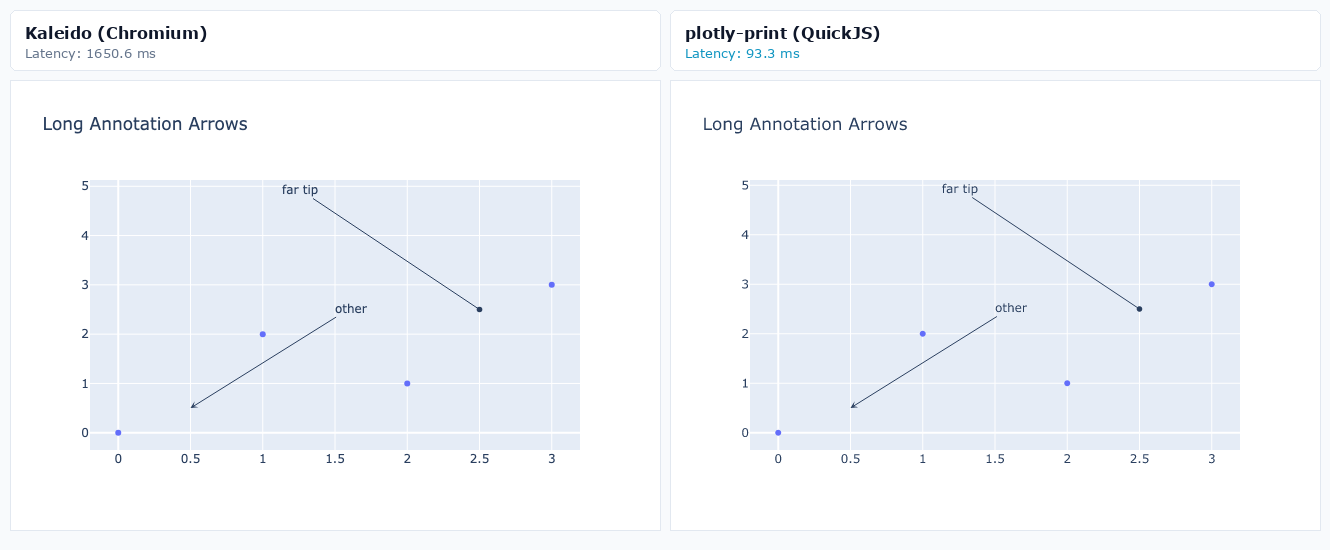
| **Layout edge cases** | Long annotation arrows (dasharray length) | **93.3 ms** | 1650.6 ms | **17.7x** |
|
|
119
|
+
|
|
120
|
+
## Visual comparisons
|
|
121
|
+
|
|
122
|
+
Side-by-side PNGs (Kaleido left, plotly-print right):
|
|
123
|
+
|
|
124
|
+
### Core Cartesian
|
|
125
|
+
|
|
126
|
+
#### Scatter & Line Chart (plotly-print: 88.9ms | Kaleido: 1524.7ms)
|
|
127
|
+
|
|
128
|
+
|
|
129
|
+
|
|
130
|
+
#### Grouped Bar Chart (plotly-print: 93.5ms | Kaleido: 1642.3ms)
|
|
131
|
+
|
|
132
|
+
|
|
133
|
+
|
|
134
|
+
#### Donut / Pie Chart (plotly-print: 74.4ms | Kaleido: 1812.6ms)
|
|
135
|
+
|
|
136
|
+
|
|
137
|
+
|
|
138
|
+
#### Box Plot (plotly-print: 93.5ms | Kaleido: 1714.4ms)
|
|
139
|
+
|
|
140
|
+
|
|
141
|
+
|
|
142
|
+
#### Violin Plot (plotly-print: 86.5ms | Kaleido: 1626.1ms)
|
|
143
|
+
|
|
144
|
+
|
|
145
|
+
|
|
146
|
+
#### Frequency Histogram (plotly-print: 105.5ms | Kaleido: 1556.6ms)
|
|
147
|
+
|
|
148
|
+
|
|
149
|
+
|
|
150
|
+
#### 2D Density Histogram (plotly-print: 105.5ms | Kaleido: 1696.5ms)
|
|
151
|
+
|
|
152
|
+
|
|
153
|
+
|
|
154
|
+
#### 2D Contour Plot (plotly-print: 135.8ms | Kaleido: 1744.5ms)
|
|
155
|
+
|
|
156
|
+
|
|
157
|
+
|
|
158
|
+
#### Performance Heatmap (plotly-print: 95.4ms | Kaleido: 1647.1ms)
|
|
159
|
+
|
|
160
|
+
|
|
161
|
+
|
|
162
|
+
#### Ternary Phase Diagram (plotly-print: 95.8ms | Kaleido: 1639.1ms)
|
|
163
|
+
|
|
164
|
+
|
|
165
|
+
|
|
166
|
+
### Financial & Business
|
|
167
|
+
|
|
168
|
+
#### Candlestick Stock Chart (plotly-print: 125.6ms | Kaleido: 1618.5ms)
|
|
169
|
+
|
|
170
|
+
|
|
171
|
+
|
|
172
|
+
#### OHLC Financial Chart (plotly-print: 159.2ms | Kaleido: 1686.0ms)
|
|
173
|
+
|
|
174
|
+
|
|
175
|
+
|
|
176
|
+
#### Waterfall Profit & Loss (plotly-print: 67.1ms | Kaleido: 1561.6ms)
|
|
177
|
+
|
|
178
|
+
|
|
179
|
+
|
|
180
|
+
#### Sales Conversion Funnel (plotly-print: 102.3ms | Kaleido: 1620.2ms)
|
|
181
|
+
|
|
182
|
+
|
|
183
|
+
|
|
184
|
+
#### Funnel Area Analysis (plotly-print: 59.2ms | Kaleido: 1593.7ms)
|
|
185
|
+
|
|
186
|
+
|
|
187
|
+
|
|
188
|
+
#### KPI Performance Indicator (plotly-print: 69.9ms | Kaleido: 1607.4ms)
|
|
189
|
+
|
|
190
|
+
|
|
191
|
+
|
|
192
|
+
### Hierarchical
|
|
193
|
+
|
|
194
|
+
#### Market Cap Treemap (plotly-print: 52.9ms | Kaleido: 1672.0ms)
|
|
195
|
+
|
|
196
|
+
|
|
197
|
+
|
|
198
|
+
#### Global Sunburst Hierarchy (plotly-print: 69.8ms | Kaleido: 1665.6ms)
|
|
199
|
+
|
|
200
|
+
|
|
201
|
+
|
|
202
|
+
#### Icicle Partition Chart (plotly-print: 59.8ms | Kaleido: 1662.9ms)
|
|
203
|
+
|
|
204
|
+
|
|
205
|
+
|
|
206
|
+
### Radial & Polar
|
|
207
|
+
|
|
208
|
+
#### Radar Performance Comparison (plotly-print: 98.2ms | Kaleido: 1689.3ms)
|
|
209
|
+
|
|
210
|
+
|
|
211
|
+
|
|
212
|
+
#### Polar Wind Rose (plotly-print: 78.3ms | Kaleido: 1581.8ms)
|
|
213
|
+
|
|
214
|
+
|
|
215
|
+
|
|
216
|
+
### Specialized Diagrams
|
|
217
|
+
|
|
218
|
+
#### Energy Flow Sankey Diagram (plotly-print: 47.6ms | Kaleido: 1593.5ms)
|
|
219
|
+
|
|
220
|
+
|
|
221
|
+
|
|
222
|
+
#### Parallel Categories Diagram (plotly-print: 68.7ms | Kaleido: 1551.1ms)
|
|
223
|
+
|
|
224
|
+
|
|
225
|
+
|
|
226
|
+
#### Formatted Data Table (plotly-print: 96.7ms | Kaleido: 1588.6ms)
|
|
227
|
+
|
|
228
|
+
|
|
229
|
+
|
|
230
|
+
#### Carpet Coordinate Plot (plotly-print: 99.5ms | Kaleido: 1647.8ms)
|
|
231
|
+
|
|
232
|
+
|
|
233
|
+
|
|
234
|
+
### Layout edge cases
|
|
235
|
+
|
|
236
|
+
#### Bar chart with X labels at 45 deg (plotly-print: 92.5ms | Kaleido: 1741.8ms)
|
|
237
|
+
|
|
238
|
+
|
|
239
|
+
|
|
240
|
+
#### Bar chart with X labels at 90 deg (plotly-print: 101.8ms | Kaleido: 1609.2ms)
|
|
241
|
+
|
|
242
|
+
|
|
243
|
+
|
|
244
|
+
#### Annotation arrowheads (incl. circle) (plotly-print: 86.5ms | Kaleido: 1663.2ms)
|
|
245
|
+
|
|
246
|
+
|
|
247
|
+
|
|
248
|
+
#### Long annotation arrows (dasharray length) (plotly-print: 93.3ms | Kaleido: 1650.6ms)
|
|
249
|
+
|
|
250
|
+
|
|
251
|
+
|
|
252
|
+
<!-- BENCHMARK-END -->
|
|
253
|
+
|
|
254
|
+
## Attribution
|
|
255
|
+
|
|
256
|
+
plotly-print is an independent project derived from [Mirage](https://github.com/ProfLear/mirage) by Benjamin Lear (MIT). Bundled plotly.js is copyright Plotly, Inc. (MIT); see [THIRD_PARTY_NOTICES.md](THIRD_PARTY_NOTICES.md).
|
|
@@ -0,0 +1,230 @@
|
|
|
1
|
+
# plotly-print
|
|
2
|
+
|
|
3
|
+
[](https://github.com/roman-kaczanowski/plotly-print/actions/workflows/quality-checks.yml) [](https://pypi.org/project/plotly-print/) [](https://docs.python.org/3/) [](LICENSE)
|
|
4
|
+
|
|
5
|
+
Export Plotly figures to SVG, PNG, JPEG, or WebP without launching Chrome.
|
|
6
|
+
|
|
7
|
+
plotly-print runs a bundled Plotly.js 2D build in QuickJS, then uses `resvg-py` for raster output. It works offline, has no browser process to install or manage, and can replace Plotly's image-export methods with one call.
|
|
8
|
+
|
|
9
|
+
- Browser-free: no Chrome, Chromium, or Playwright.
|
|
10
|
+
- Fast: avoids browser startup; see the measured [benchmarks](#benchmarks).
|
|
11
|
+
- Familiar: use the direct API or patch Plotly's existing `to_image` and `write_image` methods.
|
|
12
|
+
|
|
13
|
+
[Install](#installation) | [Direct API](#direct-api) | [Plotly integration](#plotly-integration) | [Benchmarks](#benchmarks)
|
|
14
|
+
|
|
15
|
+
## Installation
|
|
16
|
+
|
|
17
|
+
```bash
|
|
18
|
+
pip install plotly-print
|
|
19
|
+
```
|
|
20
|
+
|
|
21
|
+
Requires Python 3.12 or newer.
|
|
22
|
+
|
|
23
|
+
## Direct API
|
|
24
|
+
|
|
25
|
+
```python
|
|
26
|
+
import plotly.express as px
|
|
27
|
+
import plotly_print
|
|
28
|
+
|
|
29
|
+
fig = px.scatter(x=[1, 2, 3, 4], y=[10, 11, 12, 13], title='Sales Growth')
|
|
30
|
+
|
|
31
|
+
svg = plotly_print.to_svg(fig)
|
|
32
|
+
png = plotly_print.to_image(fig, format='png', scale=2)
|
|
33
|
+
plotly_print.write_image(fig, 'chart.png')
|
|
34
|
+
```
|
|
35
|
+
|
|
36
|
+
`to_image` returns bytes. `write_image` writes to a path or binary file object. Supported formats are SVG, PNG, JPEG, and WebP.
|
|
37
|
+
|
|
38
|
+
## Plotly integration
|
|
39
|
+
|
|
40
|
+
Patch Plotly's existing image-export methods:
|
|
41
|
+
|
|
42
|
+
```python
|
|
43
|
+
import plotly_print
|
|
44
|
+
|
|
45
|
+
plotly_print.register()
|
|
46
|
+
```
|
|
47
|
+
|
|
48
|
+
After registration, existing calls such as `fig.write_image("chart.png")` use plotly-print. Call `plotly_print.unregister()` to restore Plotly's original methods.
|
|
49
|
+
|
|
50
|
+
plotly-print targets 2D static charts. The bundled Plotly.js build and its licenses are documented in [THIRD_PARTY_NOTICES.md](THIRD_PARTY_NOTICES.md).
|
|
51
|
+
|
|
52
|
+
<!-- BENCHMARK-START -->
|
|
53
|
+
|
|
54
|
+
## Benchmarks
|
|
55
|
+
|
|
56
|
+
On this run, plotly-print exported all 29 chart types **11x to 33x faster** than Kaleido.
|
|
57
|
+
|
|
58
|
+
These are mean per-image PNG export times after both engines were warmed up. Timings are machine-specific; use the side-by-side images below to evaluate rendering differences.
|
|
59
|
+
|
|
60
|
+
See the [raw results](assets/benchmarks/benchmark_summary.json) or [run the benchmark locally](CONTRIBUTING.md#kaleido-visual-benchmark).
|
|
61
|
+
|
|
62
|
+
| Category | Chart Type | plotly-print | Kaleido | Speedup |
|
|
63
|
+
| :----------------------- | :---------------------------------------- | :----------: | :-------: | :-------: |
|
|
64
|
+
| **Core Cartesian** | Scatter & Line Chart | **88.9 ms** | 1524.7 ms | **17.1x** |
|
|
65
|
+
| **Core Cartesian** | Grouped Bar Chart | **93.5 ms** | 1642.3 ms | **17.6x** |
|
|
66
|
+
| **Core Cartesian** | Donut / Pie Chart | **74.4 ms** | 1812.6 ms | **24.4x** |
|
|
67
|
+
| **Core Cartesian** | Box Plot | **93.5 ms** | 1714.4 ms | **18.3x** |
|
|
68
|
+
| **Core Cartesian** | Violin Plot | **86.5 ms** | 1626.1 ms | **18.8x** |
|
|
69
|
+
| **Core Cartesian** | Frequency Histogram | **105.5 ms** | 1556.6 ms | **14.8x** |
|
|
70
|
+
| **Core Cartesian** | 2D Density Histogram | **105.5 ms** | 1696.5 ms | **16.1x** |
|
|
71
|
+
| **Core Cartesian** | 2D Contour Plot | **135.8 ms** | 1744.5 ms | **12.8x** |
|
|
72
|
+
| **Core Cartesian** | Performance Heatmap | **95.4 ms** | 1647.1 ms | **17.3x** |
|
|
73
|
+
| **Core Cartesian** | Ternary Phase Diagram | **95.8 ms** | 1639.1 ms | **17.1x** |
|
|
74
|
+
| **Financial & Business** | Candlestick Stock Chart | **125.6 ms** | 1618.5 ms | **12.9x** |
|
|
75
|
+
| **Financial & Business** | OHLC Financial Chart | **159.2 ms** | 1686.0 ms | **10.6x** |
|
|
76
|
+
| **Financial & Business** | Waterfall Profit & Loss | **67.1 ms** | 1561.6 ms | **23.3x** |
|
|
77
|
+
| **Financial & Business** | Sales Conversion Funnel | **102.3 ms** | 1620.2 ms | **15.8x** |
|
|
78
|
+
| **Financial & Business** | Funnel Area Analysis | **59.2 ms** | 1593.7 ms | **26.9x** |
|
|
79
|
+
| **Financial & Business** | KPI Performance Indicator | **69.9 ms** | 1607.4 ms | **23.0x** |
|
|
80
|
+
| **Hierarchical** | Market Cap Treemap | **52.9 ms** | 1672.0 ms | **31.6x** |
|
|
81
|
+
| **Hierarchical** | Global Sunburst Hierarchy | **69.8 ms** | 1665.6 ms | **23.9x** |
|
|
82
|
+
| **Hierarchical** | Icicle Partition Chart | **59.8 ms** | 1662.9 ms | **27.8x** |
|
|
83
|
+
| **Radial & Polar** | Radar Performance Comparison | **98.2 ms** | 1689.3 ms | **17.2x** |
|
|
84
|
+
| **Radial & Polar** | Polar Wind Rose | **78.3 ms** | 1581.8 ms | **20.2x** |
|
|
85
|
+
| **Specialized Diagrams** | Energy Flow Sankey Diagram | **47.6 ms** | 1593.5 ms | **33.5x** |
|
|
86
|
+
| **Specialized Diagrams** | Parallel Categories Diagram | **68.7 ms** | 1551.1 ms | **22.6x** |
|
|
87
|
+
| **Specialized Diagrams** | Formatted Data Table | **96.7 ms** | 1588.6 ms | **16.4x** |
|
|
88
|
+
| **Specialized Diagrams** | Carpet Coordinate Plot | **99.5 ms** | 1647.8 ms | **16.6x** |
|
|
89
|
+
| **Layout edge cases** | Bar chart with X labels at 45 deg | **92.5 ms** | 1741.8 ms | **18.8x** |
|
|
90
|
+
| **Layout edge cases** | Bar chart with X labels at 90 deg | **101.8 ms** | 1609.2 ms | **15.8x** |
|
|
91
|
+
| **Layout edge cases** | Annotation arrowheads (incl. circle) | **86.5 ms** | 1663.2 ms | **19.2x** |
|
|
92
|
+
| **Layout edge cases** | Long annotation arrows (dasharray length) | **93.3 ms** | 1650.6 ms | **17.7x** |
|
|
93
|
+
|
|
94
|
+
## Visual comparisons
|
|
95
|
+
|
|
96
|
+
Side-by-side PNGs (Kaleido left, plotly-print right):
|
|
97
|
+
|
|
98
|
+
### Core Cartesian
|
|
99
|
+
|
|
100
|
+
#### Scatter & Line Chart (plotly-print: 88.9ms | Kaleido: 1524.7ms)
|
|
101
|
+
|
|
102
|
+

|
|
103
|
+
|
|
104
|
+
#### Grouped Bar Chart (plotly-print: 93.5ms | Kaleido: 1642.3ms)
|
|
105
|
+
|
|
106
|
+

|
|
107
|
+
|
|
108
|
+
#### Donut / Pie Chart (plotly-print: 74.4ms | Kaleido: 1812.6ms)
|
|
109
|
+
|
|
110
|
+

|
|
111
|
+
|
|
112
|
+
#### Box Plot (plotly-print: 93.5ms | Kaleido: 1714.4ms)
|
|
113
|
+
|
|
114
|
+

|
|
115
|
+
|
|
116
|
+
#### Violin Plot (plotly-print: 86.5ms | Kaleido: 1626.1ms)
|
|
117
|
+
|
|
118
|
+

|
|
119
|
+
|
|
120
|
+
#### Frequency Histogram (plotly-print: 105.5ms | Kaleido: 1556.6ms)
|
|
121
|
+
|
|
122
|
+

|
|
123
|
+
|
|
124
|
+
#### 2D Density Histogram (plotly-print: 105.5ms | Kaleido: 1696.5ms)
|
|
125
|
+
|
|
126
|
+

|
|
127
|
+
|
|
128
|
+
#### 2D Contour Plot (plotly-print: 135.8ms | Kaleido: 1744.5ms)
|
|
129
|
+
|
|
130
|
+

|
|
131
|
+
|
|
132
|
+
#### Performance Heatmap (plotly-print: 95.4ms | Kaleido: 1647.1ms)
|
|
133
|
+
|
|
134
|
+

|
|
135
|
+
|
|
136
|
+
#### Ternary Phase Diagram (plotly-print: 95.8ms | Kaleido: 1639.1ms)
|
|
137
|
+
|
|
138
|
+

|
|
139
|
+
|
|
140
|
+
### Financial & Business
|
|
141
|
+
|
|
142
|
+
#### Candlestick Stock Chart (plotly-print: 125.6ms | Kaleido: 1618.5ms)
|
|
143
|
+
|
|
144
|
+

|
|
145
|
+
|
|
146
|
+
#### OHLC Financial Chart (plotly-print: 159.2ms | Kaleido: 1686.0ms)
|
|
147
|
+
|
|
148
|
+

|
|
149
|
+
|
|
150
|
+
#### Waterfall Profit & Loss (plotly-print: 67.1ms | Kaleido: 1561.6ms)
|
|
151
|
+
|
|
152
|
+

|
|
153
|
+
|
|
154
|
+
#### Sales Conversion Funnel (plotly-print: 102.3ms | Kaleido: 1620.2ms)
|
|
155
|
+
|
|
156
|
+

|
|
157
|
+
|
|
158
|
+
#### Funnel Area Analysis (plotly-print: 59.2ms | Kaleido: 1593.7ms)
|
|
159
|
+
|
|
160
|
+

|
|
161
|
+
|
|
162
|
+
#### KPI Performance Indicator (plotly-print: 69.9ms | Kaleido: 1607.4ms)
|
|
163
|
+
|
|
164
|
+

|
|
165
|
+
|
|
166
|
+
### Hierarchical
|
|
167
|
+
|
|
168
|
+
#### Market Cap Treemap (plotly-print: 52.9ms | Kaleido: 1672.0ms)
|
|
169
|
+
|
|
170
|
+

|
|
171
|
+
|
|
172
|
+
#### Global Sunburst Hierarchy (plotly-print: 69.8ms | Kaleido: 1665.6ms)
|
|
173
|
+
|
|
174
|
+

|
|
175
|
+
|
|
176
|
+
#### Icicle Partition Chart (plotly-print: 59.8ms | Kaleido: 1662.9ms)
|
|
177
|
+
|
|
178
|
+

|
|
179
|
+
|
|
180
|
+
### Radial & Polar
|
|
181
|
+
|
|
182
|
+
#### Radar Performance Comparison (plotly-print: 98.2ms | Kaleido: 1689.3ms)
|
|
183
|
+
|
|
184
|
+

|
|
185
|
+
|
|
186
|
+
#### Polar Wind Rose (plotly-print: 78.3ms | Kaleido: 1581.8ms)
|
|
187
|
+
|
|
188
|
+

|
|
189
|
+
|
|
190
|
+
### Specialized Diagrams
|
|
191
|
+
|
|
192
|
+
#### Energy Flow Sankey Diagram (plotly-print: 47.6ms | Kaleido: 1593.5ms)
|
|
193
|
+
|
|
194
|
+

|
|
195
|
+
|
|
196
|
+
#### Parallel Categories Diagram (plotly-print: 68.7ms | Kaleido: 1551.1ms)
|
|
197
|
+
|
|
198
|
+

|
|
199
|
+
|
|
200
|
+
#### Formatted Data Table (plotly-print: 96.7ms | Kaleido: 1588.6ms)
|
|
201
|
+
|
|
202
|
+

|
|
203
|
+
|
|
204
|
+
#### Carpet Coordinate Plot (plotly-print: 99.5ms | Kaleido: 1647.8ms)
|
|
205
|
+
|
|
206
|
+

|
|
207
|
+
|
|
208
|
+
### Layout edge cases
|
|
209
|
+
|
|
210
|
+
#### Bar chart with X labels at 45 deg (plotly-print: 92.5ms | Kaleido: 1741.8ms)
|
|
211
|
+
|
|
212
|
+

|
|
213
|
+
|
|
214
|
+
#### Bar chart with X labels at 90 deg (plotly-print: 101.8ms | Kaleido: 1609.2ms)
|
|
215
|
+
|
|
216
|
+

|
|
217
|
+
|
|
218
|
+
#### Annotation arrowheads (incl. circle) (plotly-print: 86.5ms | Kaleido: 1663.2ms)
|
|
219
|
+
|
|
220
|
+

|
|
221
|
+
|
|
222
|
+
#### Long annotation arrows (dasharray length) (plotly-print: 93.3ms | Kaleido: 1650.6ms)
|
|
223
|
+
|
|
224
|
+

|
|
225
|
+
|
|
226
|
+
<!-- BENCHMARK-END -->
|
|
227
|
+
|
|
228
|
+
## Attribution
|
|
229
|
+
|
|
230
|
+
plotly-print is an independent project derived from [Mirage](https://github.com/ProfLear/mirage) by Benjamin Lear (MIT). Bundled plotly.js is copyright Plotly, Inc. (MIT); see [THIRD_PARTY_NOTICES.md](THIRD_PARTY_NOTICES.md).
|
|
@@ -2,12 +2,12 @@
|
|
|
2
2
|
|
|
3
3
|
## plotly.js
|
|
4
4
|
|
|
5
|
-
File: `src/plotly_print/js/
|
|
5
|
+
File: `src/plotly_print/js/plotly_comprehensive_2d.js`
|
|
6
6
|
|
|
7
|
-
|
|
8
|
-
|
|
9
|
-
does not load in
|
|
10
|
-
instead.
|
|
7
|
+
Redistributed plotly.js build (minified) used for offline / isolated 2D static
|
|
8
|
+
rendering in the embedded QuickJS runtime. The full `plotly.min.js` shipped with
|
|
9
|
+
the `plotly` Python package does not load in that runtime, so this smaller
|
|
10
|
+
bundle is included instead.
|
|
11
11
|
|
|
12
12
|
Copyright 2012-2026, Plotly, Inc.
|
|
13
13
|
All rights reserved.
|